Abstract
Autism spectrum disorder (ASD) is a series of complex neurobiological disorders. Adolescents and young adults with ASD are more likely to develop type 2 diabetes mellitus in their later life than those who are not. However, whether ASD patients exhibited a pre-diabetic phenotype in their childhood is still unknown. To answer this question, here we presented this study which focus on whether oral glucose tolerance, insulin and C-peptide release were changed in children with ASD. We recruited 17 patients and 17 age and sex-matched typically developing children in our study. In our study, the fasting blood glucose was significantly decreased in children with ASD. Moreover, two children in the ASD group had impaired glucose tolerance according to 2-hour postprandial blood glucose level. The C-peptide level at 30 minutes after glucose administration in the ASD group was significantly lower than that in the control group. Moreover, four children in the ASD group showed a phenomenon of delayed insulin secretion. All these results suggested that a subgroup of children with ASD might exhibit a pre-diabetic phenotype during early childhood. Finally, this study might bring about new therapeutic interventions for children with ASD.
Lay Summary: The etiology of ASD seems to involve an intricate interplay of genetic, environmental and metabolic disorders. Adolescents and young adults with ASD are more likely to develop type 2 diabetes mellitus in their later life. It is important to find out whether ASD patients exhibited a pre-diabetic phenotype in their childhood. This study provided evidence for dysfunction risk of glucose metabolism in ASD and revealed a pre-diabetes phenotype in children with ASD.
Keywords
ASD, Blood glucose, Insulin, C-peptide, IGT
Introduction
ASD refers to a group of complex neurodevelopmental disorders, characterized by deficits in social communication, interaction and demonstrating restricted, repetitive, and stereotyped patterns of behavior. Centers for Disease Control and Prevention forecasted that the prevalence of ASD would be 1 in 45 in USA [1]. A metaanalysis of the public health and primary care centers in the UK estimated that the prevalence of ASD was 26.6 per 10,000 in mainland, based on eighteen epidemiological studies [2]. Vast clinical heterogeneity is an important feature of ASD. ASD exists tremendous phenotypic heterogeneity in neurological comorbidities, language and cognitive abilities, and adaptive function [3]. ASD patients often have co-occurring seizures, sleep problems, metabolic disorders and gastrointestinal (GI) disorders [ 4] Some children with ASD suffer from metabolic problems, including abnormal tyrosine, phenylalanine, tryptophan, asparagine and arginine metabolic pathways [ 5] Many factors have been demonstrated to be involved in the etiology of ASD, including gut microbiota imbalance [6-8], increased inflammation [9,10], immune system dysfunction [11,12] and altered metabolic capacity [ 13,14]. Thus, characterizing biological subtypes of ASD will play a key role in diagnosis and treatment.
Nowadays, diabetes mellitus (DM) becomes a global health problem. A higher rate of obesity, impaired glucose tolerance (IGT), cardiovascular and metabolic disorders would increase the risk of neurobehavioral disorders and intellectual disability [15]. Newborns from mothers with gestational diabetes mellitus (GDM) tend to exhibit impaired motor functions, hyperactivity, inattention, and lower intelligence quotient (IQ) scores [16,17]. Type 2 diabetes mellitus (T2DM) can affect cognition and increase dementia risks [18]. Individuals with T2DM during experimental hyperglycemia presented impairments in cognitive and mood state performance [19]. Maternal history of type 1 diabetes mellitus (T1DM) is associated with increased risk of infantile autism in offspring [20]. Another study showed that GDM was associated with the risk of ASD in offspring [21]. Besides, a longitudinal study in Taiwan discovered that adolescents and young adults with ASD were more likely to develop T2DM in their later life [22]. In addition, obesity and diabetes were more common among mothers of children with ASD compared with controls [23]. Compared with typically developing children, the relative risk of overweight and obesity in children with ASD was 2.24 and 4.83, respectively [24]. Obesity and overweight can also increase the prevalence of T2DM and the low-grade inflammation caused by obesity can disturb insulin function [25,26].
Insulin resistance and β-cell dysfunction are two development processes of T2DM. Insulin resistance can lead to an increased demand for insulin. With the development of insulin resistance, insulin is insufficient to meet the requirement, and then β-cell dysfunction will emerge. C-peptide is a better measure of portal insulin secretion than insulin itself [27]. Some studies have reported that young adults with ASD were more likely to develop T2DM in their later life. These young adults with ASD may show prediabetes before they are diagnosed as T2DM. Prediabetes is the precursor stage before DM. It is thought to be a risk state, with high possibilities of developing DM. Impaired fasting blood sugar and IGT are two forms of prediabetes. Early diagnosis and intervention can cure prediabetes and prevent the development of DM [28,29].
However, researches about the association between DM and ASD mainly focused on maternal diabetes. Few studies have focused on glucose metabolism, insulin and C-peptide secretion in children with ASD. Whether precursor symptoms of DM such as insulin resistance and IGT occurred in their childhood are still unknown. To answer this question, we performed oral glucose tolerance test (OGTT), insulin and C peptide release tests in children with ASD and the control children. The results showed that fasting blood glucose significantly decreased in children with ASD and two children in the ASD group had IGT. Moreover, four children in the ASD group showed a phenomenon of delayed insulin secretion.
Methods
Participants
Children with ASD were recruited from Snail Baby family fraternity. All ASD children participating in this study were diagnosed with Autism Diagnostic Observation Schedule (ADOS). The ADOS diagnostic procedure was performed by a qualified evaluator. Individual patients fulfilling the ADOS diagnostic procedure were included. The ADOS is designed to rate behaviors associated with ASD using a semi-structured, and observation-based approach. Each item assessing social communication or repetitive and stereotyped behaviors has a detailed operational definition describing the item theme [30]. Children who had neurological syndromes or focal neurological signs, fragile X syndrome, tuberous sclerosis, Down syndrome and other genetic diseases were excluded.
Control children were recruited from two kindergartens. Children who had psychiatric conditions (such as depressive disorder, attention deficit hyperactivity disorder, schizophrenia and bipolar disorder) were excluded according to their medical examinations for enrollment and parent interview. All participants had no family genetic history of diabetes and did not take medications (such as catecholamine, prazosin and sulfa drugs) in the past month.
At last, 17 children with ASD and 17 typically developing children were enrolled in Beijing between March 2016 and June 2017. The ages of autistic children and normal children were 4 to 8 years.
OGTT, insulin and C peptide release tests
To assess whether autism children emerge alterations in peripheral glucose metabolism, insulin sensitivity and beta cell function, OGTT, insulin and C peptide release tests were performed simultaneously. All participants were fasted for 10-12 hours prior to baseline glucose and then insulin and C peptide measurement were performed with subsequent oral glucose (1.75 g/kg body weight, the total amount not exceeding 75g) in the morning. Venous blood samples were collected before (t=0), 30, 60 and 120 minutes after glucose administration in a grade A tertiary hospital in Beijing. The blood glucose concentration values were plotted against time to form a curve demonstrating the variations in blood glucose levels with time, defined as an integrated area of the curve for blood glucose. The same has been performed for the insulin and C-peptide. All blood samples at the four time points were collected from the children with ASD while only nine typically developing children completed all tests, with the remaining eight children had baseline data.
Homeostatic model assessment of insulin resistance (HOMA-IR) was calculated using homeostasis model assessment methods, defined as fasting insulin (IU/ml) *fasting glucose (mmol/L)/22.5. Homeostatic model assessment of insulin sensitivity (HOMA-IS) was defined as 22.5/ fasting insulin (IU/ml) *fasting glucose (mmol/L) [31].
Diagnostic criteria for IGT
According to the criteria of the American Diabetes Association, IGT is defined as: two-hour glucose levels of 140 to 199 mg per dl (7.8 to 11.0 mmol/l) on the OGTT [32]. A patient is said to be under the condition of IGT when he has an intermediately raised glucose level after two hours, but less than the level that would qualify for T2DM. The fasting glucose may be either normal or mildly elevated.
Statistical analysis
Data were expressed as means ± SEM in this study. Statistical significance was calculated using two-sided independent sample t-tests or Pearson’s two-sided chi squared test. The blood glucose, insulin and C peptide concentration were compared using a two-way ANOVA with repeated measures (2-way RM ANOVA) with sample time as the within-subjects variable (Graph Pad Prism version 6). Bonferroni post-hoc t-tests were performed to estimate the significance at diverse time-points of the glucose tolerance, insulin secretion and C peptide secretion curves. For all analyses, P values were two-tailed and statistical significance was set at P<0 .05.
Results
Demographic data and metabolic characteristics
In our study, there were no statistical differences in age, height, weight and BMI between ASD and control groups. However, maternal age of the ASD group was significantly higher than that of the control group.
There were no significant differences in fasting insulin, fasting C peptide, insulin resistance index and insulin sensitivity index. Table 1 showed detailed information about demographic data and metabolic characteristics.
| ASD group (n=17) Mean (SEM) | Control group (n=17) Mean (SEM) | |
|---|---|---|
| Sex | 3 girls, 14 boys | 3 girls, 14 boys |
| Age | 5.1 (0.20) | 5.3 (0.19)# |
| Height | 110.9 (1.86) | 109.3 (2.25) |
| Weight | 19.7 (0.55) | 19.3 (0.81)# |
| BMI | 16.10 (0.40) | 16.1 (0.28)# |
| Maternal age | 30.4 (0.99) | 26.4 (0.43)** |
| Fasting glucose (mmol/L) | 4.5 (0.16) | 5.0 (0.06)** |
| Fasting insulin (mU/L) | 4.3 (0.75) | 5.0 (0.58)# |
| Fasting C peptide (pmol/L) | 193.52 (4.00) | 244.8 (19.80)# |
| HOMA-IRa | 0.9 (0.18) | 1.1 (0.14)# |
| HOMA-ISb | 1.8 (0.31) | 1.2 (0.23)# |
| ADOS-TSc | 22.2 (0.66) | - |
| ADOS-SCId | 16.3 (0.35) | - |
| aHomeostatic model assessment of insulin resistance, bHomeostatic model assessment of insulin sensitivity, cAutism Diagnostic Observation Schedule-Total Score, dAutism Diagnostic Observation Schedule- Social communication and interaction, # Not significant, *P<0.05, **P<0.01 |
Reduced fasting blood glucose in ASD children
The level of fasting blood glucose in the ASD group was significantly lower than that of the control group (P=0.0055). It might be related to the cognitive dysfunction in children with ASD. Besides, there were three children in the ASD group whose fasting blood glucose was below 4 mmol/L (Figure 1), suggesting insufficient energy supply of these children.
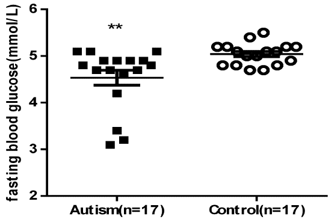
Figure 1. Fasting blood glucose in two groups (histograms consist of mean ± SEM). The ASD group exhibited significantly lower fasting blood glucose than the control group (P=0.0055).
To determine whether the ASD children have altered peripheral glucose regulation, OGTT were performed on ASD and control groups. We found that two children with ASD had IGT according to 2-hour postprandial blood glucose level (8.4 and 8.7 mmol/L). IGT is a pre-diabetic state of hyperglycemia that is associated with insulin resistance. It is a strong predictor of T2DM. This result confirmed our initial speculation that the ASD children might exhibit a pre-diabetic phenotype during early childhood and were more likely to develop into T2DM in their adulthood. We found no IGT in the control group. However, chi-squire analysis showed that the difference was statistically insignificant between ASD and control groups. The hallmark heterogeneity of ASD may be one of the reasons that we did not find statistical differences between the two groups. Nevertheless, our discovery may reflect the impaired glucose metabolism in a subgroup of ASD.
Besides, the results of our study revealed that there was no significant difference of glucose tolerance between two groups (Figure 2). Two-way ANOVA with repeated measures (2-way RM ANOVA) - group: P=0.6543, over time: P<0.0001, interaction: P=0.6499; AUC values (mean ± SEM) were: ASD 738.1 ± 35.54; Control 702.0 ± 27.52; P=0.5028). DM is a chronic disease and many factors involve in the development of it. To further unravel the difference of glucose tolerance between ASD and control groups, a larger sample size is needed.
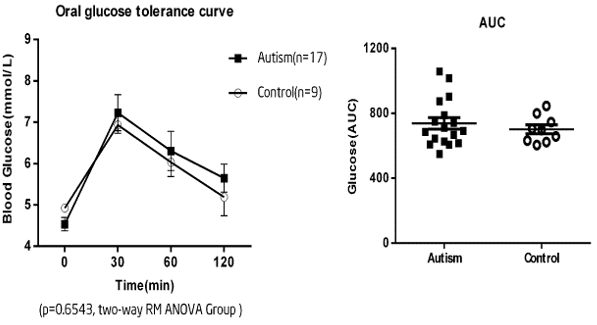
Figure 2. Oral glucose tolerance tests in the two groups. A)The curves indicated that there was no significant glucose tolerance between the two groups (2 way RM ANOVA - Group: P=0.6543, over time: P<0.0001, interaction: P=0.6499). Data expressed as mean ± SEM. B) Similarly, no significant difference was found about the calculated AUC for the two groups (AUC values (mean ± SEM) were: ASD 738.1 ± 35.54; control 702.0 ± 27.52; P=0.5028).
To evaluate whether insulin secretion in the ASD group was changed, blood plasma samples were collected during the OGTT at time 0, 30, 60 and 120 minutes to measure the insulin level. RM ANOVA was used to test the difference of insulin secretion between ASD and control groups. As a result, we found that oral glucose could cause increased plasma insulin in both ASD and control groups (Figure 3). RM ANOVA P<0.0001 time, P=0.7018 group, P=0.7158 interaction; AUC values (mean ± SEM) were: ASD 2756 ± 275.5; control 2487 ± 414.9; P=0.5840). To compare the difference in insulin secretion, we assessed the percent change in insulin levels from time 0 to 30 minutes (Δ-insulin). The unpaired t-test analysis testified no statistical difference between groups in their capacity to release insulin (P=0.919), suggesting unchanged plasma insulin between children with ASD and control children. However, we found that four children in the ASD group showed a delayed insulin secretion (Figure 4). Their peak insulin secretion emerged at time point 120 minutes, suggesting that these children had defective early beta-cell function and a higher risk of developing diabetes. In addition, two children showed a delayed insulin secretion and lower fasting blood glucose. Thus, we speculated that the delayed insulin secretion might be linked to the lower fasting blood glucose.
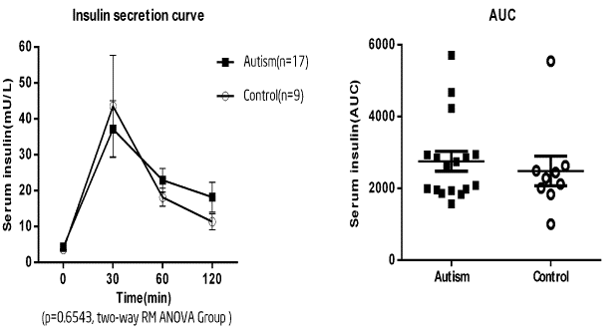
Figure 3. Insulin secretion in the two groups. A) RM-ANOVA revealed no significant difference between the two groups in insulin secretion (P<0.0001 time, P=0.7018 group, P=0.7158 interaction). Data expressed as mean ± SEM. B) There was no difference in the calculated AUC (AUC values (mean ± SEM) were: ASD 2756 ± 275.5; control 2487 ± 414.9; P=0.5840). Both groups showed a significant increase in serum insulin following oral glucose.
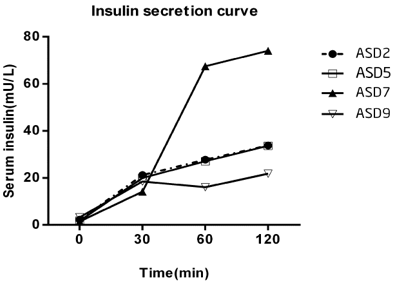
Figure 4. Insulin secretion curve of four children with ASD who had delayed insulin secretion. Peak insulin secretion emerged at time point 2 hours.
Altered peak C-peptide level in ASD children
C-peptide is not destroyed by the liver, and the halflife period is much longer than that of the insulin. It can be an assessment for insulin secretion. In order to further explore the potential mechanism of IGT, we measured C-peptide levels before (t=0), 30, 60 and 120 minutes after glucose administration. The result of RM-ANOVA analysis pointed out that the plasma C-peptide was increased in both ASD and control groups after oral glucose (Figure 5). RM ANOVA P<0.0001 time, P=0.2087 group, P=0.1154 interaction. AUC values (mean ± SEM) were: ASD 100258 ± 6457; Control 115862 ± 14197; P=0.2602). Besides, we found that the C-peptide level reached the peak at 30 minutes in both ASD and control groups, but the level in the ASD group was significantly lower than that in the control group (peak C-peptide level (mean ± SEM): ASD group, 1062.44 ± 139.97, control group: 1515.71 ± 231.66, P=0.0320). The reduced C-peptide level at 30 minutes indicated that there might be pancreatic β-cell dysfunction in children with ASD.
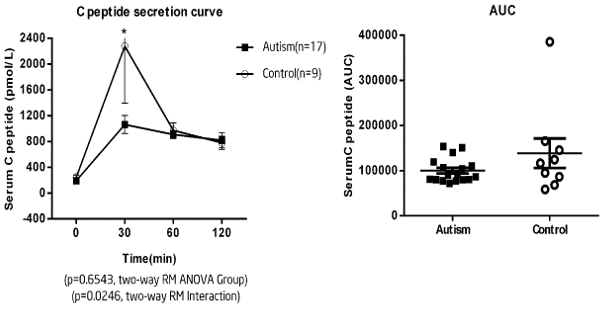
Figure 5. Comparison of C-peptide between the two groups. A) While a RM-ANOVA revealed no significant difference between the two groups of plasma C peptide secretion (P=0.2087), there was a significant difference in the interaction between time and group (RM ANOVA P<0.05). Indeed, plasma C peptide appeared to slightly increase, with a lower increase observed in the ASD group. Data expressed as mean ± SEM. B) There was no difference in the calculated AUC (AUC values (mean ± SEM) were: ASD group, 1062.44 ± 139.97, control group: 1515.71 ± 231.66, P=0.0320). Significance: *P<0.05.
Discussion
In our study, we found that fasting blood glucose concentration in the ASD group was lower than that of the control group. There were three children in the ASD group whose fasting blood glucose level was below 4 mmol/L. A previous study discovered that people with ASD had lower fasting blood glucose levels compared to a community-based population [14]. Low plasma glucose level was associated with poorer scores in attention tasks and memory [33,34]. It is well known that there is an equilibrium between plasma and brain glucose. Individuals with initially high levels of blood glucose may have higher levels of brain glucose [35]. A high level of baseline blood glucose was associated with better memory [36,37]. Participants who had a higher level of blood glucose solved the critical problems significantly faster than those with a lower blood glucose level [38]. The brain can’t get enough glucose if the fasting blood glucose is too low. Clinical observation showed that ASD patients developed symptoms of working memory deficits, which severely disturb children’s ability to learn [39]. Speculatively, lower fasting blood glucose may show altered glucose regulation in the ASD group and is related to the cerebral development. The abnormalities in regional cerebral glucose metabolism also appeared in patients with ASD [40].
We also observed that two children out of seventeen in the ASD group had IGT. We found no IGT in the control group. Besides, mean blood glucose level at 120 minutes in the ASD group was higher than that of the control group. IGT presents as a risk factor for the progress of DM and cardiovascular pathology [41]. It is a strong predictor of T2DM and the risk of T2DM significantly increased proportionally to two-hour glucose level on the OGTT [42]. The pre-diabetes found in ASD group might explain the higher incidence of T2DM in their later life. ASD had relations with lowgrade inflammation state, marked by the increase of pro-inflammatory biomarkers [43]. The inflammation state can disturb insulin function and cause IGT [25]. However, chi-squire analysis showed that the difference was statistically insignificant between ASD and control groups. Hence, big sample research is required to verify whether children with ASD show IGT.
Lower fasting blood glucose and IGT in children with ASD may be due to the alteration of pancreatic islet function. Four children in the ASD group showed a delayed insulin secretion; their peak insulin secretion emerged at time point 120 minutes. Normal glucose tolerance individuals with peak insulin secretion at 120 minutes had defective early beta-cell function and a higher risk of developing diabetes [44]. We also demonstrated that the C-peptide level at 30 minutes in the ASD group was significantly lower than that of the control group (P=0.0320). The decreased C-peptide response in the ASD group might be a direct indicator of defective insulin secretion. Worsening glucose tolerance was associated with lower C-peptide [45]. Besides, there was a slight, although non-significant trend for decreased insulin level at 30 minutes in the ASD group. C-peptide has anti-inflammatory effects as well as an aid to repair smooth muscle cells [46,47]. While the relationship between DM and ASD is unclear, several factors probably contribute including: 1) similar common gene polymorphism, such as glyoxalase I (GLO1) C419A polymorphism [48], 2) related risk factors, such as dyslipidemia and obesity [49,50] and 3) altered microbial metabolites [51].
There are several additional unanswered questions that suggest future research. As the kinetics of immunoreactive insulin (IRI) and C-peptide differs considerably in human body, it is attracting to compare these two parameters under many pathophysiological conditions. Nevertheless, the temporal profile of C-peptide is always sluggish compared with that of insulin. We could not explain the discrepancy between the reduced C-peptide level and unchanged insulin level in children with ASD. Hence, more research is needed to study the pancreatic β-cell function of children with ASD.
Conclusion
We present the first trial of OGTT, insulin and C peptide release tests in children with ASD and control group. The results indicated that fasting blood glucose and C peptide level at 30 minutes significantly reduced in children with ASD. Two children in the ASD group had IGT according to 2-hour postprandial blood glucose level and four children in the ASD group emerged a phenomenon of delayed insulin secretion. All these results indicated that the pre-diabetic state may be a biological subtype of children with ASD. However, the causal relationship between ASD and DM is confusing. To further unravel the relationship between DM and ASD, research with larger sample is needed.
Conflicts of Interest
The authors declare that they have no competing interests.
Funding Statement
This research was supported by Peking University Health Science Center 88443Y0306.
Acknowledgments
We are very grateful to the children, families and school staff, who kindly took part in this research.
References
2. Sun X, Allison C, Matthews FE, Sharp SJ, Auyeung B, Baron-Cohen S, Brayne C. Prevalence of autism in mainland China, Hong Kong and Taiwan: a systematic review and meta-analysis. Molecular autism. 2013 Dec 1;4(1):7.
3. Jeste SS, Geschwind DH. Disentangling the heterogeneity of autism spectrum disorder through genetic findings. Nature Reviews Neurology. 2014 Feb;10(2):74.
4. Bauman ML. Medical comorbidities in autism: challenges to diagnosis and treatment. Neurotherapeutics. 2010 Jul 1;7(3):320-7.
5. Diémé B, Mavel S, Blasco H, Tripi G, Bonnet-Brilhault F, Malvy J, Bocca C, Andres CR, Nadal-Desbarats L, Emond P. Metabolomics study of urine in autism spectrum disorders using a multiplatform analytical methodology. Journal of proteome research. 2015 Nov 23;14(12):5273-82.
6. Kang DW, Park JG, Ilhan ZE, Wallstrom G, LaBaer J, Adams JB, Krajmalnik-Brown R. Reduced incidence of Prevotella and other fermenters in intestinal microflora of autistic children. PloS one. 2013 Jul 3;8(7):e68322.
7. Rosenfeld CS. Microbiome disturbances and autism spectrum disorders. Drug Metabolism and Disposition. 2015 Oct 1;43(10):1557-71.
8. Tomova A, Husarova V, Lakatosova S, Bakos J, Vlkova B, Babinska K, Ostatnikova D. Gastrointestinal microbiota in children with autism in Slovakia. Physiology & behavior. 2015 Jan 1;138:179-87.
9. Theoharides TC, Stewart JM, Panagiotidou S, Melamed I. Mast cells, brain inflammation and autism. European journal of pharmacology. 2016 May 5;778:96-102.
10. Theoharides TC, Tsilioni I, Patel AB, Doyle R. Atopic diseases and inflammation of the brain in the pathogenesis of autism spectrum disorders. Translational psychiatry. 2016 Jun;6(6):e844.
11. Ashwood P, Krakowiak P, Hertz-Picciotto I, Hansen R, Pessah I, Van de Water J. Elevated plasma cytokines in autism spectrum disorders provide evidence of immune dysfunction and are associated with impaired behavioral outcome. Brain, behavior, and immunity. 2011 Jan 1;25(1):40-5.
12. Nardone S, Elliott E. The interaction between the immune system and epigenetics in the etiology of autism spectrum disorders. Frontiers in neuroscience. 2016 Jul 12;10:329.
13. Cheng N, Rho JM, Masino SA. Metabolic dysfunction underlying autism spectrum disorder and potential treatment approaches. Frontiers in molecular neuroscience. 2017 Feb 21;10:34.
14. Moses L, Katz N, Weizman A. Metabolic profiles in adults with autism spectrum disorder and intellectual disabilities. European Psychiatry. 2014 Sep 1;29(7):397- 401.
15. Aguilar MC, Baena LG, Rodríguez RB, Latorre JG, Mur NV, Sánchez AL. Maternal diabetes mellitus and its impact on child neurodevelopment; systematic review. Nutricion hospitalaria. 2015 Dec;32(6):2484-95.
16. Dahlquist G, Källén B. School marks for Swedish children whose mothers had diabetes during pregnancy: a population-based study. Diabetologia. 2007 Sep 1;50(9):1826-31.
17. Ornoy A, Wolf A, Ratzon N, Greenbaum C, Dulitzky M. Neurodevelopmental outcome at early school age of children born to mothers with gestational diabetes. Archives of Disease in Childhood-Fetal and Neonatal Edition. 1999 Jul 1;81(1):F10-4.
18. Macpherson H, Formica M, Harris E, Daly RM. Brain functional alterations in Type 2 Diabetes–A systematic review of fMRI studies. Frontiers in neuroendocrinology. 2017 Oct 1;47:34-46.
19. Sommerfield AJ, Deary IJ, Frier BM. Acute hyperglycemia alters mood state and impairs cognitive performance in people with type 2 diabetes. Diabetes care. 2004 Oct 1;27(10):2335-40.
20. Atladóttir HÓ, Pedersen MG, Thorsen P, Mortensen PB, Deleuran B, Eaton WW, Parner ET. Association of family history of autoimmune diseases and autism spectrum disorders. Pediatrics. 2009 Aug 1;124(2):687-94.
21. Xiang AH, Wang X, Martinez MP, Walthall JC, Curry ES, Page K, Buchanan TA, Coleman KJ, Getahun D. Association of maternal diabetes with autism in offspring. Jama. 2015 Apr 14;313(14):1425-34.
22. Chen MH, Lan WH, Hsu JW, Huang KL, Su TP, Li CT, Lin WC, Tsai CF, Tsai SJ, Lee YC, Chen YS. Risk of developing type 2 diabetes in adolescents and young adults with autism spectrum disorder: a nationwide longitudinal study. Diabetes care. 2016 May 1;39(5):788-93.
23. Krakowiak P, Walker CK, Bremer AA, Baker AS, Ozonoff S, Hansen RL, Hertz-Picciotto I. Maternal metabolic conditions and risk for autism and other neurodevelopmental disorders. Pediatrics. 2012 May 1;129(5):e1121-8.
24. Broder-Fingert S, Brazauskas K, Lindgren K, Iannuzzi D, Van Cleave J. Prevalence of overweight and obesity in a large clinical sample of children with autism. Academic pediatrics. 2014 Jul 1;14(4):408-14.
25. Van Greevenbroek MM, Schalkwijk CG, Stehouwer CD. Obesity-associated low-grade inflammation in type 2 diabetes mellitus: causes and consequences. Neth J Med. 2013 May 1;71(4):174-87.
26. Pulgaron ER, Delamater AM. Obesity and type 2 diabetes in children: epidemiology and treatment. Current diabetes reports. 2014 Aug 1;14(8):508.
27. SHAPIRO ET, TILLIL H, RUBENSTEIN AH, POLONSKY KS. Peripheral insulin parallels changes in insulin secretion more closely than C-peptide after bolus intravenous glucose administration. The Journal of Clinical Endocrinology & Metabolism. 1988 Nov 1;67(5):1094-9.
28. Bansal N. Prediabetes diagnosis and treatment: A review. World journal of diabetes. 2015 Mar 15;6(2):296.
29. Eldin WS, Emara M, Shoker A. Prediabetes: a must to recognise disease state. International journal of clinical practice. 2008 Apr;62(4):642-8.
30. Zyga O, Russ S, Ievers-Landis CE, Dimitropoulos A. Assessment of pretend play in Prader–Willi syndrome: A direct comparison to autism spectrum disorder. Journal of autism and developmental disorders. 2015 Apr 1;45(4):975-87.
31. Matthews DR, Hosker JP, Rudenski AS, Naylor BA, Treacher DF, Turner RC. Homeostasis model assessment: insulin resistance and ?-cell function from fasting plasma glucose and insulin concentrations in man. Diabetologia. 1985 Jul 1;28(7):412-9.
32. American Diabetes Association. Diagnosis and classification of diabetes mellitus. Diabetes care. 2013 Jan 1;36(Supplement 1):S67-74.
33. Benton D, Owens DS, Parker PY. Blood glucose influences memory and attention in young adults. Neuropsychologia. 1994 May 1;32(5):595-607.
34. Benton D, Parker PY. Breakfast, blood glucose, and cognition. The American journal of clinical nutrition. 1998 Apr 1;67(4):772S-8S.
35. Lund-Andersen HE. Transport of glucose from blood to brain. Physiological reviews. 1979 Apr;59(2):305-52.
36. Benton D, Owens DS. Blood glucose and human memory. Psychopharmacology. 1993 Nov 1;113(1):83-8.
37. Parker PY, Benton D. Blood glucose levels selectively influence memory for word lists dichotically presented to the right ear. Neuropsychologia. 1995 Jul 1;33(7):843-54.
38. Donohoe RT, Benton D. Cognitive functioning is susceptible to the level of blood glucose. Psychopharmacology. 1999 Aug 1;145(4):378-85.
39. Fanning PA, Hocking DR, Dissanayake C, Vivanti G. Delineation of a spatial working memory profile using a non-verbal eye-tracking paradigm in young children with autism and Williams syndrome. Child Neuropsychology. 2018 May 19;24(4):469-89.
40. Kumar BA, Malhotra S, Bhattacharya A, Grover S, Batra YK. Regional cerebral glucose metabolism and its association with phenotype and cognitive functioning in patients with autism. Indian journal of psychological medicine. 2017 May;39(3):262.
41. Barr EL, Zimmet PZ, Welborn TA, Jolley D, Magliano DJ, Dunstan DW, et al. Risk of cardiovascular and allcause mortality in individuals with diabetes mellitus, impaired fasting glucose, and impaired glucose tolerance: the Australian Diabetes, Obesity, and Lifestyle Study (AusDiab). Circulation. 2007; 116(2), 151-157.
42. Park SK, Ryoo JH, Oh CM, Choi JM, Choi YJ, Lee KO, Jung JY. The risk of type 2 diabetes mellitus according to 2-hour plasma glucose level: the Korean genome and epidemiology study (KoGES). Diabetes research and clinical practice. 2017 Aug 9.
43. Prata J, Santos SG, Almeida MI, Coelho R, Barbosa MA. Bridging Autism Spectrum Disorders and Schizophrenia through inflammation and biomarkers-pre-clinical and clinical investigations. Journal of neuroinflammation. 2017 Dec;14(1):179.
44. Sun Y, Han J, Lin Z, Song L, Wang C, Jia W. Delayed insulin secretion response during an OGTT is associated with an increased risk for incidence of diabetes in NGT subjects. Journal of Diabetes and its Complications. 2016 Nov 1;30(8):1537-43.
45. Greenbaum CJ, Buckingham B, Chase HP, Krischer J, Diabetes Prevention Trial, Type 1 Diabetes (DPT - 1) Study Group. Metabolic tests to determine risk for type 1 diabetes in clinical trials. Diabetes/metabolism research and reviews. 2011 Sep;27(6):584-9.
46. Luppi P, Cifarelli V, Tse H, Piganelli J, Trucco M. Human C-peptide antagonises high glucose-induced endothelial dysfunction through the nuclear factor-?B pathway. Diabetologia. 2008 Aug 1;51(8):1534.
47. Mughal RS, Scragg JL, Lister P, Warburton P, Riches K, O’Regan DJ, Ball SG, Turner NA, Porter KE. Cellular mechanisms by which proinsulin C-peptide prevents insulin-induced neointima formation in human saphenous vein. Diabetologia. 2010 Aug 1;53(8):1761-71.
48. Kova? J, Podkrajšek KT, Lukši? MM, Battelino T. Weak association of glyoxalase 1 (GLO1) variants with autism spectrum disorder. European child & adolescent psychiatry. 2015 Jan 1;24(1):75-82.
49. Egan AM, Dreyer ML, Odar CC, Beckwith M, Garrison CB. Obesity in young children with autism spectrum disorders: prevalence and associated factors. Childhood Obesity. 2013 Apr 1;9(2):125-31.
50. Zuckerman KE, Hill AP, Guion K, Voltolina L, Fombonne E. Overweight and obesity: prevalence and correlates in a large clinical sample of children with autism spectrum disorder. Journal of autism and developmental disorders. 2014 Jul 1;44(7):1708-19.
51. Morris G, Berk M, Carvalho A, Caso JR, Sanz Y, Walder K, Maes M. The role of the microbial metabolites including tryptophan catabolites and short chain fatty acids in the pathophysiology of immune-inflammatory and neuroimmune disease. Molecular neurobiology. 2017 Aug 1;54(6):4432-51.