Abstract
Introduction: Poor glycemic regulation in type 2 diabetes mellitus (T2DM) significantly increases the risk of complications. Therefore, we determined the prevalence of poorly controlled T2DM at a large inner-city out-patient clinic in Denmark and identified risk markers for poorly controlled T2DM.
Methods: Data were collected retrospectively on all diabetes patients attending at the out-patient clinic in 2016. Patients attending at the clinic > 2 yrs were categorized by HbA1c as tightly controlled (≤ 50 mmol/mol/ 6.7 %; n=46) or poorly controlled (≥ 75 mmol/ mol/ 9.0 %; n=108) and compared across 55 variables.
Results: 313 out of 1202 (26 %) were poorly controlled T2DM patients. Poorly controlled patients had longer duration of diabetes (10.0 vs. 8.5 yrs), higher LDL values (2.34 vs. 1.86 mmol/L), higher triglyceride levels (2.15 vs. 1.63 mmol/L), received more diabetes drugs (3 vs. 2), had more insulin prescribed (85% vs. 52 %), more retinopathy (51% vs. 20%), more comorbidities (2 vs. 1), higher Charlson comorbidity index (4 vs. 3), more yearly consultations (4 vs. 3), and more often another anticipated place of origin than Denmark (57 % vs. 24 %) compared to tightly controlled patients.
Conclusion: Risk markers for poorly controlled T2DM were a more pronounced metabolic syndrome and anticipated place of origin, and not clinical inertia, patient attendance at the outpatient clinic nor compliance to medication.
Keywords
Type 2 diabetes, Glycemic control, Uncontrolled, Diabetes mellitus, HbA1c, Risk factor, Prevalence
Introduction
Type 2 diabetes mellitus (T2DM) is a metabolic disease defined by hyperglycemia. If not treated, chronic and even short periods (i.e. weeks) of undesirable hyperglycemia increases the risk for developing diabetic microvascular complications such as retinopathy, neuropathy, nephropathy, foot ulcers and amputations, and macrovascular complications such as cardiovascular disease including stroke [1,2]. Achieving a nearnormal glycemic level reduces the risk of microvascular complications [3].
Current guidelines recommend individualized targets of hemoglobin A1c (HbA1c): <48 mmol/mol (6.5%) for younger patients with an early un-complicated T2DM, <53 mmol/mol (7.0%) when the tight control is difficult to achieve, <58 mmol/mol (7.5%) for patients with longer diabetes duration and established complications or a higher risk of hypoglycemia. Lastly, between 58 and 75 mmol/mol (7.5 – 9.0%) for patients who aim to be symptom-free only [4].
In Denmark, T2DM patients are treated at their general practitioner but are referred to specialized out-patient clinics if HbA1c targets cannot be achieved or if the patient has severe complications [4]. Even though patients are attending a clinic consulting highly educated personnel and experts in T2DM, some patients still do not reach their recommended HbA1c target.
Identification of predictors for not achieving the glycemic targets is essential to effectively target clinical efforts to improve glycemic control. Therefore, the aim of the study was to determine the prevalence of poorly controlled T2DM patients and to identify risk markers for poorly controlled T2DM at a University Hospital out-patient clinic.
Materials and Methods
Participants
Patients were included from the diabetic outpatient-clinic of Bispebjerg University Hospital in Denmark in 2016. Prevalence of poorly controlled T2DM was determined by the latest HbA1c level in 2016 being ≥ 75 mmol/mol (9.0%).
A cross-sectional comparison between tightly and poorly controlled T2DM was performed to identify risk markers. Definitions were based on current guidelines for being poorly controlled: HbA1c levels ≥ 75 mmol/mol (9.0%) since no target was considered healthy above 75 mmol/ mol, and tightly controlled: HbA1c levels ≤ 50 mmol/ mol (6.7 %) chosen as the middle value of 48 mmol/ mol and 53 mmol/mol. Criteria were that more than one HbA1c measurement in a 12-month period including the last measurement should be within the tightly or poorly controlled cut-off definition. The patients should have a diabetes duration of more than two years and should have attended the endocrinology outpatient-clinic of Bispebjerg University Hospital for more than 2 years. These criteria ensured that the study was based on the treatment given at the clinic. The study was approved by the Danish Data Protection Agency (2018-41-5329).
Data collection
55 variables expected to play a role in controlling diabetes regarding glycemic control were investigated. Variables such as age, sex, disease duration, body mass index (BMI), blood pressure, lipids (low density lipoprotein (LDL), high density lipoprotein (HDL) and triglycerides), eye status, amputation status, biothesiometry, estimated glomerular filtration rate (eGFR), exercise, alcohol consumption, smoking habits and anticipated place of origin were extracted from the Diabetes Rask, a local patient registry. Alanine-aminotransferase (ALAT) and the albumin/ creatinine ratio were extracted from a laboratory database. Dietician appointments and marital status was obtained from the former patient record database. For information on drug prescriptions and the redemption of the prescriptions a public database was used. Data on the number of consultations in the clinic, the patient’s stability in showing up for these consultations and diagnoses related to the Charlson Comorbidity Index [5], mental illness and diabetes complications were collected from a patient administrative system.
Data analysis
Descriptive statistics were performed for all 55 variables. To estimate the actual differences between the two groups, Fisher’s test was performed for categorical data and either a t-test or a Mann Whitney U test for numerical data depending on normality distribution. Statistical analyses were conducted in Excel 2016 and R studio 3.4.3.
Results
During the study period (Jan - Dec 2016), 1883 patients with diabetes attended the outpatient clinic at Bispebjerg University Hospital. Out of these, 1278 patients were diagnosed with T2DM, 76 of these patients had no record of HbA1c levels in 2016, which resulted in a study population of 1202 patients. 313 of the 1202 T2DM patients were poorly controlled resulting in a prevalence of 26 %. According to inclusion and exclusion criteria, the population of 1202 T2DM patients was separated into tightly controlled (n=46) and poorly controlled (n=108) (Figure 1).
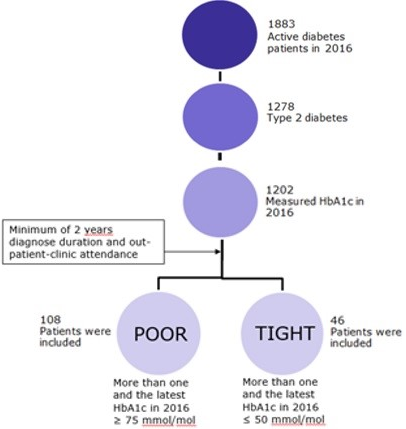
Figure 1. Patient flow. Inclusion and exclusion of patients for characterization of poorly and tightly controlled type 2 diabetes.
Sociodemographic data and comorbidities
The poorly controlled patients were characterized by longer diabetes duration (8.5 vs. 10.0 years), a higher number of comorbidities (1 vs. 2) and Charlson Comorbidity Index (3 vs. 4) compared to the tightly controlled patients. In addition, a higher percentage of poorly controlled patients were diagnosed with a cardiovascular (24 vs. 41 %), pulmonary (7 vs. 19 %) and/ or psychiatric disease (2 vs. 12 %). A higher number of yearly consultations were booked for the poorly controlled patients (3 vs. 4), yet both poorly and tightly controlled patients had an equally high meeting stability (98 % vs. 96 %) at the clinic and redeemed most of their prescriptions (87 vs. 87%). The weekly consumption of alcohol was significantly lower in the poorly controlled patients (3.0 vs. 0.9 units/week) but within the recommendations for both groups. No large differences were found within other selfcare parameters such as smoking, exercise, and dietitian appointments. Poorly controlled patients were more frequently anticipated to have a different place of origin than Denmark (24% vs. 57%) (Table 1).
| Variable | Tight n=46 | Poor n=108 |
| Age (years) | 60.6 (± 12.2) | 62.7 (± 12.1) |
| Duration of diabetes (years) | 8.5 (3.0 - 11.0) | 10.0 (7.0 - 15.3)* |
| Sex | ||
| Male | 65% | 57% |
| Female | 35% | 43% |
| Marital status | ||
| Married | 35% | 45% |
| Not married | 65% | 55% |
| Never smoked (Yes) | 48% | 48% |
| Alcohol consumption (units/week) | 3.0 (± 6.21) | 0.9 (± 3.36)** |
| Dietitian appointment (Yes) | 65% | 59% |
| Exercise (Yes) | 65% | 50% |
| Redemption of prescriptions1 | 87% | 87% |
| Consultation frequency in 2016 | 3 (2.0- 4.0) | 4 (3.0- 6.0)*** |
| Meeting stability2 | 98% | 96% |
| Anticipated place of origin3 | ||
| Denmark | 70% | 38%*** |
| Other | 24% | 57% |
| Unsure | 6% | 5% |
| Number of comorbidities4 | 1 (0.0- 2.0) | 2 (0.0- 4.0)** |
| Charlson Comorbidity Index [5] | 3 (2.0- 4.8) | 4 (3.0- 7.0)* |
| Psychiatric diagnosis (Yes) | 2% | 12% |
| Cardiovascular diagnosis (Yes) | 24% | 41% |
| Hypertension and/or Hyperlipidemia (Yes) | 41% | 57% |
| Chronic pulmonary diagnosis (Yes) | 7% | 19% |
|
The data are presented as mean (± standard deviation) or median (inter-quartile range) or for categorical data in percent. 1Calculated by dividing collected prescriptions by all medicine prescribed |
||
Biomedical variables and diabetes complications
Both tightly and poorly controlled patients were overweight with a BMI of 31.7 ± 5.9 and 30.7 ± 5.5, respectively. The poorly controlled patients had a worse lipid profile than the tightly controlled patients (triglycerides (1.63 vs. 2.15 mmol/L); LDL (2.01 vs. 4.34 mmol/L)), though on average the lipid profile and blood pressure levels of both groups were close to target references. Albumin/creatinine levels in spot urine were tending to be higher in poorly controlled patients (19 vs. 42 mg/g) and eGFR values were below reference values for both groups (73.5 vs. 81.5 ml/min per 1.73 m2). In the poorly controlled patients, the prevalence of retinopathy was significantly higher (20% vs. 51%) and almost 2% had amputations (Table 2).
| Variable | Reference values | Tight n=46 | Poor n=108 |
| ALAT (U/L) | ≤ 70 [19] | 24.0 (18.0-33.0) | 24.0 (19.0-34.5) |
| Systole (mmHg) | ≤ 130 [4] | 130.2 (± 17.9) | 133.0 (±17.9) |
| Diastole (mmHg) | ≤ 80 [4] | 76.5 (± 9.9) | 77.3 (± 10.8) |
| HDL (mmol/L) | ≥ 1.0 [19] | 1.09 (0.90-1.35) | 1.05 (0.88-1.33) |
| LDL (mmol/L) | ≤ 2.5 [4] | 1.86 (± 0.66) | 2.34 (± 1.00)** |
| Triglycerides (mmol/L) | ≤ 2.0 [19] | 1.63 (1.27-2.34) | 2.15 (1.52-3.20)** |
| BMI | ≤ 25 [19] | 31.7 (± 5.9) | 30.7 (± 5.5) |
| Biothesiometry (mV) | ≤ 25 [20] | 20.0 (12.0-29.5) | 21.0 (15.8-33.0) |
| Albumin/creatinine in spot urine (mg/g) | ≤ 30 [19] | 19 (7.0-69.3) | 42 (13.0-111.0) |
| Retinopathy (Yes) | 20% | 51%*** | |
| eGFR (ml/min per 1.73m2) | ≥ 90 [19] | 73.5 (58.8- 86.1) | 81.5 (54.4- 90.0) |
| Amputation (Yes) | 0% | 2% | |
| The data are presented as mean (± standard deviation) or median (inter-quartile range) or for categorical data in percent. * 0.01 |
|||
Drugs for diabetes and other conditions
Both poorly and tightly controlled patients had a high total number of drugs prescribed. On average, poorly controlled patients were prescribed 1 extra diabetes drug and a higher percentage received insulin treatment (52% vs. 85%). No large differences were found between the other drugs prescribed (Table 3).
| Variable | Tight n=46 | Poor n=108 |
| Number of drugs | 7 (5.0-12.0) | 10 (6.0-13.0) |
| Number of diabetes drugs | 2 (1.0-3.0) | 3 (2.0-4.0)** |
| Insulin | 52% | 85% *** |
| Insulin IE/day | 44 (25.5-65.0) | 55 (28.0-80.0) |
| Metformin | 74% | 64% |
| Sulfonylurea | 7% | 12% |
| Combination of blood glucose lowering drugs | 2% | 4% |
| DPP-4 antagonists | 11% | 18% |
| SLGT-2 inhibitors | 26% | 30% |
| GLP-1 | 24% | 21% |
| Acetylsalicylic acid | 30% | 37% |
| Anticoagulants excl. ASA | 22% | 18% |
| Antihypertensives excl. diuretics | 80% | 78% |
| Diuretics | 26% | 36% |
| Heart therapy drugs | 11% | 19% |
| Lipid modifying drugs | 70% | 72% |
| Corticosteroids for systemic use | 2% | 3% |
| Antiepileptics | 4% | 10% |
| Antipsychotics | 2% | 7% |
| Anxiolytics | 0% | 3% |
| Hypnotics and sedatives | 9% | 14% |
| Antidepressants | 20% | 22% |
| Psychostimulants | 0% | 0% |
| Drugs for obstructive pulmonary diseases | 7% | 11% |
| The data are presented as mean (± standard deviation) or median (inter-quartile range) or for categorical data in percent of use of the drug. * 0.01 |
||
Discussion
In the present study, the prevalence of poorly controlled T2DM was 26%. Results from previous studies have shown the prevalence of poorly controlled T2DM to range between 12% to 74% with cut-offs ranging from 47.5 mmol/ mol (6.5%) to 63.9 mmol/mol (8%) [6-10].
Patients with poorly and tightly controlled T2DM were compared across several variables to identify risk markers for poorly controlled T2DM. We found that poorly controlled T2DM was related to a longer diabetes duration, a worse lipid profile and an anticipated origin different from Denmark. Patients with poorly controlled T2DM had an average 1.5 years longer diagnose duration, which is in agreement with previous studies [8,9,11,12] and might be explained by the increased insulin resistance found with age and diagnose duration [11]. The poorly controlled diabetes patients had significantly higher LDL and triglyceride values, but the recommended values were almost achieved for both groups concerning both parameters. Higher levels of plasma lipids have been reported in other studies [6,8,13]. The slight elevation of lipids may also be part of the metabolic syndrome caused by insulin resistance which increases with age and duration of T2DM [11]. Thus, a more pronounced metabolic syndrome in the poorly controlled T2DM patients may explain the difficulties in achieving target values [14]. A tendency was detected between high LDL-levels and not taking lipidcontrolling drugs (mostly statins) (p=0.054) suggesting clinical inertia for dyslipidemia. The poorly controlled T2DM patients’ anticipated place of origin, were more likely to be other than Denmark than the tightly controlled group. This suggests that treatment regimens should be tailored to individual patients taking all variables into account since variations in basic disease mechanisms may vary with ethnicity [11,13,15].
Interestingly, we found that patients with poorly controlled T2DM had similar selfcare behavior (smoking and exercise habits and alcohol consumption) and compliance rate (meeting stability and prescription redemption) as tightly controlled patients. The patients with poorly controlled T2DM were attending more consultations at the clinic and were prescribed more drugs for their T2DM and a higher percentage received insulin treatment suggesting that, despite intensive care, some patients still do not meet their target glycemic level.
The poorly controlled patients were prescribed significantly more glucose lowering drugs (2 vs. 3), suggesting that the poor control is not caused by physicians’ hesitation in pharmacological treatment. Both groups were given a dosage corresponding to 86% of the maximal dosage for all the glucose lowering drugs, when corrected for e-GFR. A significantly higher number of diabetes drugs prescribed combined with the fact that the poorly controlled diabetes patients received a significantly higher number of consultations than the tightly controlled group (3 vs. 4) indicates a group of treatment-resistant diabetics, meaning patients not responding to the recommended treatment, which is also seen in other studies [6].
Additionally, the poorly controlled patients were significantly more likely to receive insulin treatment (52% vs. 85%), and this is in line with findings in other studies [6,9,13,15-17]. Even in cases with steatosis or an extremely high insulin-resistance, insulin will act anti-hyperglycemic at high doses [18]. Hesitation to increase insulin doses may be due to a combination of increased risk for hypoglycemia, the cost, and the risk for weight gain.
The fact that patients in both groups redeemed 87% of all their prescriptions at the pharmacy suggest a drugcompliance, given that the patients take the medicine they collect at the pharmacy. The patients’ exact compliance degree is difficult to determine. In some cases, the patients’ anxiety for needles or hypoglycemia can play a role [6,15-17].
Additionally, poorly controlled patients had more comorbidities and a higher Charlson Comorbidity Index explained by a higher percentage being diagnosed with cardiovascular, pulmonary, and/or psychiatric disease, together with a more frequent diagnosis of retinopathy. These diagnoses might be a consequence of or a reason for a poorer glycemic control. No statistically significant difference between the groups concerning admissions to the hospital could be demonstrated, but patients with more comorbidities were followed in multiple clinics at the hospital. In support of previous studies and current guidelines on HbA1c targets, our data support that chronic glycemic levels above the recommended lead to a higher risk of microvascular complications [2,3], emphasizing the importance of glycemic control.
Other studies have shown differences in age, gender, marital status, BMI, blood pressure, smoking habits, diet, and exercise between tightly and poorly controlled patients [6-9,12,13,16]. This was not confirmed in the present study.
This study may serve as quality assurance at the out-patient clinic. However, the study holds some limitations. Many variables were self-reported by the patients, redemption of prescription was used to investigating drug compliance, and place of origin was estimated by surnames. Disparities may still be present for other characteristics not assessed in this study, including income, education, and other social and economic factors. Further cross-validation needs to take these precautions into account.
Conclusion
The prevalence of poorly controlled T2DM was 26% at this out-patient clinic in Denmark. Risk factors for poorly controlled T2DM were neither clinical inertia, patient attendance at the outpatient clinic nor the estimated compliance to medication. Eligible variables for poorly controlled T2DM were anticipated place of origin and a more pronounced metabolic syndrome caused by insulin resistance.
References
2. American Diabetes Association. Standards of medical care in diabetes--2012. Diabetes Care. 2012 Jan;35:S11.
3. UK Prospective Diabetes Study (UKPDS) Group. Intensive blood-glucose control with sulphonylureas or insulin compared with conventional treatment and risk of complications in patients with type 2 diabetes (UKPDS 33). The Lancet. 1998 Sep 12;352(9131):837-53.
4. Selskab DE. NBV: Behandling og kontrol af Type 2 Diabetes. Guideline Denmark: Dansk Endokrinologisk selskab; 2014oktober 2014. Report No.: ReportNumberContract No.: DocumentNumber.
5. Charlson ME, Pompei P, Ales KL, MacKenzie CR. A new method of classifying prognostic comorbidity in longitudinal studies: development and validation. Journal of Chronic Diseases. 1987 Jan 1;40(5):373-83.
6. Crowley MJ, Holleman R, Klamerus ML, Bosworth HB, Edelman D, Heisler M. Factors associated with persistent poorly controlled diabetes mellitus: clues to improving management in patients with resistant poor control. Chronic Illness. 2014 Dec;10(4):291-302.
7. Siddiqui FJ, Avan BI, Mahmud S, Nanan DJ, Jabbar A, Assam PN. Uncontrolled diabetes mellitus: Prevalence and risk factors among people with type 2 diabetes mellitus in an Urban District of Karachi, Pakistan. Diabetes Research and Clinical Practice. 2015 Jan 1;107(1):148-56.
8. Mahmood MI, Daud F, Ismail A. Glycaemic control and associated factors among patients with diabetes at public health clinics in Johor, Malaysia. Public Health. 2016 Jun 1;135:56-65.
9. Badedi M, Solan Y, Darraj H, Sabai A, Mahfouz M, Alamodi S, Alsabaani A. Factors associated with longterm control of type 2 diabetes mellitus. Journal of Diabetes Research. 2016;2016:2109542.
10. Musenge EM, Michelo C, Mudenda B, Manankov A. Glycaemic control and associated self-management behaviours in diabetic outpatients: a hospital based observation study in Lusaka, Zambia. Journal of Diabetes Research. 2016;2016:9.
11. Khan H, Lasker SS, Chowdhury TA. Exploring reasons for very poor glycaemic control in patients with Type 2 diabetes. Primary Care Diabetes. 2011 Dec 1;5(4):251-5.
12. Cook CB, Lyles RH, El-Kebbi I, Ziemer DC, Gallina DL, Dunbar VG, et al. The potentially poor response to outpatient diabetes care in urban African-Americans. Diabetes Care. 2001 Feb 1;24(2):209-15.
13. Teoh H, Braga MF, Casanova A, Drouin D, Goodman SG, Harris SB, et al. Patient age, ethnicity, medical history, and risk factor profile, but not drug insurance coverage, predict successful attainment of glycemic targets: Time 2 Do More Quality Enhancement Research Initiative (T2DM QUERI). Diabetes Care. 2010 Dec 1;33(12):2558- 60.
14. Samson SL, Garber AJ. A closer look at the criteria for the diagnosis of Metabolic Syndrome [table]. Metabolic syndrome. Endocrinol Metab Clin North Am. 2014;43:1- 23.
15. Drake TC, Hsu FC, Hire D, Chen SH, Cohen RM, McDuffie R, et al. Factors associated with failure to achieve a glycated haemoglobin target of< 8.0% in the A ction to C ontrol C ardiovascular R isk in D iabetes (ACCORD) trial. Diabetes, Obesity and Metabolism. 2016 Jan;18(1):92-5.
16. Ashur ST, Shah SA, Bosseri S, Fah TS, Shamsuddin K. Glycaemic control status among type 2 diabetic patients and the role of their diabetes coping behaviours: a clinic-based study in Tripoli, Libya. Libyan Journal of Medicine. 2016 Jan 1;11(1):31086.
17. Tong WT, Vethakkan SR, Ng CJ. Why do some people with type 2 diabetes who are using insulin have poor glycaemic control? A qualitative study. BMJ Open. 2015 Jan 1;5(1):e006407.
18. Kampmann U, Hoeyem P, Mengel A, Schmitz O, Rungby J, Orskov L, et al. Insulin dose–response studies in severely insulin-resistant type 2 diabetes—evidence for effectiveness of very high insulin doses. Diabetes, Obesity and Metabolism. 2011 Jun;13(6):511-6.
19. Danske Regioner S-oÆ, KL. Sundhed.dk [Web page]. Copenhagen: Sundhed.dk; 2018[updated LastUpdateDate; cited 2018CitedDateCited].Available from: https://www.sundhed.dk/
20. Fodterapeuter Las. Vejledning til årlig fodstatus for diabetikere. Guideline. Denmark: Landsforeningen af statsautoriserede Fodterapeuter; 2011.Report No.: ReportNumberContract No.: DocumentNumber.