Abstract
Background: Whether any of the anthropometric indices are associated with cardiometabolic outcomes in indigenous Fulani African populations is not known. This study assesses anthropometric indices in predicting cardiometabolic outcomes in indigenous and non-indigenous populations.
Methods: A population-based cross-sectional study recruited 1921 participants from the settled Fulani, nomadic pastoral Fulani and the general population. Body weight (BW), height, waist circumference (WC), and hip circumference (HC) were measured and body mass index (BMI), waist-to-hip ratio (WHR), waist-to-height ratio (WHtR), Conicity Index (Cindex), body adiposity index (BAI), body roundness index (BRI) and body shape index (ABSI) were determined. The associations of anthropometric indices with cardiometabolic disorders were assessed by multivariable adjusted logistic regression and the area under the receiver-operating characteristic curve compared the predictive abilities.
Results: In women, BW and BMI showed good performance in identifying dysglycaemia in Fulbe and general population. In men, WC, HC and BRI, and WC and BRI had good performance in all groups to predict hypertension and dysglycaemia/hypertension respectively. All the anthropometric indices showed good performance to identify MetS.
Conclusion: With transition from nomadic to settled life indigenous Fulani are at greater risk for MetS. Adiposity indices for identification of cardiometabolic disorders vary by ethnicity and sex. WC, WHtR and BRI are better anthropometric indices to identify MetS in indigenous Fulani population.
Keywords
Indigenous Fulani Populations, Anthropometric Indices, Cardiometabolic Disorders
Introduction
Obesity and underweight might be symptomatic of an underlying health condition and malnutrition [1]. Globally the prevalence of obesity (BMI≥30 kg/m2) increased from 3.2% to 10.8% in adult men and from 6.4% to 14.9% in adult women and underweight (BMI<18.5 kg/m2) reduced from 13.8% to 8.8% [2]. This data does not include indigenous populations from Africa that have been shown to have high prevalence of underweight and low prevalence of obesity [3,4]. Typically, weight and body mass index (BMI) have been used in clinical settings, though classifying risk based on body weight (BW) and BMI is insufficient due to large variability. Cardiometabolic risk prediction is useful in the identification of sub-phenotypes of metabolically unhealthy normal weight from metabolically healthy obesity using abdominal obesity indices. Increasing evidence have provided independent and additional information for inclusion of waist circumference (WC) in routine clinical practice [5]. The BMI, waist circumference (WC), and waist-to-hip ratio (WHR) has been shown not to improve cardiovascular risk prediction even with the inclusion of systolic blood pressure, history of diabetes and lipid levels in studies in developed countries [6]. Anthropometric indices such as the hip circumference (HC), waist-to-height ratio (WHtR), conicity index (Cindex) and body adiposity index (BAI) are preferred for their simplicity and as such convenient to determine the cardiometabolic risk related to body adiposity. The BAI calculates the percentage of the body fat for adults of different ethnicities without using the BW [7]. They do not require technical equipment and are used in resource limited settings. There is controversy over which anthropometric measurements best define obesity and underweight and which best describes the risk gradient of cardiometabolic disturbance by sex and for each ethnic group.
Without population specification the use of these recommendations and cut off points is inapplicable. Epidemiologic studies suggest that these anthropometric measurements and criteria warrant a re-evaluation and appropriate ethnic specific modification proposed to suit diverse populations [8-11]. These inconsistent findings warrant exploration of other anthropometric approaches that pose no risk to patients, and it remains unclear which sex-specific and ethnicity-specific anthropometric measurement has a superior discriminative power and should be adopted. Population specific cut-off points have been recommended but no assessment has been proposed for indigenous populations of Africa who generally lack health data. Previously we have shown that statistically significant differences exist between Mbororo and Fulbe for height, weight, WC, HC, BMI, BAI and between the general population and Fulbe for weight, WC, WHR, WHtR, BMI, CIndex, and fasting capillary glucose and the general population and Mbororo for weight, WC, HC, WHR, WHtR, BMI, Cindex, BAI and fasting capillary glucose and age and sex standardised prevalence of the cardiometabolic risk factors [3]. There is a paucity of studies comparing anthropometric indices in different populations and by sex with the other common obesity markers.
Accordingly, this cross-sectional study aimed to identify the best anthropometric indicators for cardiometabolic disorders in the indigenous Fulani divided into settled Fulani known as Fulbe and nomadic pastoral Fulani known as Mbororo both sharing a common ancestry and language (Fulfulde), and the mixed non-indigenous population of the Bantu described as the general population. We compared the ability of the body weight, WC, HC, BMI, WHR, WHtR, Cindex, BAI, body roundness index (BRI), and body shape index (ABSI) in discerning higher risk of dysglycaemia, hypertension (HBP), dysglycaemia/hypertension and metabolic syndrome (MetS).
Study Design and Methods
A cross-sectional study was conducted in five sites (Madjou II, Guiwa-Yangamou, Mazidou, Sabga and Gom-Mana) inhabited mostly by Fulani in the East and Adamawa regions of Cameroon. The detailed description of the study design and procedures has been described elsewhere [3,4]. In summary, a multi-stage sampling procedure was used to recruit participants and a modified World Health Organisation (WHO) STEPwise approach questionnaire for the surveillance of NCDs was used to collect data. Data was collected on ethnic descent, behavioural risk factors included physical activity, diet and alcohol, tobacco consumption, health and medical history and family history of diabetes, hypertension, and obesity. The body weight, height, waist and hip circumference were measured using standard procedures and BMI, WHR, WHtR, CIndex, BAI, BRI, and ABSI were determined.
Determination of anthropometric values
BMI was calculated as weight/height² (kg/m²) from weight and height [12]. Central obesity was determined from the WHR and WHtR [13-15]. The Cindex was calculated from waist circumference (m) ÷ 0.019 X √ [Weight (Kg)/Height (m)] [16,17]. The BAI [18] was obtained from (BAI = ((hip circumference in cm)/ ((height in meters) 1.5)-18)). The BRI combines height and WC to predict the percentage of regional and total fat was estimated from BRI=364.2 – 365.5 X √1 – ((WC/(2π))2/(0.5 x Height)2) [19] and body shape index reflecting body shape by incorporating WC, weight and height was obtained from ABSI= WC/(BMI2/3)X(Height1/2) [20].
Blood pressure and fasting capillary glucose measurement
Blood pressure was measured on the right arm with uncrossed legs using arm blood pressure fully automated calibrated Omron M3 machine. Mean blood pressure of two closest measures was calculated. Fasting capillary glucose was measured with HemoCue Hb 201 DM Analyser (Angelhom, Sweden) [21] for participants who had no caloric intake for at least eight hours through an overnight fast.
Definition of Cardiometabolic Disorders
IFG and Diabetes or dysglycaemia
International Diabetes Federation (IDF) and WHO diagnostic and classification criteria were used for two similar results with discordant results excluded for this analysis. Participants with fasting capillary glucose of 6.1–6.9 mmol/L (110 mg/dl–125 mg/dl) were classified as impaired fasting glucose (IFG), ≥ 7 mmol/L (126 mg/dl) as diabetes and/or on anti-diabetic medication [22]. Dysglycaemia was defined as IFG and diabetes or IFG and taking diabetes medication.
Hypertension: Blood pressure for participants with mean Systolic Blood Pressure (SBP) ≥130 mmHg or mean Diastolic Blood Pressure (DBP) ≥ 85 mmHg or the two and/or self-reported current treatment of hypertension and/or taking anti-hypertensive medication were considered as hypertensive. Normal SBP was <120 mmHg and DBP <80 mmHg.
Dysglycaemia/hypertension
Dysglycaemia as defined above and SBP ≥130 mmHg or mean DBP ≥ 85 mmHg or the two and/or self-reported current treatment of hypertension and/or taking anti-hypertensive medication were considered as hypertensive and classified as dysglycaemia/hypertension.
Metabolic syndrome (MetS)
Metabolic syndrome was defined as elevated WC ≥ 102 cm in men and ≥ 88 cm in women, elevated blood pressure ≥ 130 mmHg of SBP or ≥ 85 mmHg of DBP or on antihypertensive drug treatment in a patient with a history of hypertension and elevated fasting capillary glucose of 6.1 mmol/L (110 mg/dl) or on drug treatment for elevated glucose [23].
Data management and statistical analysis
Data was captured with Epi Data 3.0 and analysed using STATA 18.5 MP (StataCorp. College Station, TX: StataCorp LP). The Shapiro-Wilks test was used to assess the normal distribution of data. The socio-demographic, lifestyle factors, anthropometric measurements and metabolic disorder are described in the 3 population groups as frequencies and percentages for categorical data and median and 25th to 75th percentile for skewed continuous data as well as the mean for all normally distributed continuous variables as means and standard deviation. Spearman correlation coefficients (rho) were determined for each pair of the anthropometric measures and classified as very strong if rho was 0.8–1.0, strong if 0.6–0.8, moderate for 0.4–0.5, weak for >0.0–0.4 and no relationship if zero. Z-scores was calculated for each of the anthropometric values for the whole sample. The use of Z-scores permitted the comparison of the risk magnitude per 1 standard deviation (SD) change in the anthropometry, as well as sex-stratification using Fisher’s Yates transformation [24]. The predictive ability of the anthropometric measurements for the cardiometabolic disorders were compared by the area under the curve (AUC) receiver-operating characteristic (ROC) curve and the 95% confidence interval (CIs) using the trapezoidal rule [25]. The AUC of <0.60 reflects no discrimination, 0.60–0.69: moderate, 0.70–0.79: acceptable and 0.80–0.89: excellent and ≥ 0.90: outstanding [26,27]. Multiple logistic regression was used to evaluate the association between cardiometabolic disorder risk, and each standard deviation (SD) increase of the anthropometric measure adjusted for age group, marital status, physical activity, smoking and drinking status, fruit and vegetable consumption, salt and sugar intake and site and the multivariable adjusted odds ratios (MAORs) and 95% CI was reported. A p-value of <0.05 was considered statistically significant.
Ethical approval
The study protocol was approved by National Ethics Committee of Cameroon, authorization No: 236/CNE/SE/2012. Informed consent was obtained from each participant by signing or thumb printing before inclusion in the study. Participants’ privacy and confidentiality during interview was guaranteed and data was anonymized and kept confidential. Statistical analysis was carried out on codified anonymous dataset. Each participant after counselling received confidential results of the anthropometric measures, blood pressure and fasting capillary glucose (FCG).
Results
Descriptive results
Data was analysed for 1921 participants aged 32 (24–45) years, women 1284 (66.8%) aged 30 (23–41) and men 637 (33.2%) aged 38 (27–50) years. The prevalence of BW was significantly higher in the general population when compared to the Fulbe and Mbororo groups for men and women. The Mbororo women had the lowest BW [49 (43–56) kg, 53 (45–63) kg, 56 (50–65) kg, p=0.001] and BMI [(18.4 (16.7–20.8) kg/m2, 19.7 (17.3–22.9) kg/m2, 21.1 (19.3–24.0) kg/m2, p=0.001] when compared to the Fulbe and general population groups (Table 1).
|
Sex, n (%) |
Female, 1284 (66.8) |
Male, 637 (33.2) |
||||
|
Ethnicity, n (%) |
Fulbe, 280 (21.8) |
Mbororo, 632 (49.2) |
General population, 372 (29.0) |
Fulbe, 139 (21.8) |
Mbororo, 286 (44.9) |
General population, 212 (33.3) |
|
Age in years, median (25th – 75th) |
30 (23 - 40) |
30 (24 - 40) |
30 (23 - 43) |
37 (24 - 51) |
38 (28 - 52) |
35.5 (26 - 50) |
|
Age group, years, n (%) |
||||||
|
20 – 39 |
197 (70.4) |
445 (70.4) |
255 (68.6) |
77 (55.4) |
151 (52.8) |
121 (57.1) |
|
40 – 59 |
67 (23.9) |
145 (22.9) |
84 (22.6) |
38 (27.3) |
98 (34.3) |
64 (30.2) |
|
≥ 60 |
16 (5.7) |
42 (6.7) |
33 (8.9) |
24 (17.3) |
37 (12.9) |
27 (12.7) |
|
Smoker, n (%) |
5 (1.8) |
15 (2.4) |
25 (6.7) |
27 (19.4) |
49 (17.1) |
68 (32.1) |
|
Ever drank alcohol, n (%) |
11 (3.9) |
21 (3.3) |
205 (55.1) |
24 (17.3) |
32 (11.2) |
132 (62.3) |
|
Fruit consumption |
||||||
|
High (5 – 7days/week) |
70 (25.0) |
101 (16.0) |
78 (21.0) |
34 (24.5) |
45 (15.7) |
49 (23.1) |
|
Moderate (3 – 4 days/week) |
64 (22.9) |
149 (23.6) |
84 (22.6) |
39 (28.1) |
77 (26.9) |
54 (25.5) |
|
Low (0 – 2 days/week) |
146 (52.1) |
382 (60.4) |
210 (56.5) |
66 (47.5) |
164 (57.3) |
109 (51.4) |
|
Vegetable consumption |
||||||
|
High (5 – 7days/week) |
178 (63.6) |
320 (50.6) |
162 (43.6) |
82 (59.0) |
150 (52.4) |
82 (38.7) |
|
Moderate (3 – 4 days/week) |
77 (27.5) |
210 (33.2) |
133 (35.7) |
41 (29.5) |
91 (31.8) |
80 (37.7) |
|
Low (0 – 2 days/week) |
25 (8.9) |
102 (16.1) |
77 (20.7) |
16 (11.5) |
45 (15.7) |
50 (23.6) |
|
Always add salt to food |
54 (19.3) |
112 (17.7) |
87 (23.4) |
23 (16.6) |
50 (17.5) |
34 (16.0) |
|
Always add sugar to tea/coffee |
51 (18.2) |
94 (14.9) |
94 (25.3) |
31 (22.3) |
58 (20.3) |
56 (26.4) |
|
10 mins Physical activity at work, n (%) |
||||||
|
Vigorous |
101 (36.1) |
235 (37.2) |
166 (44.6) |
63 (45.3) |
148 (51.8) |
135 (63.7) |
|
Moderate |
79 (28.2) |
205 (32.4) |
130 (35.0) |
34 (24.5) |
66 (23.1) |
39 (18.4) |
|
Low |
100 (35.7) |
192 (30.4) |
76 (20.4) |
42 (30.2) |
72 (25.2) |
38 (17.9) |
|
Anthropometry, median (25th – 75th) |
||||||
|
Body Weight (BW) |
50.0 (43.0 – 59.5) |
46.0 (41.0 – 53.0) |
54.0 (49.0 – 62.0) |
57.0 (52.0 – 68.0) |
54.0 (48.0 – 61.0) |
60.0 (54.0 – 67.0) |
|
Waist circumference (WC) |
74.0 (66.5 – 84.0) |
72.0 (66.0 – 80.0) |
78.0 (72.0 – 85.5) |
76.0 (70.0 – 83.0) |
75.0 (70.0 – 81.0) |
76.0 (72.0 – 84.0) |
|
Hip circumference (HC) |
90.0 (84.0 – 98.0) |
87.0 (83.0 – 93.0) |
92.0 (86.0 – 98.0) |
90.0 (86.0 – 97.0) |
88.0 (83.0 – 92.0) |
89.0 (85.0 – 96.0) |
|
Body mass index (BMI) |
19.3 (16.9–23.0) |
18.3 (16.5–20.6) |
21.1 (19.4 – 24.5) |
20.1 (18.0 – 22.9) |
18.8 (17 – 21.1) |
21.2 (19.1 – 23.4) |
|
Waist-Hip-Ratio (WHR) |
0.82 (0.76–0.89) |
0.82 (0.78–0.88) |
0.85 (0.80 – 0.91) |
0.85 (0.80 – 0.90) |
0.86 (0.81 – 0.91) |
0.86 (0.82 – 0.90) |
|
Waist-Height-Ratio (WHtR) |
0.46 (0.42–0.53) |
0.45 (0.42–0.50) |
0.49 (0.46 – 0.54) |
0.44 (0.41 – 0.49) |
0.45 (0.42 – 0.48) |
0.45 (0.42 – 0.49) |
|
Conicity Index (Cindex) |
1.21 (1.14–1.31) |
1.22 (1.15–1.30) |
1.22 (1.16 – 1.30) |
1.21 (1.14 – 1.28) |
1.22 (1.15 – 1.29) |
1.18 (1.12 – 1.25) |
|
Body adiposity Index (BAI) |
26.9 (23.8 – 30.8) |
25.6 (23.3 – 28.3) |
27.5 (25.5 – 31.1) |
23.0 (19.9 – 25.3) |
21.7 (19.9 – 24.6) |
22.6 (20.7 – 25.6) |
|
Body roundness index (BRI) |
2.70 (1.97–3.95) |
2.48 (1.93–3.36) |
3.19 (2.58–4.08) |
2.36 (1.84–3.25) |
2.40 (1.94–3.02) |
2.54 (2.03 – 3.28) |
|
Body shape index (ABSI) |
0.81 (0.76 – 0.85) |
0.82 (0.77 – 0.86) |
0.79 (0.76 – 0.85) |
0.79 (0.75 – 0.85) |
0.81 (0.77 – 0.87) |
0.77 (0.73 – 0.82) |
|
Metabolic disorder, n (%) |
||||||
|
Dysglycaemia or IFG/Diabetes |
42 (15.0) |
96 (15.2) |
58 (15.6) |
23 (16.6) |
42 (14.7) |
37 (17.5) |
|
Hypertension |
117 (41.8) |
254 (40.2) |
152 (40.9) |
81 (58.3) |
152 (53.2) |
107 (50.5) |
|
Dysglycaemia/Hypertension |
133 (47.5) |
312 (49.4) |
183 (49.2) |
91 (65.5) |
170 (59.4) |
126 (59.4) |
|
Metabolic Syndrome (MetS) |
127 (45.4) |
220 (34.8) |
196 (52.7) |
36 (25.9) |
60 (21.0) |
57 (26.9) |
Correlation between the anthropometric values by sex and group (Table 2)
The BW was strongly correlated with the WC, HC, BMI WHtR, BAI, and BRI and weakly correlated with the Cindex and ABSI, p<0.05 in female and male of the Fulbe group except with the BAI in female that was moderate while the BW was strongly correlated with the WC, HC, and BMI in the female and the BMI of the male in the Mbororo and BW was strongly correlated with the WC, HC, and BMI of the female and males in the general population. The BW was not correlated with the WHR and Cindex of the female and male in the general population but weakly corrected in the female of the Mbororo population and weakly correlated with the male of the Mbororo but not with the Cindex. WC was strongly correlated with the HC, BMI, WHR, WHtR, Cindex, and BRI in both the female and male and moderately correlated with ABSI in the female but not with ABSI of the Fulbe group while the WC was strongly correlated with the HC, BMI, WHR, WHtR, Cindex, and BRI in the female of Mbororo and general population and with the WHR, WHtR, Cindex, and BRI in the male of the Mbororo group and with the HC, BMI, WHtR, Cindex, and BRI of the male in general population group while the BAI and ABSI were moderately correlated with the WC in the Mbororo and the general population of both sexes. The HC was strongly correlated with BMI, WHtR, BAI, and BRI, weakly correlated with Cindex and not correlated with WHR or ABSI in the female and male of the Fulbe group. The BMI was strongly correlated with the WHtR, BAI, and BRI and weakly correlated with the WHR, and Cindex and not with the ABSI in the female and male of the Fulbe group. The WHR was strongly correlated with the WHtR, Cindex, BRI, and ABSI and not with the BAI in both the male and female of the Fulbe group. The WHtR was strongly correlated with Cindex, BAI, and BRI in the female and male but weakly correlated with the ABSI female and moderately in male. The Cindex was strongly correlated with BRI and ABSI and weakly correlated with the BAI in both female and male. The BAI was strongly correlated with BRI in both the female and male but weakly correlated with the ABSI in the female and not with the male in the Fulbe population while the ABSI was weakly correlated with the BRI in female and moderately correlated with the BRI in the male population of the Fulbe.
|
Female (n=280) |
|
Male (n=139) |
|||||||||
|
Fulbe |
BW |
WC |
HC |
BMI |
WHR |
WHtR |
Cindex |
BAI |
BRI |
ABSI |
|
|
BW |
---- |
0.751* |
0.807* |
0.898* |
0.327* |
0.613* |
0.219* |
0.508* |
0.614* |
-0.044 |
|
|
WC |
0.748* |
----- |
0.741* |
0.744* |
0.716* |
0.941* |
0.755* |
0.595* |
0.942* |
0.523* |
|
|
HC |
0.854* |
0.730* |
------ |
0.774* |
0.162 |
0.656* |
0.363* |
0.799* |
0.660* |
0.126 |
|
|
BMI |
0.917* |
0.713* |
0.812* |
----- |
0.380* |
0.740* |
0.213* |
0.722* |
0.740* |
-0.085 |
|
|
WHR |
0.272* |
0.705* |
0.103 |
0.260* |
---- |
0.743* |
0.789* |
0.154 |
0.743* |
0.674* |
|
|
WHtR |
0.653* |
0.952* |
0.677* |
0.736* |
0.689* |
---- |
0.754* |
0.705* |
0.998* |
0.520* |
|
|
Cindex |
0.157* |
0.723* |
0.235* |
0.115* |
0.837* |
0.698* |
---- |
0.321* |
0.758* |
0.940* |
|
|
BAI |
0.622* |
0.601* |
0.825* |
0.796* |
0.072 |
0.713* |
0.179* |
----- |
0.705* |
0.092 |
|
|
BRI |
0.651* |
0.953* |
0.676* |
0.732* |
0.690* |
0.999* |
0.702* |
0.711* |
---- |
0.524* |
|
|
ABSI |
-0.176* |
0.423* |
-0.073 |
-0.244* |
0.711* |
0.390* |
0.917* |
-0.125* |
0.394* |
---- |
|
|
|
|
Male (n=286) |
|||||||||
|
|
Mbororo |
BW |
WC |
HC |
BMI |
WHR |
WHtR |
Cindex |
BAI |
BRI |
ABSI |
|
Female (n=632) |
BW |
---- |
0.602* |
0.543* |
0.879* |
0.254* |
0.414* |
-0.088 |
0.133* |
0.423* |
-0.300* |
|
WC |
0.657* |
---- |
0.530* |
0.550* |
0.698* |
0.891* |
0.666* |
0.288* |
0.912* |
0.478* |
|
|
HC |
0.750* |
0.674* |
---- |
0.474* |
-0.145* |
0.406* |
0.212* |
0.672* |
0.429* |
0.077 |
|
|
BMI |
0.888* |
0.641* |
0.687* |
---- |
0.231* |
0.533* |
-0.146* |
0.402* |
0.547* |
-0.384* |
|
|
WHR |
0.265* |
0.755* |
0.091* |
0.294* |
---- |
0.665* |
0.621* |
-0.193* |
0.684* |
0.534* |
|
|
WHtR |
0.525* |
0.943* |
0.591* |
0.653* |
0.754* |
---- |
0.676* |
0.471* |
0.977* |
0.446* |
|
|
Cindex |
0.085* |
0.754* |
0.289* |
0.067 |
0.779* |
0.735* |
---- |
0.128* |
0.657* |
0.936* |
|
|
BAI |
0.424* |
0.527* |
0.752* |
0.657* |
0.084* |
0.658* |
0.243* |
---- |
0.490* |
0.008 |
|
|
BRI |
0.526* |
0.944* |
0.593* |
0.652* |
0.755* |
0.998* |
0.736* |
0.659* |
---- |
0.469* |
|
|
ABSI |
-0.197* |
0.504* |
0.054 |
-0.244* |
0.649* |
0.485* |
0.935* |
0.022* |
0.487* |
---- |
|
|
|
|
Male (n=212) |
|||||||||
|
|
General population |
BW |
WC |
HC |
BMI |
WHR |
WHtR |
Cindex |
BAI |
BRI |
ABSI |
|
Female (n=372) |
BW |
---- |
0.573* |
0.698* |
0.887* |
0.007 |
0.405* |
-0.082 |
0.391* |
0.404* |
-0.332* |
|
WC |
0.637* |
---- |
0.669* |
0.559* |
0.536* |
0.930* |
0.691* |
0.524* |
0.931* |
0.462* |
|
|
HC |
0.794* |
0.663* |
----- |
0.652* |
-0.165* |
0.573* |
0.218* |
0.742* |
0.573* |
0.003 |
|
|
BMI |
0.899* |
0.663* |
0.717* |
----- |
0.038 |
0.533* |
-0.099 |
0.614* |
0.534* |
-0.374* |
|
|
WHR |
0.063 |
0.617* |
-0.095* |
0.108* |
----- |
0.559* |
0.696* |
-0.064 |
0.562* |
0.632* |
|
|
WHtR |
0.487* |
0.938* |
0.554* |
0.608* |
0.651* |
---- |
0.706* |
0.652* |
0.998* |
0.485* |
|
|
Cindex |
-0.072 |
0.656* |
0.128* |
-0.077 |
0.761* |
0.675* |
---- |
0.232* |
0.707* |
0.950* |
|
|
BAI |
0.493* |
0.549* |
0.775* |
0.679* |
-0.045 |
0.653* |
0.157* |
----- |
0.653* |
0.034 |
|
|
BRI |
0.486* |
0.939* |
0.554* |
0.607* |
0.652* |
0.998* |
0.677* |
0.652* |
---- |
0.486* |
|
|
ABSI |
-0.368* |
0.369* |
-0.133* |
-0.397* |
0.648* |
0.391* |
0.927* |
-0.094 |
0.393* |
---- |
|
|
*: Statistically significant with p<0.05 |
|||||||||||
Comparison of obesity phenotypes
The BW of women and men differed significantly for the Fulbe, Mbororo, and general population (all, p<0.001). The WC and BMI of women and men was similar for the Fulbe (p>0.05), and general population (p>0.05) but was lower for the Mbororo women compared to the men (WC: 72.0 vs. 75.0, p=0.001 and BMI: 18.3 vs. 18.8, p=0.028). There was no difference in the HC of women and men for the Fulbe (p=0.987), and Mbororo (p=0.641) but women of the general population had as higher HC compared to the men (92.0 vs. 89.0, p=0.002). Women had lower WHR than men of the Fulbe (0.82 vs. 0.85, p=0.001) and Mbororo (0.82 vs. 0.86, p<0.001) but similar in the general population (p=0.233).
Comparison of the prevalence of cardiometabolic disorder (Figure 1)
The prevalence of dysglycaemia was similar for women and men in Fulbe (15.0% vs. 16.6%, p=0.681), Mbororo (15.2% vs. 14.7%, p=0.843) and general population (15.6% vs. 17.5%, p=0.558). Women had significantly lower prevalence of hypertension than men, Fulbe (41.8% vs. 58.3%, p=0.001), Mbororo (40.2% vs. 53.2%, p<0.001), and the general population (40.9% vs. 50.5%, p=0.025). The prevalence of dysglycaemia/hypertension was significantly lower in women than men, Fulbe (47.5% vs. 65.5%, p=0.001), Mbororo (49.4% vs. 59.4%, p=0.005) and general population (49.2% vs. 59.4%, p=0.017). Women had significantly higher prevalence of MetS than men, Fulbe (45.4% vs. 25.9%, p<0.001), Mbororo (34.8% vs. 21.0%, p<0.001), and the general population (52.7% vs. 26.9%, p<0.001).
There was no significant difference in the prevalence of dysglycaemia for the three groups for women (p=0.976) and men (p=0.694); the prevalence of hypertension for women (p=0.901) and for men (p=0.356) as well as for dysglycaemia/hypertension for women (p=0.866) and men (p=0.437). There were significant differences in the prevalence of MetS in the three groups for women (Fulbe: 45.4%, Mbororo; 34.8% & general population; 52.7%, p<0.001) and not for men (Fulbe; 25.9%, Mbororo; 21.0% & general population; 26.9%, p=0.263).
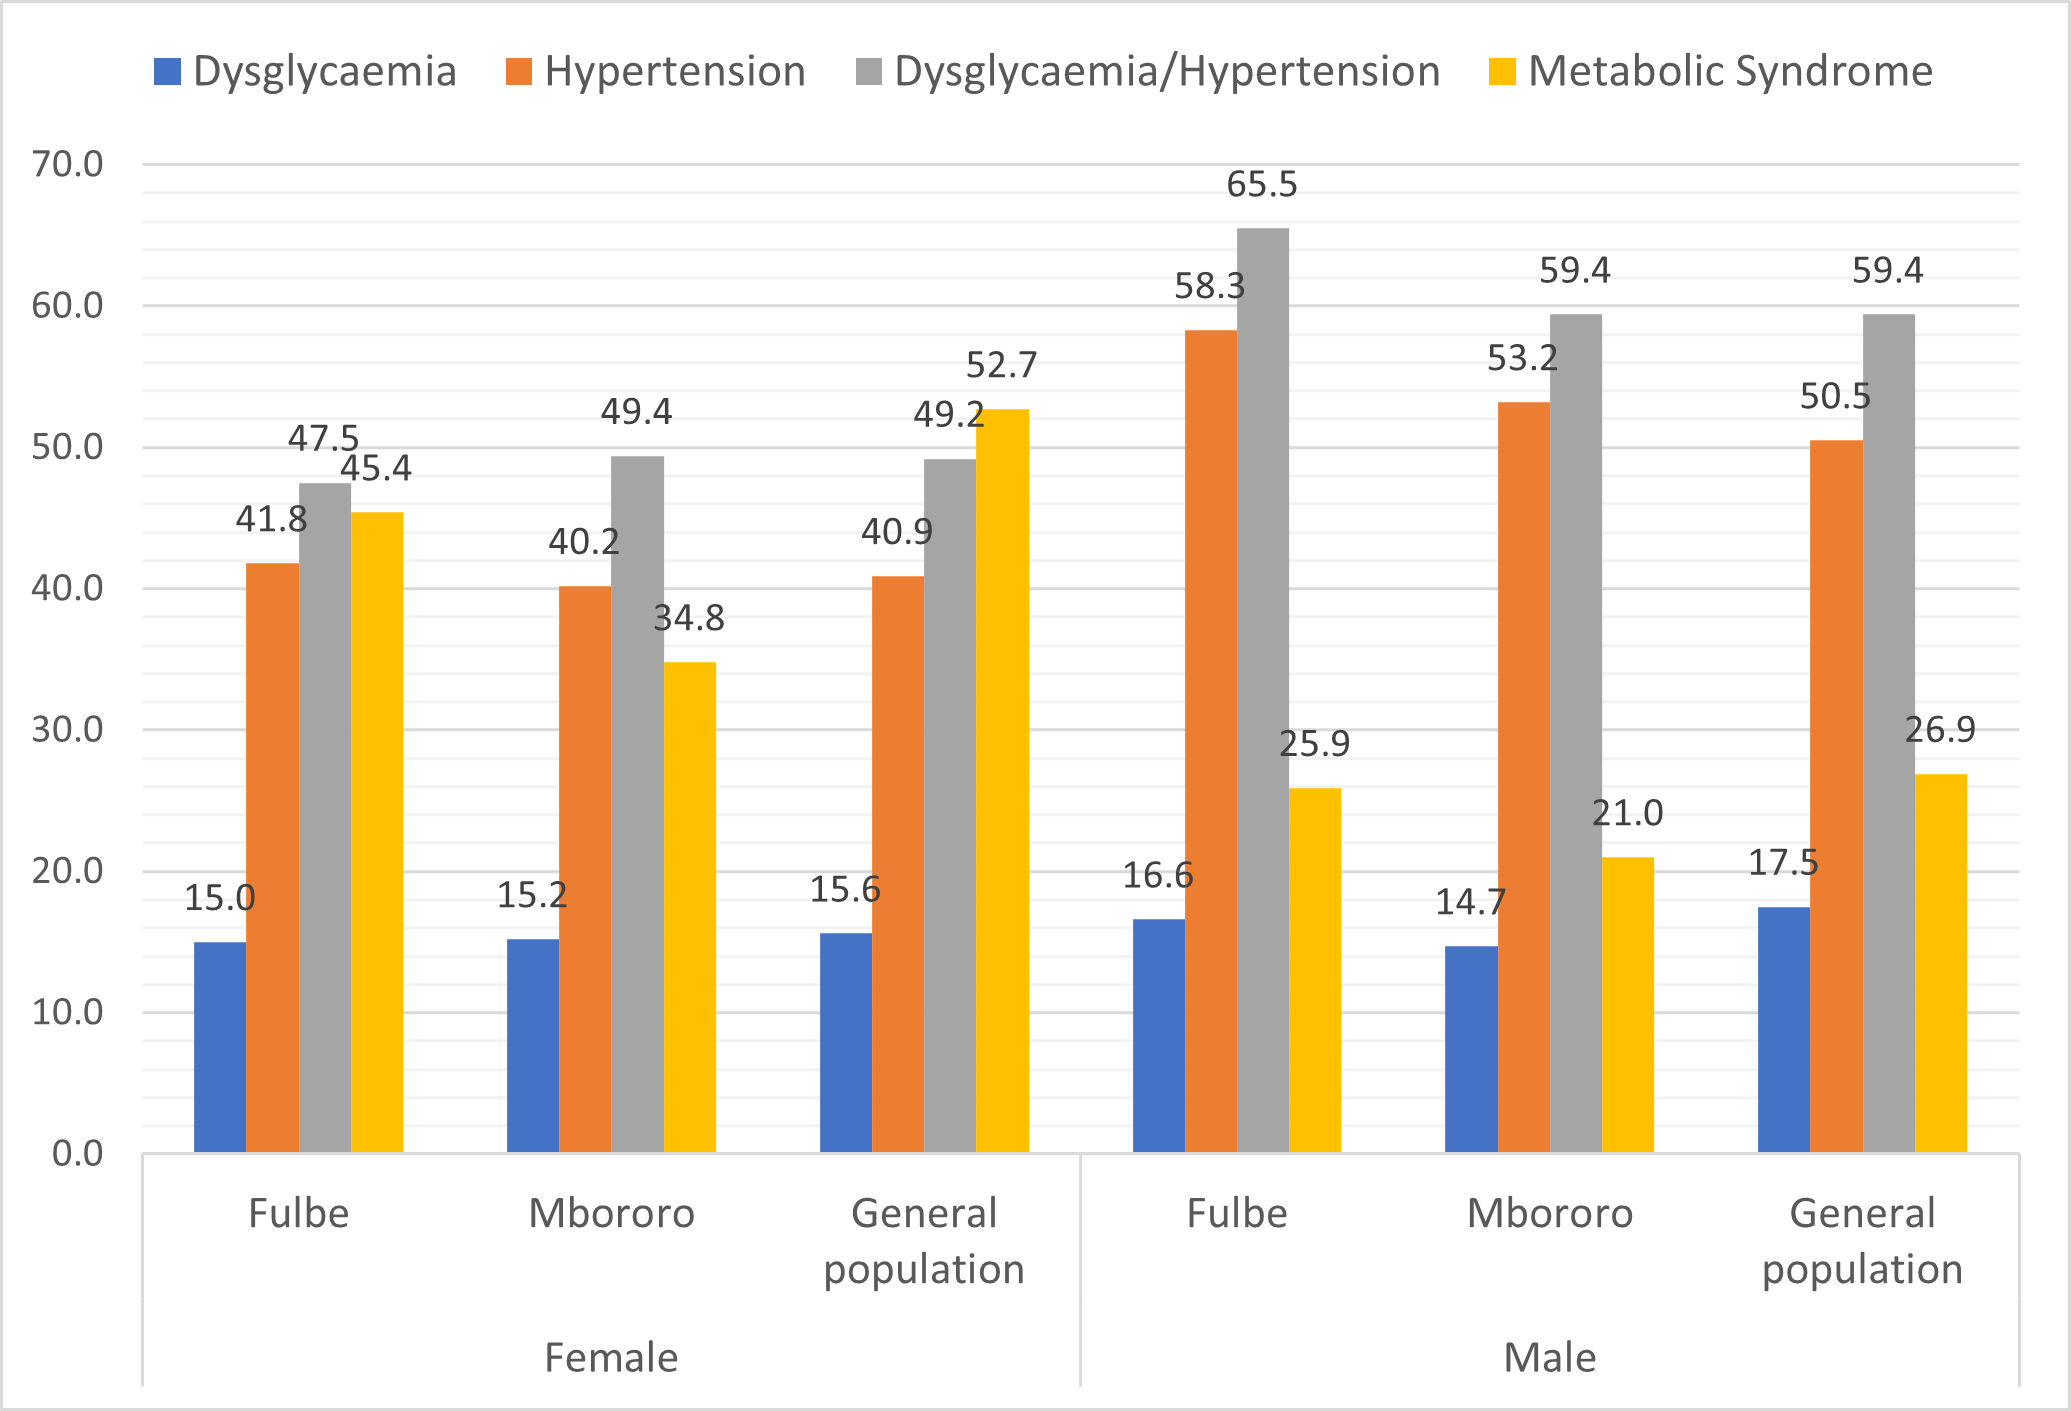
Figure 1. Prevalence of cardiometabolic disorder by group and sex.
Predictors of dysglycaemia
The area under the ROC curve showed no discrimination for ABSI and moderate discrimination for the WC, HC, WHR, Cindex, BAI, and BRI in women and for HC and BAI in men of the Fulbe group while acceptable discrimination was observed for BW, BMI, and WHtR in women and BW, WC, BMI, WHR, WHtR, Cindex, BRI, and ABSI in men. For the Mbororo group, all the anthropometric measures had moderate discrimination except ABSI that had no discrimination in women while in men; the BW, WC, HC, BMI, WHtR, Cindex, BRI, and ABSI showed moderate discrimination except for WHR which had acceptable and BAI that had no discrimination. All the anthropometric measures showed moderate discrimination in women and men except BAI and ABSI in women and BW and BMI in men that showed no discrimination for the general population (Table 3). The area under the curve ROC analysis consistently showed moderate AUC values and highest MAORs for BW and BMI, all of which were statistically significant as the best predictor in identifying dysglycaemia in women of the Fulbe group and general populations and none for men. The WC, HC, WHR, WHtR, Cindex, BAI, BRI, and ABSI were the worse predictors of dysglycaemia in both women and men of the Fulbe, Mbororo, and general population (Tables 3 and 4).
Predictors of hypertension
From the area under the ROC curve, the BW, WC, and HC showed moderate discrimination in women while BW, BMI, WHtR, and Cindex showed moderate discrimination and WC, HC, BAI, and BRI showed acceptable discrimination in men of the Fulbe group in identifying hypertension. ROC analysis showed moderate discrimination for BW, WC, HC, BMI, WHtR, BAI, and BRI had moderate discrimination for women while BW, WC, HC, BMI, WHR, WHtR, Cindex, BRI, and ABSI in men of the Mbororo group. For the general population, all the anthropometric measures showed moderate discrimination in women and men except for ABSI in men (Table 3). ROC curves consistently showed moderate AUC values and highest MAORs for BW, HC, BMI, and BAI in women and in men WC, HC and BRI in the Mbororo group. For the general population, the ROC analysis consistently showed best predicting capacity with BW, WC, HC, WHtR, Cindex, BAI and BRI in women and with BW, WC, HC, BMI, WHtR, BAI and BRI in men. However, none of the anthropometric measures identified hypertension in the women but BW, WC, HC, BMI, WHR, BAI and BRI consistently showed best predicting capacity with ROC analysis and MAORs in men of the Fulbe group. The ABSI was the worse predictor of hypertension in both women and men for all three groups (Tables 3 and 4).
Predictors of dysglycaemia/hypertension
For the Fulbe group, the area under the ROC curve did not show any discrimination characteristics as well as MAORs for all the anthropometric measures in women as well as WHR in men but showed moderate discrimination for BW, BMI, WHtR, Cindex, BAI, and BRI in men. The ROC analysis showed moderate discrimination for the anthropometric measures in women as well as in men except for WC and BRI that showed acceptable discrimination for men of the Mbororo group. In the general population group the ROC analysis had moderate discrimination for BW, HC, BMI, WHR, Cindex, BAI, and ABSI in women and BW, BMI, WHR, Cindex, and ABSI in men. Acceptable discrimination for WC, WHtR, and BRI in women and WC, HC, WHtR, BAI, and BRI in men (Table 3). The BW, HC, BMI, BAI in women and WC, HC, and BRI consistently had best predictor in men of the Mbororo group while BW, WC, HC, BMI, WHtR, BAI, and BRI were consistently best predictors in only men of the Fulbe group. While BW, WC, HC, BMI, WHtR, and BRI were consistently the best predictors in women, the WC, BMI, WHtR, BAI and BRI were consistently the best predictors in men of the general population. The WHR and ABSI were consistently the worse predictors of dysglycaemia/hypertension in both women and men of the Fulbe, Mbororo, and general population (Tables 3 and 4).
Predictors of metabolic syndrome (MetS)
The area under the ROC curve showed moderate discrimination for ABSI, acceptable discrimination for BAI, excellent discrimination for BW, HC, BMI, WHR, and Cindex and outstanding discrimination for WC, WHtR, and BRI in the women and moderate discrimination for ABSI and BAI, acceptable discrimination for BW, WC, HC, BMI, WHR, WHtR, Cindex, and BRI in men of the Fulbe group. For the Mbororo, ROC analysis had moderate discrimination for ABSI, moderate for BW, HC, BMI, WHR, Cindex and BAI and excellent discrimination for WC, WHtR and BRI in women while in men, moderate discrimination was for BMI, WHR, BAI and ABSI, acceptable in BW, WC, HC, WHtR, Cindex, and BRI. For the general population, the ABSI showed moderate discriminatory, acceptable discrimination for BW, HC, BMI, WHR, Cindex, and BAI and excellent discrimination for WC, WHtR and BRI in women while in men the WHR and ABSI showed moderate discrimination, the BW, WC, HC, BMI, WHtR, Cindex, BAI, and BRI had acceptable discrimination, and no excellent discrimination was showed for MetS in men (Table 3).
All the anthropometric measures consistently showed good performance in predicting MetS in women and men except ABSI in the men of the Fulbe, Mboroo and general population group and WHR and Cindex in the Mbororo and general population (Tables 3 and 4).
Anthropometric z-scores were associated with higher risk for MetS in Fulbe than Mbororo and the general population for every 1 standard deviation increase in anthropometric measure. When stratified by sex the statistically significant anthropometric z-scores were associated with higher risk for MetS in women than men for every 1 S.D increase in anthropometric measure in the Fulbe, Mbororo, and the general population while WHtR, BAI and BRI were associated with higher risk for hypertension in men than women of the general population group (Table 4).
|
|
Female, (n=1 284) |
Male, (n=637) |
||||||
|
Metabolic disturbance |
Fulbe |
Mbororo |
General population |
P-value |
Fulbe |
Mbororo |
General population |
P-value |
|
1 –Dysglycaemia |
(n=280) |
(n=632) |
(n=372) |
|
(n=139) |
(n=286) |
(n=212) |
|
|
Body Weight (BW) |
0.61 (0.51–0.71) |
0.54 (0.48 – 0.71) |
0.52 (0.43 – 0.60) |
0.241 |
0.61 (0.49 – 0.73) |
0.57 (0.46 – 0.67) |
0.47 (0.37 – 0.59) |
0.241 |
|
Waist circumference (WC) |
0.58 (0.47–0.68) |
0.53 (0.47 – 0.49) |
0.54 (0.46 – 0.62) |
0.787 |
0.66 (0.54 – 0.78) |
0.59 (0.50–0.69) |
0.55 (0.44 – 0.65) |
0.388 |
|
Hip circumference (HC) |
0.59 (0.48–0.69) |
0.54 (0.48 – 0.61) |
0.44 (0.35 – 0.53) |
0.087 |
0.57 (0.45 – 0.69) |
0.54 (0.43 – 0.64) |
0.51 (0.41 – 0.60) |
0.685 |
|
Body mass index (BMI) |
0.60 (0.50–0.70) |
0.56 (0.49 – 0.62) |
0.55 (0.46 – 0.63) |
0.723 |
0.61 (0.49–0.74) |
0.53 (0.42 – 0.63) |
0.48 (0.37 – 0.58) |
0.270 |
|
Waist-Hip-Ratio (WHR) |
0.55 (0.45 – 0.64) |
0.52 (0.46 – 0.58) |
0.59 (0.51 – 0.67) |
0.401 |
0.65 (0.53–0.77) |
0.60 (0.52–0.68) |
0.56 (0.45 – 0.66) |
0.563 |
|
Waist-Height-Ratio (WHtR) |
0.65 (0.53–0.77) |
0.53 (0.47 – 0.59) |
0.56 (0.48 – 0.64) |
0.845 |
0.64 (0.51–0.77) |
0.57 (0.48 – 0.66) |
0.56 (0.45 – 0.67) |
0.648 |
|
Conicity Index (Cindex) |
0.52 (0.43 – 0.61) |
0.52 (0.45 – 0.58) |
0.52 (0.43 – 0.61) |
0.997 |
0.64 (0.53–0.76) |
0.55 (0.47 – 0.64) |
0.58 (0.47 – 0.69) |
0.467 |
|
Body adiposity Index (BAI) |
0.55 (.46 – 0.65) |
0.56 (0.49–0.62) |
0.47 (0.38 – 0.56) |
0.277 |
0.55 (0.41–0.69) |
0.49 (0.39 – 0.59) |
0.52 (0.42 – 0.62) |
0.813 |
|
Body roundness index (BRI) |
0.56 (0.47 – 0.66) |
0.53 (0.47 – 0.59) |
0.56 (0.48 – 0.64) |
0.837 |
0.64 (0.51–0.77) |
0.57 (0.48–0.66) |
0.56 (0.46 – 0.67) |
0.603 |
|
Body shape index (ABSI) |
0.46 (0.37 – 0.56) |
0.49 (0.43 – 0.56) |
0.49 (0.40 – 0.58) |
0.874 |
0.62 (0.51–0.73) |
0.54 (0.45 – 0.63) |
0.58 (0.47 – 0.70) |
0.537 |
|
2 – Hypertension |
(n=280) |
(n=632) |
(n=372) |
|
(n=139) |
(n=286) |
(n=212) |
|
|
Body Weight (BW) |
0.56 (0.49 – 0.62) |
0.57 (0.53–0.62) |
0.57 (0.51 – 0.63) |
0.904 |
0.63 (0.54–0.73) |
0.59 (0.53 – 0.66) |
0.61 (0.53 – 0.68) |
0.795 |
|
Waist circumference (WC) |
0.55 (0.48 – 0.62) |
0.56 (0.52 – 0.61) |
0.63 (0.57 – 0.69) |
0.100 |
0.66 (0.57–0.75) |
0.61 (0.54–0.67) |
0.61 (0.53 – 0.68) |
0.606 |
|
Hip circumference (HC) |
0.57 (0.50–0.63) |
0.58 (0.53–0.62) |
0.61 (0.55 – 0.67) |
0.546 |
0.69 (0.60–0.78) |
0.57 (0.50–0.63) |
0.61 (0.53 – 0.68) |
0.088 |
|
Body mass index (BMI) |
0.54 (0.47 – 0.61) |
0.57 (0.52–0.61) |
0.56 (0.50 – 0.62) |
0.817 |
0.63 (0.53–0.72) |
0.57 (0.51 – 0.64) |
0.61 (0.53 – 0.68) |
0.632 |
|
Waist-Hip-Ratio (WHR) |
0.53 (0.46 – 0.59) |
0.52 (0.48 – 0.57) |
0.56 (0.50 – 0.62) |
0.650 |
0.52 (0.42 – 0.61) |
0.57 (0.50–0.63) |
0.55 (047 – 0.62) |
0.708 |
|
Waist-Height-Ratio (WHtR) |
0.54 (0.47 – 0.61) |
0.56 (0.51 – 0.60) |
0.62 (0.56 – 0.68) |
0.124 |
0.64 (0.55–0.73) |
0.59 (0.52–0.65) |
0.61 (0.54 – 0.69) |
0.647 |
|
Conicity Index (Cindex) |
0.54 (0.47 – 0.61) |
0.53 (0.49 – 0.58) |
0.60 (0.55 – 0.66) |
0.140 |
0.59 (0.49 – 0.68) |
0.56 (0.50 – 0.63) |
0.54 (0.46 – 0.62) |
0.784 |
|
Body adiposity Index (BAI) |
0.54 (0.47 – 0.61) |
0.55 (0.51 – 0.59) |
0.60 (0.54 – 0.66) |
0.350 |
0.67 (0.58–0.76) |
0.52 (0.46 – 0.59) |
0.62 (0.55 – 0.69) |
0.026 |
|
Body roundness index (BRI) |
0.54 (0.47 – 0.61) |
0.56 (0.51 – 0.60) |
0.62 (0.56 – 0.68) |
0.147 |
0.65 (0.56–0.74) |
0.59 (0.53 – 0.66) |
0.61 (0.54 – 0.69) |
0.647 |
|
Body shape index (ABSI) |
0.52 (0.45 – 0.59) |
0.50 (0.46 – 0.55) |
0.56 (0.50 – 0.62) |
0.273 |
0.53 (0.44 – 0.63) |
0.55 (0.48 – 0.62) |
0.51 (0.42 – 0.58) |
0.712 |
|
3–Dysglycaemia/hypertension |
(n=280) |
(n=632) |
(n=372) |
|
(n=139) |
(n=286) |
(n=212) |
|
|
Body Weight (BW) |
0.53 (0.46 – 0.60) |
0.57 (0.53–0.62) |
0.57 (0.52 – 0.63) |
0.571 |
0.66 (0.56–0.76) |
0.59 (0.53 – 0.66) |
0.57 (0.49 – 0.65) |
0.356 |
|
Waist circumference (WC) |
0.53 (0.46 – 0.59) |
0.57 (0.52–0.61) |
0.62 (0.56 – 0.67) |
0.131 |
0.70 (0.61–0.79) |
0.61 (0.55–0.68) |
0.61 (0.53 – 0.68) |
0.240 |
|
Hip circumference (HC) |
0.53 (0.47 – 0.60) |
0.59 (0.54–0.63) |
0.58 (0.52 – 0.63) |
0.440 |
0.70 (0.61–0.79) |
0.56 (0.50 – 0.63) |
0.60 (0.52 – 0.67) |
0.058 |
|
Body mass index (BMI) |
0.52 (0.45 – 0.58) |
0.57 (0.53–0.61) |
0.58 (0.52 – 0.64) |
0.325 |
0.66 (0.57–0.76) |
0.56 (0.50 – 0.63) |
0.57 (0.49 – 0.65) |
0.227 |
|
Waist-Hip-Ratio (WHR) |
0.54 (0.47–0.60) |
0.52 (0.48 – 0.57) |
0.57 (0.51 – 0.63) |
0.397 |
0.55 (0.45 – 0.65) |
0.58 (0.52 – 0.65) |
0.56 (0.48 – 0.63) |
0.813 |
|
Waist-Height-Ratio (WHtR) |
0.52 (0.45 – 0.59) |
0.56 (0.51 – 0.60) |
0.62 (0.56 – 0.67) |
0.080 |
0.68 (0.58–0.77) |
0.59 (0.52 – 0.66) |
0.62 (0.54 – 0.69) |
0.338 |
|
Conicity Index (Cindex) |
0.54 (0.47–0.61) |
0.54 (0.49 – 0.58) |
0.58 (0.52 – 0.63) |
0.574 |
0.60 (0.50 – 0.70) |
0.57 (0.50 – 0.64) |
0.58 (0.50 – 0.66) |
0.874 |
|
Body adiposity Index (BAI) |
0.51 (0.44 – 0.58) |
0.57 (0.52–0.61) |
0.57 (0.52 – 0.63) |
0.310 |
0.69 (0.60–0.78) |
0.51 (0.44 – 0.58) |
0.62 (0.55 – 0.69) |
0.005 |
|
Body roundness index (BRI) |
0.52 (0.45 – 0.59) |
0.56 (0.51 – 0.60) |
0.61 (0.56 – 0.67) |
0.104 |
0.69 (0.59–0.78) |
0.60 (0.53–0.66) |
0.62 (0.54 – 0.69) |
0.318 |
|
Body shape index (ABSI) |
0.53 (0.47 – 0.60) |
0.51 (0.46 – 0.55) |
0.53 (0.47 – 0.59) |
0.762 |
0.54 (0.43 – 0.64) |
0.56 (0.49 – 0.63) |
0.55 (0.47 – 0.63) |
0.949 |
|
4 – MetS |
(n=280) |
(n=632) |
(n=372) |
|
(n=139) |
(n=286) |
(n=212) |
|
|
Body Weight (BW) |
0.83 (0.78–0.87) |
0.73 (0.68–0.77) |
0.78 (0.74 – 0.83) |
0.014 |
0.78 (0.68–0.87) |
0.60 (0.52–0.69) |
0.63 (0.54 – 0.73) |
0.020 |
|
Waist circumference (WC) |
0.92 (0.88–0.95) |
0.87 (0.83–0.91) |
0.93 (0.89 – 0.96) |
0.045 |
0.79 (0.70–0.89) |
0.63 (0.55–0.72) |
0.67 (0.58 – 0.76) |
0.035 |
|
Hip circumference (HC) |
0.82 (0.77–0.87) |
0.75 (0.71–0.79) |
0.78 (0.73 – 0.83) |
0.100 |
0.77 (0.67–0.88) |
0.61 (0.52–0.69) |
0.65 (0.56 – 0.74) |
0.047 |
|
Body mass index (BMI) |
0.82 (0.77–0.87) |
0.74 (0.70–0.79) |
0.79 (0.74 – 0.83) |
0.098 |
0.74 (0.64–0.84) |
0.57 (0.48 – 0.67) |
0.65 (0.56 – 0.74) |
0.055 |
|
Waist-Hip-Ratio (WHR) |
0.80 (0.75–0.85) |
0.77 (0.73–0.81) |
0.76 (0.71 – 0.81) |
0.585 |
0.71 (0.61–0.81) |
0.59 (0.51 – 0.66) |
0.59 (0.50 – 0.67) |
0.106 |
|
Waist-Height-Ratio (WHtR) |
0.91 (0.87–0.95) |
0.86 (0.83–0.90) |
0.91 (0.87 – 0.94) |
0.152 |
0.75 (0.64–0.85) |
0.62 (0.53–0.70) |
0.68 (0.59 – 0.77) |
0.153 |
|
Conicity Index (Cindex) |
0.80 (0.75–0.85) |
0.78 (0.74–0.82) |
0.76 (0.71 – 0.80) |
0.441 |
0.74 (0.65–0.84) |
0.60 (0.52–0.68) |
0.62 (0.53 – 0.70) |
0.056 |
|
Body adiposity Index (BAI) |
0.78 (0.73–0.84) |
0.73 (0.69–0.78) |
0.73 (0.68 – 0.78) |
0.301 |
0.68 (0.5–0.79) |
0.56 (0.47 – 0.65) |
0.65 (0.56 – 0.74) |
0.199 |
|
Body roundness index (BRI) |
0.91 (0.87–0.95) |
0.86 (0.83–0.90) |
0.91 (0.87 – 0.94) |
0.147 |
0.75 (0.65–0.86) |
0.62 (0.53–0.70) |
0.69 (0.60 – 0.77) |
0.144 |
|
Body shape index (ABSI) |
0.67 (0.61–0.73) |
0.68 (0.63–0.72) |
0.63 (0.57 – 0.68) |
0.379 |
0.67 (0.57–0.77) |
0.57 (0.49 – 0.65) |
0.55 (0.47 – 0.64) |
0.155 |
|
p-value: testing the null hypothesis H0: AUC (Fulbe)=AUC (Mbororo)=AUC (General population), Bold: indicates the highest value of the AUC by sex. |
||||||||
|
|
Female |
Male |
||||
|
|
Fulbe |
Mbororo |
General population |
Fulbe |
Mbororo |
General population |
|
1–Dysglycaemia |
(n=275) |
(n=632) |
(n=372) |
(n=139) |
(n=286) |
(n=212) 205 |
|
BW |
1.55 (1.15 – 2.09)aa |
1.26 (0.95 – 1.66)b |
1.40 (1.04 – 1.87)aa |
1.17 (0.75 – 1.82)b |
1.36 (0.89 – 2.09)b |
0.86 (0.55 – 1.34)b |
|
WC |
1.28 (0.94 – 1.74)b |
1.09 (0.87 – 1.37)b |
1.16 (0.84 – 1.61)b |
1.37 (0.86 – 2.18)b |
1.46 (0.93 – 2.29)b |
1.14 (0.74– 1.77)b |
|
HC |
1.32 (0.99 – 1.75)b |
1.23 (0.95 – 1.60)b |
1.01 (0.74 – 1.36)b |
1.20 (0.73 – 1.97)b |
1.31 (0.83 – 2.06)b |
1.05 (0.71 – 1.53)b |
|
BMI |
1.41 (1.06 – 1.88)aa |
1.21 (0.96 – 1.52)b |
1.44 (1.09 – 1.89)aa |
1.23 (0.75 – 2.01)b |
1.28 (0.82 – 1.99)b |
0.88 (0.54 – 1.43)b |
|
WHR |
0.99 (0.69 – 1.41)b |
0.95 (0.75 – 1.19)b |
1.30 (0.93 – 1.81)b |
1.58 (0.79 – 3.14)b |
1.16 (0.81 – 1.66)b |
1.07 (0.71 – 1.62)b |
|
WHtR |
1.18 (0.86 – 1.62)b |
1.09 (0.87 – 1.35)b |
1.19 (0.86 – 1.64)b |
1.40 (0.84 – 2.32)b |
1.33 (0.85 – 2.10)b |
1.22 (0.77 – 1.92)b |
|
Cindex |
0.93 (0.68 – 1.28)b |
0.96 (0.76 – 1.20)b |
0.82 (0.58 – 1.15)b |
1.54 (0.77 – 3.07)b |
1.19 (0.83 – 1.71)b |
1.31 (0.87 – 1.98)b |
|
BAI |
1.13 (0.83 – 1.55)b |
1.19 (0.93 – 1.51)b |
1.04 (0.76 – 1.42)b |
1.29 (0.70 – 2.36)b |
1.13 (0.68 – 1.89)b |
1.11 (0.69 – 1.78)b |
|
BRI |
1.22 (0.88 – 1.67)b |
1.07 (0.87 – 1.32)b |
1.16 (0.86 – 1.58)b |
1.37 (0.84 – 2.22)b |
1.38 (0.85 – 2.23)b |
1.23 (0.76 – 1.98)b |
|
ABSI |
0.85 (0.61 – 1.17)b |
0.89 (0.71 – 1.13)b |
0.74 (0.52 – 1.05)b |
1.36 (0.63 – 2. 92)b |
1.21 (0.82 – 1.78)b |
1.33 (0.87 –2.03)b |
|
2 - Hypertension |
(n=275) |
(n=632) |
(n=372) |
(n=139) |
(n=286) |
(n=212) |
|
BW |
1.19 (0.92 – 1.53)b |
1.33 (1.06–1.66)aa |
1.28 (1.01 – 1.62)aa |
2.01 (1.26 – 3.22)aa |
1.33 (0.95 – 1.86)b |
1.44 (1.03 – 2.02)aa |
|
WC |
1.13 (0.89 – 1.44)b |
1.14 (0.95 – 1.36)b |
1.54 (1.19 – 1.99)ac |
1.88 (1.18 – 2.99)aa |
1.49 (1.07 – 2.08)aa |
1.45 (1.02 – 2.06)aa |
|
HC |
1.18 (0.94 – 1.48)b |
1.35 (1.10–1.65)ac |
1.39 (1.10 – 1.77)ac |
2.69 (1.59 – 4.56)ad |
1.40 (1.01 – 1.94)aa |
1.37 (1.01 – 1.86)aa |
|
BMI |
1.09 (0.86 – 1.39)b |
1.28 (1.05–1.54)aa |
1.22 (0.97 – 1.51)b |
2.16 (1.27 – 3.67)aa |
1.33 (0.93 – 1.91)b |
1.79 (1.22 – 2.65)aa |
|
WHR |
0.92 (0.69 – 1.22)b |
0.93 (0.78 – 1.10)b |
1.19 (0.91 – 1.57)b |
0.81 (0.48 – 1.35)b |
1.18 (0.91 – 1.53)b |
1.06 (0.78 – 1.45)b |
|
WHtR |
1.07 (0.83 – 1.37)b |
1.14 (0.96 – 1.35)b |
1.47 (1.14 – 1.89)aa |
1.84 (1.12 – 3.02)aa |
1.34 (0.94 – 1.89)b |
1.59 (1.11 – 2.31)aa |
|
Cindex |
1.03 (0.80 – 1.33)b |
0.98 (0.82 – 1.16)b |
1.46 (1.12 – 1.91)aa |
1.25 (0.73 – 2.17)b |
1.07 (0.81 – 1.41)b |
1.06 (0.79 – 1.43)b |
|
BAI |
1.05 (0.82 – 1.34)b |
1.29 (1.07 – 1.57)aa |
1.31 (1.02 – 1.67)aa |
2.76 (1.50 – 5.07)ac |
1.33 (0.92 – 1.94)b |
1.94 (1.29 – 2.89)ac |
|
BRI |
1.09 (0.84 – 1.41)b |
1.11 (0.94 – 1.31)b |
1.44 (1.13 – 1.83)aa |
1.94 (1.14 – 3.31)aa |
1.54 (1.06 – 2.25)aa |
1.65 (1.11 – 2.45)aa |
|
ABSI |
0.99 (0.76 – 1.29)b |
0.91 (0.76 – 1.08)b |
1.31 (1.00 – 1.72)b |
0.88 (0.49 – 1.59)b |
1.13 (0.86 – 1.47)b |
0.94 (0.69 – 1.28)b |
|
3–Dysglycaemia/hypertension |
(n=275) |
(n=632) |
(n=372) |
(n=139) |
(n=286) |
(n=212) |
|
BW |
1.18 (0.92 – 1.53)b |
1.33 (1.06 – 1.65)aa |
1.28 (1.01 – 1.62)aa |
2.01 (1.26 – 3.22)aa |
1.32 (0.94 – 1.86)b |
1.27 (0.91 – 1.77)b |
|
WC |
1.13 (0.89 – 1.44)b |
1.14 (0.95 – 1.36)b |
1.54 (1.19 – 1.99)ac |
1.88 (1.18 – 2.99)aa |
1.50 (1.07 – 2.09)aa |
1.45 (1.02 – 2.06)aa |
|
HC |
1.18 (0.94 – 1.48)b |
1.35 (1.10 – 1.65)ac |
1.40 (1.10 – 1.77)aa |
2.70 (1.59 – 4.56)ad |
1.40 (1.01 – 1.94)aa |
1.33 (0.97 – 1.81)b |
|
BMI |
1.10 (0.86 – 1.39)b |
1.28 (1.05 – 1.54)aa |
1.36 (1.09 – 1.71)aa |
2.16 (1.27 – 3.67)aa |
1.33 (0.93 – 1.91)b |
1.80 (1.22 – 2.65)aa |
|
WHR |
0.92 (0.69 – 1.22)b |
0.93 (0.78 – 1.10)b |
1.19 (0.91 – 1.57)b |
0.81 (0.49 – 1.35)b |
1.18 (0.91 – 1.53)b |
1.06 (0.78 – 1.45)b |
|
WHtR |
1.07 (0.83 – 1.37)b |
1.14 (0.96 – 1.35)b |
1.47 (1.14 – 1.89)aa |
1.84 (1.12 – 3.02)aa |
1.34 (0.94 – 1.89)b |
1.59 (1.11 – 2.30)aa |
|
Cindex |
1.03 (0.80 – 1.33)b |
0.98 (0.82 – 1.16)b |
1.19 (0.92 – 1.53)b |
1.26 (0.73 – 2.17)b |
1.07 (0.81 – 1.41)b |
1.06 (0.79 – 1.43)b |
|
BAI |
1.05 (0.82 – 1.34)b |
1.30 (1.08 – 1.57)aa |
1.24 (0.98 – 1.58)b |
2.83 (1.56 – 5.16)aa |
1.33 (0.92 – 1.94)b |
1.94 (1.30 – 2.89)ac |
|
BRI |
1.09 (0.84 – 1.41)b |
1.11 (0.94 – 1.31)b |
1.44 (1.13 – 1.83)aa |
1.94 (1.14 – 3.31)aa |
1.54 (1.06 – 2.25)aa |
1.65 (1.11 – 2.45)aa |
|
ABSI |
0.99 (0.76 – 1.29)b |
0.91 (0.77 – 1.08)b |
1.31 (1.00 – 1.72)b |
0.88 (0.49 – 1.59)b |
1.13 (0.86 – 1.48)b |
0.94 (0.69 – 1.28)b |
|
4 - MetS |
(n=280) |
(n=632) |
(n=372) |
(n=139) |
(n=286) |
(n=212) |
|
BW |
5.56 (3.48 – 8.89)ad |
3.93 (2.94–5.27)ad |
5.76 (3.76 – 8.84)ad |
3.64 (1.91 – 6.94)ad |
1.68 (1.14 – 2.49)aa |
1.99 (1.33 – 2.98)ac |
|
WC |
19.56 (9.41–40.66)ad |
11.44 (7.72–16.95)ad |
77.13 (29.78–199.75)ad |
4.24 (2.11–8.51)ad |
1.98 (1.30–3.01)aa |
2.44 (1.54 – 3.88)ad |
|
HC |
4.20 (2.80 – 6.29)ad |
4.19 (3.15 – 5.57)ad |
4.33 (2.98 – 6.29)ad |
3.67 (1.86 – 7.25)ad |
2.01 (1.32 – 3.06)ac |
2.08 (1.37 – 3.15)ad |
|
BMI |
4.43 (2.95 – 6.65)ad |
3.82 (2.88 – 5.07)ad |
5.20 (3.48 – 7.77)ad |
2.82 (1.49 – 5.32)ac |
1.63 (1.08 – 2.44)aa |
2.23 (1.43 – 3.48)ad |
|
WHR |
4.12 (2.73 – 6.22)ad |
3.42 (2.62 – 4.45)ad |
4.29 (2.88 – 6.41)ad |
2.52 (1.27 – 5.00)ad |
1.11 (0.82 – 1.52)b |
1.22 (0.85 – 1.76)b |
|
WHtR |
12.93 (7.04–23.72)ad |
9.79 (6.74–14.21)ad |
31.01 (14.82–64.85)ad |
3.11 (1.64 – 5.89)ad |
1.70 (1.13 – 2.54)aa |
2.45 (1.53 – 3.93)ad |
|
Cindex |
4.10 (2.74 –6.13)ad |
3.84 (2.96 – 4.99)ad |
3.63 (2.53 – 5.22)ad |
3.43 (1.63 – 7.20)ac |
1.23 (0.90 – 1.69)b |
1.41 (0.97 – 2.04)b |
|
BAI |
2.84 (2.02 – 3.99)ad |
3.36 (2.58 – 4.38)ad |
3.08 (2.20 – 4.32)ad |
2.15 (1.14 – 4.04)aa |
1.78 (1.13 – 2.81)aa |
2.25 (1.42 – 3.58)ac |
|
BRI |
17.03 (8.67–33.46)ad |
12.26 (8.11–18.53)ad |
36.55 (16.74 –79.81)ad |
3.51 (1.74 – 7.07)ad |
1.93 (1.24 – 2.99)aa |
2.71 (1.64 – 4.47)ad |
|
ABSI |
1.94 (1.43 – 2.64)ad |
2.26 (1.82 – 2.80)ad |
1.78 (1.33 – 2.37)ad |
2.05 (0.97 – 4.35)b |
1.20 (0.86 – 1.66)b |
1.16 (0.81 – 1.66)b |
|
The bold denotes statistical significance: aap<0.05, acp<0.01, adp<0.001 & the normal denotes not statistically significant: bp>0.05 Adjusted for age group, marital status, physical activity, smoking and drinking status, fruit and vegetable consumption, salt and sugar intake and site. |
||||||
Discussion
The key findings of the study were that all the anthropometric measures had good performance in predicting MetS risk in women while BW, WC, HC, BMI, and WHtR, BAI and BRI showed best performance in predicting MetS for the men in all the groups. The strength of association between anthropometric measures and MetS risk was greater in settled Fulani (Fulbe) than nomadic pastoral Fulani (Mbororo) and the general population and the risk was higher in women compared to men in all the groups. These findings suggest that with transition from nomadic to settled life indigenous Mbororo will be at a greater risk of MetS and the women at a greater than the men. The BW, HC, and BMI had best performance in women of the Mbororo and general population and not Fulbe while WC and BRI showed best performance in all the three groups of men in predicting dysglycaemia/hypertension. The BW, HC, and BAI had best performance in women of the Mbororo and general population and not Fulbe while in men, the WC, HC, and BRI showed best performance in predicting hypertension. Only the BW and BMI had best performance in women of Fulbe and general population in predicting dysglycaemia. The worse performance in predicting dysglycaemia, hypertension and dysglycaemia/hypertension was from WHR and ABSI in both men and women of all the groups. WC and BRI are better predictors of hypertension and dysglycaemia/hypertension in men in all the groups but not in women of all the groups.
The BW, WC, HC, BMI, WHtR, BAI, and BRI were the better predictors of MetS in both men and women in the Fulbe, Mbororo, and the general population. This is in line with the results of a study in Chinese men and women which identified anthropometric measures of abdominal obesity, especially WHtR in identifying MetS, dysglycaemia and dyslipidemia and BMI for identifying people with hypertension and hyperuricemia in men [28] whereas our study suggested BMI for identifying women of the Mbororo group and men of the Fulbe and the general population at risk of hypertension. Using ROC analysis, WC and WHtR in our study for men and women of the Fulbe, Mbororo, and general population and BMI in women of all the three groups and in men of the Fulbe predicted MetS. This was similar to a Chinese study that identified WC, BMI, and WHtR to predict ≥ 3 metabolic risk factors in men and WC and BMI to predict ≥3 metabolic risk factors in women [29]. Similar findings have been reported in a study of 202 Southern-Indians using area under the ROC curve analysis and adjusted odds ratios for age, sex, BMI, history of smoking and alcohol intake showed that BRI was superior in identifying MetS as well as Cindex if only area under the ROC curve analysis was considered with variations after stratification by sex [30]. Similar findings were reported in a European study that analysed data of 12,328 participants, where using AUC analysis the BMI and WC in men and WHtR and WC in women was shown to have a better discriminatory power in identifying MetS except ABSI [31].
Our findings showed that WHtR was the best predictor for hypertension in women and men of the general population and women of the Fulbe group. Similar findings to our study were reported in the study of indigenous population of Orang Alsi villages in the Krau Wildlife Reserve, Pahang, Peninsular Malaysia where WHtR was the best predictor for hypertension [32]. Contrary to the Orang Alsi indigenous populations we showed in that BW, HC, and BAI in women of the Mbororo indigenous group and WC, HC, and BRI in men of the Fulbe and Mbororo indigenous populations were equally good predictors of hypertension. This study showed similar findings to a study in Brazil for WC and WHtR as best predictors for hypertension in women of the general population [33]. On the contrary our study also showed that WC, BMI, and WHtR were also good predictors of hypertension in the men of the Fulbe and the general population.
Using area under the ROC curve analysis WC and WHtR were the best predictors of IFG (>110 mg/dL) in a study of 12,294 adults attending annual physical exams provided by EHE International in United States [34]. This is in line with our ROC curve results of dysglycaemia for women and men of the Fulbe group in our study. On further analysis of MAORs, neither WC nor WHtR was associated with the dysglycaemia in our study.
Results of area under the ROC curve showed that measures of central adiposity such as WC, WHtR, and BRI (measure of central adiposity) were consistently better predictors of MetS in both sexes than BMI (measure of overall adiposity) suggesting that complications of obesity are more closely related to body fat distribution rather than absolute degree of adiposity per se. This is consistent with other finding in a Singaporean study of Chinese, Malay, and Indian adults suggesting that measures of central adiposity are associated CVD risk factors than BMI [35]. Further analysis using MAORs investigating the effect of central adiposity on the overall adiposity showed that for each SD increase of WC, WHtR, and BRI had significant ORs for MetS suggesting that measures of central adiposity increase the odds of cardiometabolic risk independent of BMI in women and men of all the groups and for hypertension and dysglycaemia/hypertension of women in the general population and men of Fulbe, Mbororo, and general population. We showed that WC, WHtR, and BRI perform better in predicting MetS in both women and men of all the groups. BAI estimates percentage adiposity directly and similar to the Singaporean study, our study showed that it may be a good predictor of cardiometabolic disorders but not better than BMI [35].
A study of the Inuit populations in Nunavik (Northen Quebec, Canada) using AUC analysis reported an acceptable capacity of BW, BMI, WC, and WHtR to predict hypertension in women and men similar to our study that showed a moderate acceptance in men of the Fulbe and Mbororo indigenous populations and women of the Mbororo indigenous populations [36]. The difference may be explained by the differences in socio-economic status, nutrition and epidemiologic transition and genetics between the indigenous Fulani populations of Africa and the Inuit populations in Canada.
Some studies have suggested WHtR [37,38], some prefer WC [39,40] and WHR [41], others all of them [42] some a combination [43,44] and another concluded that whether singly or in combination discriminating by sex [45], while some suggest no improvement in the prediction of cardiovascular disease risk [6]. For the diverse African populations, the various optimal WC cut off for the identification of cardiometabolic risk by sex have been proposed from ≥ 78 cm to ≥ 80 cm for men and ≥ 82 cm to ≥ 85 cm for women and 96.8 cm for both dysglycaemia and type 2 diabetes for men [46] and 91.8 cm for incident dysglycaemia and 95.8 cm for type 2 diabetes for women [47] and ≥ 81.2 cm for men and ≥ 81.0 cm for women [48]. WC often signify visceral adiposity is as important as the BMI if not more informative in individuals with elevated WC is associated with increased cardiometabolic risk in adults. Independent of sex and age, WC is associated with health outcomes within all BMI categories with the strength of the association between WC and morbidity and/or mortality after adjusting for BMI. When WC and BMI are used as continuous variables in risk prediction models, WC remains as a positive predictor of risk of death, but BMI is not or negatively related to the risk of death [49]. To overcome the limitations of the traditional obesity markers, ABSI combining the weight, height and WC and BRI using height and WC to estimate the percentage of regional and total fat have been developed [50-53]. Studies have shown that ABSI and BRI are associated with abdominal adipose tissue and cardiometabolic risk, onset of type 2 diabetes, premature mortality hazards than BMI and WC [28,29,54-55] and that BRI is even a better predictor of cardiometabolic risk in Southern-Indian adults and Eastern-China adults [30,56]. BRI and WHR have been shown to be a better predictor of CVD risk factors as well as WHtR and WC in assessing hypertension [57]. A meta-analysis reported that BRI and ABSI have a discriminatory power for hypertension with BRI significantly a better predictor of hypertension than ABSI [58].
Similar to a prospective cohort of White European in a UK Biobank study using 11 anthropometric markers, most of the markers were associated with type 2 diabetes differing in the strength of the associations and WHtR showing the strongest association [59]. A meta-analysis of 38 cross-sectional and 2 cohort studies reported slight differences in the AUC of anthropometric indices with indices of abdominal obesity especially WHR better at predicting CVD in adults aged 18 years and above [60]. Using WHO-STEPS survey data anthropometric indices predicting CVD risk varied across countries, with ABSI, BAI, BRI, WHtR, and hip index showing better predictions in South Asians while ABSI, BRI, CI, WHtR, and WHR displayed enhanced predictions in Southeast Asians [61].
Upon stratification by sex, we observed variation in the correlation of the anthropometric measures, area under the ROC curve, MAORs and the strength of the association of anthropometric measures and MetS. Similar to our findings, Evans et al. reported that WC and WHtR performed well in identifying MetS in women [62]. The differences in BW, WC, and HC and the general body fat distribution in women and men may explain the relative performance of the anthropometric measures. Further, the BW, WC, WC, and height are direct measures used to calculate the BMI, WHR, WHtR, Cindex, BAI, BRI, and ABSI. While Cindex is similar to the WHR in being a health indicator, the Cindex formula adjusts for WC for height and BW not requiring HC for body fat distribution [63]. The use of HC in the BAI formula allowed for sex differences in adiposity to be considered when compared to BMI calculation that uses BW and height. BAI had good predictive power in the women of our study and Southern-Indian women and a lower predictive power in men [30]. This may be explained by the lower adiposity in men as compared to women. Sex hormones, sex-specific molecular mechanisms, and gender have been shown to influence pathophysiologic mechanisms through glucose and lipid metabolisms and function leading to cardiometabolic disorders affecting men and women differently [64]. Transition from nomadic to settled life by the indigenous Fulani and non-indigenous populations leads to the adoption of western diets and sedentary behaviours linked to metabolic disorders by the disrupted metabolism of xenobiotics that become toxic to tissues such as the pancreas, heart, kidney, brain and liver. Urbanisation, nutritional and environmental epigenetics may provide an explanation for the spike in the general chronic disease epidemic associated with insulin resistance such as cardiometabolic diseases, non-alcoholic fatty liver disease and neurodegenerative diseases due to the repression of the anti-aging gene Sirtuin 1 with increased risk for MetS [65,66]. The complex interplay between adiposity and cardiometabolic disorders maybe linked to Sirtuin 1 inactivation. The phenotypic differences between men and women in cardiometabolic disorders and the underlying risk factors, determinants and mechanistic processes needs to be elucidated.
Strengths and limitations of the study
Strengths of the study included a response rate of more than 90% for this quantitative population-based study. The study focused on an indigenous population as well as non-indigenous populations. Risks factors are analysed for participants of indigenous Fulani populations from the settled Fulani (Fulbe) and the nomadic pastoral Fulani (Mbororo) and compared with the general population. The study involved risk factor analysis centred on individuals as a preponderant scale in probing epidemiological questions and adequately explaining who is at risk. The area under the ROC curve and multivariable adjusted logistic regression were used to assess the discriminatory capabilities. We standardised the estimates by the use of Z-scores which permitted us to compare the risk magnitude per 1 standard deviation (SD) change. Standardised WHO questionnaires and international guidelines were used for the definition of diabetes, hypertension, classes of overweight and obesity. The study provides baseline data on risk factors of indigenous populations. Trained enumerators conversant with the widely spoken local Fulfulde language administered the questionnaires. Anthropometric measurements such as body weight, height, WC and HC and calculations such as BMI are less likely to have measurement errors [67]. However, evidence suggests measurements in body weight, WC, and HC are prone to higher proportions of errors in obese populations [68] which was less likely in this study as the obesity levels were low. This is a cross-sectional study and limited to examining multiple scale causal mechanisms. Findings should be interpreted with caution and therefore does not allow for causal deductions. Potential bias includes selection bias which may lead to overestimation or underestimation of the true association and introduction of measurement errors which may affect the generalizability of the results. Accurate prediction of disease risk is difficult in specific population subtypes due to complexity of fundamental causes of diseases such as social, environmental drivers and genetic factors and interactions with environments and life course trajectories [69,70]. Some indices may perform better in some populations due to societal and cultural influence on body composition such as body image, traditional cuisine and food availability, social eating practices, physical activity levels, socioeconomic status and acculturation [71].
Conclusions
Anthropometric indices are important risk assessing tools for cardiometabolic disorders. The findings show variation in the discriminatory capabilities of anthropometric measures by ethnicity and sex and the importance of using other indicators apart from the BMI which has the advantage of being simple, easy and cost-effective in resource limited settings. The BW, WC, HC, WHtR, BAI, and BRI in addition to BMI are better in assessing MetS in indigenous as well as non-indigenous African populations. When stratified by sex, WC, and BRI is a better alternative for detecting risk from hypertension and dysglycaemia/hypertension in men of the indigenous Fulbe and Mbororo populations as well as in the women and men of the general population while the BW and BMI may be appropriate to predict dysglycaemia in women of the Fulbe and general populations. WHR, Cindex, and ABSI were the worse anthropometric measures in predicting dysglycaemia, hypertension and dysglycaemia/hypertension in women and men of all groups while ABSI was the worse in detecting MetS in the men all the groups. This study suggests that with transition from nomadic to settled life, indigenous Fulani are at greater risk for MetS than the general populations with women at greater risk for MetS than men. Routine screening of MetS in indigenous populations may use WC, WHtR and BRI. This work is important for the understanding of the pathophysiology of cardiometabolic disorders in African populations, as well as to guide future intervention studies and for public health messaging. With rising overweight and obesity rates, further research such as longitudinal studies to assess the impact of lifestyle changes and genetic studies are needed to develop specific and culturally sensitive interventions in indigenous Fulani as well as non-indigenous populations to understand the complex interplay between adiposity and cardiometabolic disorders.
Competing Interest
The authors have no competing interest to declare.
Authors’ Contributions
JCM and CNK reviewed the article. CNK designed the analytic strategy, analysed the data and wrote the first and subsequent drafts. All authors contributed to the design, data collection and subsequent drafts which were read, reviewed and approved.
Acknowledgments
We acknowledge input of Health of populations in Transition (HoPiT) Research group, The University of Yaoundé 1, Cameroon that participated in data collection and entry and especially research participants. We are grateful to local guides, village champions and chiefs and regional health representatives, district medical officers and local health staff.
Funding
Funding was provided by World Diabetes Foundation project number WDF12-0707 to Health of Populations in Transition (HoPiT) Research Group, Cameroon.
Role of the Funding Partner
The sponsor of the project did not play any role in the study design, data collection, analysis, interpretation and writing of the project report or this article.
Data Availability
Clement Nyuyki Kufe had full access to all the data of the quantitative study, wrote and submitted the article for publication. The data is available upon reasonable time request from Dr Clement Nyuyki Kufe.
References
2. Di Cesare M, Bentham J, Stevens GA, Zhou B, Danaei G, Lu Y, et al. Trends in adult body-mass index in 200 countries from 1975 to 2014: A pooled analysis of 1698 population-based measurement studies with 19.2 million participants. Lancet. 2016;387(10026):1377-96.
3. Kufe NC, Ngufor G, Mbeh G, Mbanya JC. Distribution and patterning of non-communicable disease risk factors in indigenous Mbororo and non-autochthonous populations in Cameroon: cross sectional study. BMC Public Health. 2016 Nov 24;16(1):1188.
4. Nyuyki CK, Ngufor G, Mbeh G, Mbanya JC. Epidemiology of hypertension in Fulani indigenous populations-age, gender and drivers. J Health Popul Nutr. 2017 Nov 10;36(1):35.
5. Ross R, Neeland IJ, Yamashita S, Shai I, Seidell J, Magni P, et al. Waist circumference as a vital sign in clinical practice: a Consensus Statement from the IAS and ICCR Working Group on Visceral Obesity. Nat Rev Endocrinol. 2020 Mar;16(3):177-89.
6. Emerging Risk Factors Collaboration, Wormser D, Kaptoge S, Di Angelantonio E, Wood AM, Pennells L, et al. Separate and combined associations of body-mass index and abdominal adiposity with cardiovascular disease: collaborative analysis of 58 prospective studies. Lancet. 2011 Mar 26;377(9771):1085-95.
7. Bergman RN, Stefanovski D, Buchanan TA, Sumner AE, Reynolds JC, Sebring NG, et al. A better index of body adiposity. Obesity (Silver Spring). 2011 May;19(5):1083-9.
8. A Seeley J, Norris SA, Crowther NJ, Pillay D, Kaleebu P, Motala AA, et al. Deriving an optimal threshold of waist circumference for detecting cardiometabolic risk in sub-Saharan Africa. Int J Obes (Lond). 2017 Oct 3;42(3):487–94.
9. Haregu TN, Oti S, Egondi T, Kyobutungi C. Measurement of overweight and obesity an urban slum setting in sub-Saharan Africa: a comparison of four anthropometric indices. BMC Obes. 2016 Nov 8;3:46.
10. Crowther NJ, Norris SA. The current waist circumference cut point used for the diagnosis of metabolic syndrome in sub-Saharan African women is not appropriate. PLoS One. 2012;7(11):e48883.
11. Damaris ME. Comparison and Concordance of Two Metabolic Syndrome Definitions in Cameroon. ARCHIVOS DE MEDICINA. 2016;1(2):10.
12. WHO. Obesity: preventing and managing the global epidemic. Report of a WHO consultation. World Health Organ Tech Rep Ser. 2000;894:i-xii, 1-253.
13. Consultation WE. Waist circumference and waist-hip ratio. Report of a WHO Expert Consultation. Geneva: World Health Organization. 2008 Dec;2008:8-11.
14. Browning LM, Hsieh SD, Ashwell M. A systematic review of waist-to-height ratio as a screening tool for the prediction of cardiovascular disease and diabetes: 05 could be a suitable global boundary value. Nutr Res Rev. 2010;23(2):247–69.
15. Shen S, Lu Y, Qi H, Li F, Shen Z, Wu L, et al. Waist-to-height ratio is an effective indicator for comprehensive cardiovascular health. Sci Rep. 2017 Feb 21;7:43046.
16. Valdez R, Seidell JC, Ahn YI, Weiss KM. A new index of abdominal adiposity as an indicator of risk for cardiovascular disease. A cross-population study. Int J Obes Relat Metab Disord. 1993 Feb;17(2):77-82.
17. Pitanga F. Antropometry for the assessment of abdominal obesity and coronary risk. Rev Bras Cineantropometria e Desempenho Hum. 2011;13(3):238-41.
18. Bergman RN, Stefanovski D, Buchanan TA, Sumner AE, Reynolds JC, Sebring NG, et al. A better index of body adiposity. Obesity. 2011 May;19(5):1083-9.
19. Thomas DM, Bredlau C, Bosy‐Westphal A, Mueller M, Shen W, Gallagher D, et al. Relationships between body roundness with body fat and visceral adipose tissue emerging from a new geometrical model. Obesity. 2013 Nov;21(11):2264-71.
20. Krakauer NY, Krakauer JC. A new body shape index predicts mortality hazard independently of body mass index. PloS One. 2012 Jul 18;7(7):e39504.
21. HemoCue. HemoCue, Inc. Hb 201 + Operating Manual Manuel d’utilisation. 2017.
22. IDF, World Health Organization. Definition and diagnosis of diabetes mellitus and intermediate hyperglycaemia: report of a WHO/IDF consultation. IDF. 2006
23. Grundy SM, Cleeman JI, Daniels SR, Donato KA, Eckel RH, Franklin BA, et al. Diagnosis and management of the metabolic syndrome: an American Heart Association/National Heart, Lung, and Blood Institute scientific statement. Circulation. 2005 Oct 25;112(17):2735-52.
24. Armitage P, Berry G, Matthews JNS. Statistical Methods in Medical Research. Oxford, UK: Blackwell Science Ltd; 2002.
25. Rosner BA. Fundamentals of biostatistics. Belmont, CA: Thomson-Brooks/Cole; 2006.
26. Hosmer DW, Lemeshow S. Applied Logistic Regression.2nd ed. New York, NY: John Wiley and Sons, 2000. Pp. 160–164.
27. Mandrekar JN. Receiver operating characteristic curve in diagnostic test assessment. Journal of Thoracic Oncology. 2010 Sep 1;5(9):1315-6.
28. Zhang ZQ, Deng J, He LP, Ling WH, Su YX, Chen YM. Comparison of various anthropometric and body fat indices in identifying cardiometabolic disturbances in Chinese men and women. PloS One. 2013 Aug 12;8(8):e70893.
29. Gu Z, Li D, He H, Wang J, Hu X, Zhang P, et al. Body mass index, waist circumference, and waist-to-height ratio for prediction of multiple metabolic risk factors in Chinese elderly population. Scientific Reports. 2018 Jan 10;8(1):385.
30. Endukuru CK, Gaur GS, Dhanalakshmi Y, Sahoo J, Vairappan B. Cut-off values and clinical efficacy of body roundness index and other novel anthropometric indices in identifying metabolic syndrome and its components among Southern-Indian adults. Diabetology International. 2022 Jan;13:188-200.
31. Głuszek S, Ciesla E, Głuszek-Osuch M, Kozieł D, Kiebzak W, Wypchło Ł, et al. Anthropometric indices and cut-off points in the diagnosis of metabolic disorders. PLoS One. 2020 Jun 22;15(6):e0235121.
32. Chua EY, Zalilah MS, Haemamalar K, Norhasmah S, Geeta A. Obesity indices predict hypertension among indigenous adults in Krau Wildlife Reserve, Peninsular Malaysia. Journal of Health, Population and Nutrition. 2017 Dec;36:24.
33. Luz RH, Barbosa AR, d'Orsi E. Waist circumference, body mass index and waist-height ratio: Are two indices better than one for identifying hypertension risk in older adults?. Preventive Medicine. 2016 Dec 1;93:76-81.
34. Mooney SJ, Baecker A, Rundle AG. Comparison of anthropometric and body composition measures as predictors of components of the metabolic syndrome in a clinical setting. Obesity Research & Clinical Practice. 2013 Jan 1;7(1):e55-66.
35. Lam BC, Koh GC, Chen C, Wong MT, Fallows SJ. Comparison of body mass index (BMI), body adiposity index (BAI), waist circumference (WC), waist-to-hip ratio (WHR) and waist-to-height ratio (WHtR) as predictors of cardiovascular disease risk factors in an adult population in Singapore. PloS One. 2015 Apr 16;10(4):e0122985.
36. Lajeunesse-Trempe F, Piché ME, Poirier P, Tchernof A, Ayotte P. Adiposity Phenotypes and Associated Cardiometabolic Risk Profile in the Inuit Population of Nunavik. Nutrients. 2024 Mar 2;16(5):725.
37. Peer N, Lombard C, Steyn K, Levitt N. Waist-to-height ratio is a useful indicator of cardio-metabolic risk in South Africa. Fam Pract. 2020 Feb 19;37(1):36-42.
38. Amirabdollahian F, Haghighatdoost F. Anthropometric Indicators of Adiposity Related to Body Weight and Body Shape as Cardiometabolic Risk Predictors in British Young Adults: Superiority of Waist-to-Height Ratio. J Obes. 2018 Nov 1;2018:8370304.
39. Goedecke JH, Nguyen KA, Kufe C, Masemola M, Chikowore T, Mendham AE, et al. Waist circumference thresholds predicting incident dysglycaemia and type 2 diabetes in Black African men and women. Diabetes Obes Metab. 2022 May;24(5):918-27.
40. Peer N, Steyn K, Levitt N. Differential obesity indices identify the metabolic syndrome in Black men and women in Cape Town: the CRIBSA study. J Public Health (Oxf). 2016 Mar;38(1):175-82.
41. Murphy GA, Asiki G, Nsubuga RN, Young EH, Seeley J, Sandhu MS, et al. The use of anthropometric measures for cardiometabolic risk identification in a rural African population. Diabetes Care. 2014 Apr;37(4):e64-5.
42. Sekgala MD, Sewpaul R, Opperman M, Mchiza ZJ. Comparison of the Ability of Anthropometric Indices to Predict the Risk of Diabetes Mellitus in South African Males: SANHANES-1. Int J Environ Res Public Health. 2022 Mar 9;19(6):3224.
43. Wannamethee SG, Shaper AG, Morris RW, Whincup PH. Measures of adiposity in the identification of metabolic abnormalities in elderly men. The American Journal of Clinical Nutrition. 2005 Jun 1;81(6):1313-21.
44. Feng RN, Zhao C, Wang C, Niu YC, Li K, Guo FC, et al. BMI is strongly associated with hypertension, and waist circumference is strongly associated with type 2 diabetes and dyslipidemia, in northern Chinese adults. J Epidemiol. 2012;22(4):317-23.
45. Luz RH, Barbosa AR, d'Orsi E. Waist circumference, body mass index and waist-height ratio: Are two indices better than one for identifying hypertension risk in older adults?. Preventive Medicine. 2016 Dec 1;93:76-81.
46. Murphy GA, Asiki G, Nsubuga RN, Young EH, Seeley J, Sandhu MS, et al. The use of anthropometric measures for cardiometabolic risk identification in a rural African population. Diabetes Care. 2014 Apr;37(4):e64-5.
47. Goedecke JH, Nguyen KA, Kufe C, Masemola M, Chikowore T, Mendham AE, et al. Waist circumference thresholds predicting incident dysglycaemia and type 2 diabetes in Black African men and women. Diabetes Obes Metab. 2022 May;24(5):918-927.
48. Ekoru K, Murphy GAV, Young EH, Delisle H, Jerome CS, Assah F, et al. Deriving an optimal threshold of waist circumference for detecting cardiometabolic risk in sub-Saharan Africa. Int J Obes (Lond). 2017 Oct 3;42(3):487–94.
49. Ross R, Neeland IJ, Yamashita S, Shai I, Seidell J, Magni P, et al. Waist circumference as a vital sign in clinical practice: a Consensus Statement from the IAS and ICCR Working Group on Visceral Obesity. Nat Rev Endocrinol. 2020 Mar;16(3):177-89.
50. Zhao Q, Zhang K, Li Y, Zhen Q, Shi J, Yu Y, et al. Capacity of a body shape index and body roundness index to identify diabetes mellitus in Han Chinese people in Northeast China: a cross-sectional study. Diabet Med. 2018 Nov;35(11):1580-7.
51. Christakoudi S, Tsilidis KK, Muller DC, Freisling H, Weiderpass E, Overvad K, et al. A Body Shape Index (ABSI) achieves better mortality risk stratification than alternative indices of abdominal obesity: results from a large European cohort. Sci Rep. 2020 Sep 3;10(1):14541.
52. Rico-Martín S, Calderón-García JF, Sánchez-Rey P, Franco-Antonio C, Martínez Alvarez M, Sánchez Muñoz-Torrero JF. Effectiveness of body roundness index in predicting metabolic syndrome: A systematic review and meta-analysis. Obes Rev. 2020 Jul;21(7):e13023.
53. Suliga E, Ciesla E, Głuszek-Osuch M, Rogula T, Głuszek S, Kozieł D. The Usefulness of Anthropometric Indices to Identify the Risk of Metabolic Syndrome. Nutrients. 2019 Oct 29;11(11):2598.
54. Chang Y, Guo X, Li T, Li S, Guo J SY. A Body Shape Index and Body Roundness Index: Two New Body Indices to Identify left Ventricular Hypertrophy among Rural Populations in Northeast China. Hear Lung Circ. 2016;25(4):358-64.
55. Zhang N, Chang Y, Guo X, Chen Y, Ye N, Sun Y. A Body Shape Index and Body Roundness Index: Two new body indices for detecting association between obesity and hyperuricemia in rural area of China. Eur J Intern Med. 2016 Apr;29:32-6.
56. Xu J, Zhang L, Wu Q, Zhou Y, Jin Z, Li Z, et al. Body roundness index is a superior indicator to associate with the cardio-metabolic risk: evidence from a cross-sectional study with 17,000 Eastern-China adults. BMC Cardiovasc Disord. 2021 Feb 16;21(1):97.
57. Li Y, He Y, Yang L, Liu Q, Li C, Wang Y, et al. Body Roundness Index and Waist-Hip Ratio Result in Better Cardiovascular Disease Risk Stratification: Results From a Large Chinese Cross-Sectional Study. Front Nutr. 2022 Mar 10;9:801582.
58. Calderón-García JF, Roncero-Martín R, Rico-Martín S, De Nicolás-Jiménez JM, López-Espuela F, Santano-Mogena E, et al. Effectiveness of Body Roundness Index (BRI) and a Body Shape Index (ABSI) in Predicting Hypertension: A Systematic Review and Meta-Analysis of Observational Studies. Int J Environ Res Public Health. 2021 Nov 4;18(21):11607.
59. Boonpor J, Parra-Soto S, Talebi A, Zhou Z, Carrasco-Marin F, Petermann-Rocha F, et al. Associations and predictive performance of 11 anthropometric measures with incident type 2 diabetes: A prospective cohort study from the UK Biobank. Obesity (Silver Spring). 2023 Oct;31(10):2648-57.
60. Darbandi M, Pasdar Y, Moradi S, Mohamed HJJ, Hamzeh B, Salimi Y. Discriminatory Capacity of Anthropometric Indices for Cardiovascular Disease in Adults: A Systematic Review and Meta-Analysis. Prev Chronic Dis. 2020 Oct 22;17:E131.
61. Islam MT, Chowdhury AT, Siraj MS, Md Abdullah AY, Mazumder T, Trask M, et al. Anthropometric indices in predicting 10-year cardiovascular risk among males and females aged 40-74 years in south and southeast Asia: analysis of 12 WHO STEPS survey data. Lancet Reg Health Southeast Asia. 2024 Sep 12; 29:100481.
62. Evans J, Micklesfield L, Jennings C, Levitt NS, Lambert EV, Olsson T, et al. Diagnostic ability of obesity measures to identify metabolic risk factors in South African women. Metab Syndr Relat Disord. 2011 Oct;9(5):353-60.
63. Shidfar F, Alborzi F, Salehi M, Nojomi M. Association of waist circumference, body mass index and conicity index with cardiovascular risk factors in postmenopausal women. Cardiovasc J Afr. 2012 Sep;23(8):442-5.
64. Gerdts E, Regitz-Zagrosek V. Sex differences in cardiometabolic disorders. Nat Med. 2019 Nov;25(11):1657-66.
65. Martins I. Increased Risk for Obesity and Diabetes with Neurodegeneration in Developing Countries. Top 10 Contribution on Genetics. In Increased Risk for Obesity and Diabetes with Neurodegeneration in Developing Countries. Top 10 Contribution on Genetics. Avid Science; 2018. p. 1-35.
66. Martins IJ. Anti-Aging Genes Improve Appetite Regulation and Reverse Cell Senescence and Apoptosis in Global Populations. Advances in Aging Research. 2016;5:9-26.
67. Sebo P, Haller D, Pechère-Bertschi A, Bovier P, Herrmann F. Accuracy of doctors' anthropometric measurements in general practice. Swiss Med Wkly. 2015 Feb 21;145:w14115.
68. Sebo P, Herrmann FR, Haller DM. Accuracy of anthropometric measurements by general practitioners in overweight and obese patients. BMC Obes. 2017 Jun 29;4:23.
69. Song M, Zheng Y, Qi L, Hu FB, Chan AT, Giovannucci EL. Associations between genetic variants associated with body mass index and trajectories of body fatness across the life course: a longitudinal analysis. Int J Epidemiol. 2018 Apr 1;47(2):506-15.
70. Power C, Kuh D, Morton S. From developmental origins of adult disease to life course research on adult disease and aging: insights from birth cohort studies. Annu Rev Public Health. 2013;34:7-28.
71. Lee A, Cardel M, Donahoo WT. Social and environmental factors influencing obesity. In: Feingold KR, Anawalt B, Blackman MR, Boyce A, Chrousos G, Corpas E, et al., Eds. Endotext [Internet]. South Dartmouth (MA): MDText.com, Inc.; 2000-.