Abstract
Objective: To investigate the impact of changes in physical activity from young adulthood (ages 20–35 years) to middle age (ages ≥35 years) on the prevalence of obesity, insulin resistance, and diabetes.
Research design and methods: Data were analyzed from 1,395 participants in the Midlife in the United States (MIDUS) study, including biomarker subsamples. Participants reported their physical activity levels during young adulthood and currently (≥ 20 min, three times per week). Participants were categorized as persistently active, increased, decreased, or persistently inactive. Obesity was defined as body mass index (BMI) ≥ 30 kg/m², insulin resistance by HOMA-IR ≥ 2.8, and diabetes by self-reported diagnosis. Multivariable logistic regression was used to assess associations.
Results: Participants with decreased or persistently low physical activity levels were significantly more likely to have obesity (OR 2.29 and OR 2.03, respectively), insulin resistance (OR 1.88 and OR 1.79, respectively), and diabetes (OR 1.79 and OR 1.73, respectively) compared to persistently active subjects. After adjusting for covariates, including age, income, and alcohol consumption, increased activity did not exhibit a significant protective effect compared to persistent activity.
Conclusions: A decline in physical activity after the age of 35 years is associated with higher risks of obesity, insulin resistance, and diabetes. Health promotion programs targeting the maintenance of regular physical activity in adulthood may reduce these risks. Further longitudinal studies are needed to confirm these findings and address limitations, including sample diversity and missing data.
Keywords
Diabetes, Exercise, Insulin resistance, Obesity, Physical activity
Introduction
Obesity and diabetes are critical health concerns in the United States. Since the 1980s, obesity prevalence has steadily increased. According to National Health and Nutrition Examination Survey (NHANES) data, the age-standardized prevalence of obesity in adults rose from 33.7% in 2007–2008 to 39.6% in 2015–2016 [1]. Notably, this increase was significant in adults aged 40 years and those ≥60 years. Diabetes prevalence has also increased, with total diabetes prevalence (diagnosed and undiagnosed) affecting 14% of the United States adult population in 2010, and this percentage is projected to rise to 21%–33% by 2050.
Physical activity has benefits that may help prevent chronic diseases such as obesity and diabetes [2]. Regular exercise is critical for maintaining a healthy and normal body weight. All healthy adults aged 18–65 years are recommended to engage in moderate-intensity aerobic (endurance) physical activity for at least 30 min daily, 5 days per week, or vigorous-intensity aerobic physical activity for at least 20 min daily, 3 days per week [3]. A systematic review showed that physical activity lowered type 2 diabetes incidence by 26% and cardiovascular disease mortality by 23% [4].
Physical activity often varies along with life stages. Age-related decline in physical activity throughout adolescence has been well documented [5] Micklesfield et al. reported that the large majority of males (72%) and females (85%) experienced decreased physical activity during adolescence [6], which may pose health risks later in life. Reduction in physical fitness from childhood to adulthood has been linked to greater body adiposity [7], abdominal obesity [8], and insulin resistance [9] in young adulthood. However, data on how changes in physical activity from young adulthood to middle age impact obesity, insulin resistance, and diabetes are limited.
Therefore, this study aimed to investigate changes in physical activity levels from young adulthood (aged 20–35 years) to middle age (aged ≥35 years) using a large dataset and examine its relationship with obesity, insulin resistance, and diabetes.
Methods
Data and study population
This study is a cross-sectional analysis based on secondary data from the Midlife in the United States (MIDUS) study. The sample was drawn from the second wave of the National Survey of Midlife in the United States (MIDUS 2) and the MIDUS refresher, an expansion of the MIDUS project. The MIDUS [10] project, started in 1995, is a collaborative, interdisciplinary survey on physical health, psychological well-being, and social responsibility during midlife. The baseline sample included 7,108 non-institutionalized, English-speaking adults aged 25–74 years from the United States, collected through random-digit dialing. Data were gathered via phone interviews and self-administered questionnaires.
The MIDUS 2 [11] (2004–2006) was the first longitudinal follow-up of MIDUS 1, whereas the MIDUS refresher [12] is a sample expansion of the MIDUS project. The Biomarker Project of each wave aimed to collect comprehensive biological assessments of a subsample of MIDUS respondents, thus facilitating analyses that integrated behavioral and psychosocial factors with biological regulation. The biomarker project included data from blood specimens, self-administered questionnaires, and physical examinations. In this study, the MIDUS 2 biomarker project [13] and MIDUS refresher biomarker project [14] data were used for analysis. The inclusion criteria were those aged ≥ 35 years who answered the following two questions about physical activity in the self-administered questionnaires.
- Between ages 20–35 years, how many years did you participate in regular moderate-level physical activity?
Moderate-level physical activity is defined here as activity that causes your heart rate to increase slightly and typically makes you work up a sweat (e.g., leisurely sports like light tennis, slow or light swimming, low-intensity aerobics, golfing without a power cart, brisk walking, or mowing the lawn with a walking lawnmower). - Do you currently engage in regular exercise or activity of any type for ≥ 20 min at least three times a week?
Here, "regular exercise or activity" refers to activities requiring at least light-level physical effort, such as light housekeeping like dusting or laundry, and including activities like bowling, archery, easy walking, golfing with a power cart, or fishing.
In the MIDUS 2 (n = 1,255) and MIDUS refresher biomarker projects (n=863), 537 and 160 participants, respectively had missing responses to the questions above. The final sample included 1,395 participants (Figure 1).
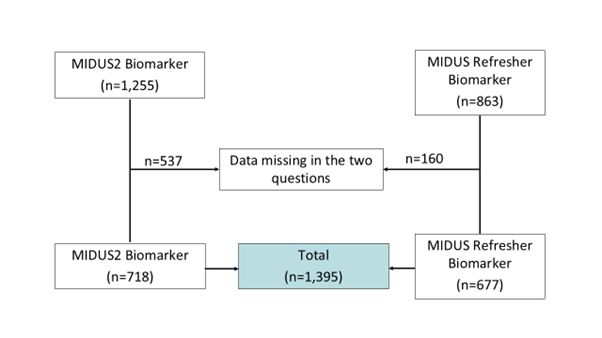
Figure 1. Participant flow diagram showing data availability in the MIDUS2 and MIDUS Refresher Biomarker datasets.
Outcome variables
Obesity: Body mass index (BMI) was calculated as a participant's weight in kilograms (kg) divided by height in meter squared (m2). Obesity was defined as a BMI ≥ 30 kg/m2.
Insulin resistance: Insulin resistance was estimated using a homeostatic model assessment for insulin resistance (HOMA-IR). HOMA-IR was calculated using the following formula: fasting insulin (mU/L) × fasting glucose (nmol/L) / 22.5. Insulin resistance was defined as HOMA-IR ≥ 2.8 [15].
Diabetes: Diabetes was characterized by recording the response of “Yes” to the question “In the past 12 months, have you experienced or been treated for any of the following - DIABETES OR HIGH BLOOD SUGAR?”
Predictor variable
Physical activity change: The participants were categorized into four groups: persistently active, increased, decreased, and persistently inactive. The four categories were defined based on physical activity levels from ages 20–35 years and current physical activity. The definitions of changes in physical activity are shown in Table 1. For example, participants who had engaged in moderate-level physical activity for 15 years at ages 20–35 years and were currently active were categorized into the persistently active group.
|
Categories in physical activity change |
Aged 20–35, the number of years participated in regular physical activity at a moderate level? |
Do you engage in regular exercise or activity of any type for 20 min or more at least three times/week? |
|
Persistently active |
11–15 years |
Yes |
|
Increased |
0–10 years |
Yes |
|
Decreased |
11–15 years |
No |
|
Persistently inactive |
0–10 years |
No |
Covariates
Covariates included age, sex, race/ethnicity (White, Black, Asian, or other), marital status (married, separated, divorced, widowed, or never married), education (high school or lower, some college, bachelor’s degree, or graduate degree), income (US$75K; per year), and alcohol consumption. Alcohol consumption was assessed using the following question: “During the past month, how often did you drink alcoholic beverages on average? Would you say every day, five or six days a week, three or four days a week, one or two days a week, or less than one day a week?”
Statistical analysis
Descriptive characteristics were presented as means and standard deviations for continuous variables and frequencies and percentages for categorical variables. We assessed associations of obesity, insulin resistance, and diabetes with the predictor variable and covariates using chi-square tests for categorical variables and Student's t-tests for continuous variables. Variables with p-values <0.20 in univariate analyses were entered into the multivariable logistic regression model. The significance threshold was set at 0.05. All statistical analyses were performed using R (version 4.0.3).
Patient and public involvement statement
This study represents a secondary data analysis from the Midlife in the United States (MIDUS) study. Given this approach, patients and the public were not directly involved in the design or implementation of our research. However, our findings aim to contribute to public health improvements by highlighting how changes in physical activity levels affect obesity, insulin resistance, and diabetes risk. These insights may help shape more effective health promotion strategies for the general population.
Results
Demographic data for all measures are presented in Table 2. The mean age of the participants was 55.8 years, and 45.1% were male. Most participants were white (87.9%), with a small percentage of ethnic minorities. Obesity, insulin resistance, and diabetes rates were 59.9%, 47.0%, and 13.2%, respectively. Of the participants, 44.5% reported engaging in moderate-level physical activity for 11–15 years between ages 20 and 35, and 77.9% currently engage in regular exercise for at least 20 min three times per week. The percentages of changes in physical activity across the categories persistently active, increased, decreased, and persistently inactive were 36.9%, 41.0%, 12.5%, and 9.5%, respectively.
|
Variables |
Mean ± SD or frequency (%) |
|
|
Age (years) |
55.8 |
±11.3 |
|
Sex |
|
|
|
Male |
596 |
(45.1) |
|
Female |
727 |
(54.9) |
|
Race/ethnicity |
|
|
|
White |
1,021 |
(87.9) |
|
Black |
55 |
(4.7) |
|
Asian |
7 |
(0.6) |
|
Others |
78 |
(0.7) |
|
Marital status |
|
|
|
Married |
814 |
(58.4) |
|
Separated, divorced, or widowed |
234 |
(16.8) |
|
Never married |
114 |
(8.2) |
|
Missing |
233 |
(16.7) |
|
Education |
|
|
|
High school or lower |
422 |
(30.3) |
|
Some college |
415 |
(29.7) |
|
Bachelor |
325 |
(23.3) |
|
Graduate |
233 |
(16.7) |
|
Income |
|
|
|
|
469 |
(33.6) |
|
US$ 25K–US$ 75K |
396 |
(28.4) |
|
>US $75K |
188 |
(13.5) |
|
Missing |
342 |
(24.5) |
|
Alcohol consumption |
|
|
|
<1 day/week |
319 |
(22.9) |
|
1–4 days/week |
289 |
(20.7) |
|
5–7 days/week |
168 |
(12.0) |
|
Missing |
619 |
(44.5) |
|
Obesity |
|
|
|
Yes |
600 |
(56.9) |
|
No |
795 |
(43.1) |
|
Insulin resistance |
|
|
|
HOMA-IR >2.8 |
656 |
(47.0) |
|
HOMA-IR <2.8 |
726 |
(52.0) |
|
Missing |
13 |
(0.9) |
|
Diabetes |
|
|
|
Yes |
184 |
(13.2) |
|
No |
1,211 |
(86.8) |
|
Physical activity (ages 20–35 years) |
|
|
|
11–15 years |
621 |
(44.5) |
|
0–10 years |
774 |
(55.5) |
|
Physical activity (current) |
|
|
|
Yes |
1,087 |
(77.9) |
|
No |
308 |
(22.1) |
|
Physical activity change |
|
|
|
Persistently active |
515 |
(36.9) |
|
Increased |
572 |
(41.0) |
|
Decreased |
175 |
(12.5) |
|
Persistently inactive |
133 |
(9.5) |
Table 3 shows the results of univariate analysis for obesity. The proportion of participants with obesity was higher in the decreased activity and persistently inactive groups than in the persistently active and increased activity groups. Age, race/ethnicity, education, income, alcohol consumption, and physical activity change were statistically significantly associated with obesity. Logistic regression (Table 6) revealed that the decreased activity and persistently inactive group had a higher obesity risk than the persistently active group (decreased group: odds ratio (OR) 2.29 [95% confidence interval (CI): 1.52–3.46], p<0.001; persistently inactive group: OR 2.03 [95% CI: 1.29–3.20], p=0.002).
|
Variables |
non-Obesity |
Obesity |
p-value |
||
|
Age (years) |
56.1 |
±11.7 |
55.4 |
±10.9 |
0.009 |
|
Sex |
0.481 |
||||
|
Male |
339 |
(56.9) |
257 |
(43.1) |
|
|
Female |
428 |
(59.0) |
298 |
(41.0) |
|
|
Race/ethnicity |
<0.001 |
||||
|
White |
623 |
(61.1) |
397 |
(38.9) |
|
|
Black |
19 |
(34.5) |
36 |
(65.5) |
|
|
Asian |
7 |
(100) |
0 |
(0.0) |
|
|
Others |
45 |
(57.7) |
33 |
(42.3) |
|
|
Marital status |
0.28 |
||||
|
Married |
497 |
(61.1) |
317 |
(38.9) |
|
|
Separated, divorced, widowed |
135 |
(57.7) |
99 |
(42.3) |
|
|
Never married |
61 |
(54.0) |
52 |
(46.0) |
|
|
Education |
<0.001 |
||||
|
High school or lower |
228 |
(54.0) |
194 |
(46.0) |
|
|
Some college |
260 |
(62.8) |
154 |
(37.2) |
|
|
Bachelor |
205 |
(63.1) |
120 |
(36.9) |
|
|
Graduate |
101 |
(43.3) |
132 |
(56.7) |
|
|
Income ($) |
<0.001 |
||||
|
<25K |
277 |
(59.1) |
192 |
(40.9) |
|
|
25-75K |
234 |
(59.2) |
161 |
(40.8) |
|
|
75K< |
121 |
(64.4) |
67 |
(35.6) |
|
|
Missing |
162 |
(47.4) |
180 |
(52.6) |
|
|
Alcohol consumption |
<0.001 |
||||
|
< 1 day/week |
181 |
(56.7) |
138 |
(43.3) |
|
|
1-4 days/week |
173 |
(60.1) |
115 |
(39.9) |
|
|
5-7 days/week |
125 |
(74.4) |
43 |
(25.6) |
|
|
Missing |
315 |
(50.9) |
304 |
(49.1) |
|
|
Physical activity (20-35yo) |
0.018 |
||||
|
10 years or less |
418 |
(54.1) |
355 |
(45.9) |
|
|
more than 10 years |
376 |
(60.5) |
245 |
(39.5) |
|
|
Physical activity (current) |
<0.001 |
||||
|
Yes |
657 |
(60.5) |
429 |
(39.5) |
|
|
No |
137 |
(44.5) |
171 |
(55.5) |
|
|
Physical activity change |
<0.001 |
||||
|
Persistently active |
329 |
(63.9) |
186 |
(36.1) |
|
|
Increased |
328 |
(57.4) |
243 |
(42.6) |
|
|
Decreased |
75 |
(42.9) |
100 |
(57.1) |
|
|
Persistently inactive |
62 |
(46.6) |
71 |
(53.4) |
|
|
Mean ± SD or Frequency (%) |
|||||
Table 4 shows that insulin resistance was more prevalent in the decreased and persistently inactive groups than in the persistently active and increased groups. All variables except marital status were significantly associated with insulin resistance. After adjusting for the significant predictors (Table 6), insulin resistance risk was higher in the decreased and persistently inactive groups compared to the persistently active group (decreased group: OR 1.88 [95% CI: 1.23–2.88], p=0.004; persistently inactive group: OR 1.79 [95% CI: 1.13–2.50], p=0.013).
|
Variables |
Insulin Resistance |
p-value |
|||
|
No |
Yes |
||||
|
Age |
55.2 |
±11.5 |
56.4 |
±11.1 |
0.007 |
|
Sex |
<0.001 |
||||
|
Male |
277 |
(46.7) |
316 |
(53.3) |
|
|
Female |
426 |
(39.1) |
295 |
(40.9) |
|
|
Race/ethnicity |
0.007 |
||||
|
White |
568 |
(56.0) |
446 |
(44.0) |
|
|
Black |
18 |
(33.3) |
36 |
(66.7) |
|
|
Asian |
5 |
(71.4) |
2 |
(28.6) |
|
|
Others |
39 |
(50.0) |
39 |
(50.0) |
|
|
Marital status |
0.723 |
||||
|
Married |
438 |
(54.0) |
373 |
(46.0) |
|
|
Separated, divorced, widowed |
131 |
(57.0) |
99 |
(43.0) |
|
|
Never married |
61 |
(54.0) |
52 |
(46.0) |
|
|
Education |
<0.001 |
||||
|
High school or lower |
200 |
(47.8) |
218 |
(52.2) |
|
|
Some college |
235 |
(57.0) |
177 |
(43.0) |
|
|
Bachelor |
193 |
(59.6) |
131 |
(40.4) |
|
|
Graduate |
98 |
(43.0) |
130 |
(57.0) |
|
|
Income ($) |
<0.001 |
||||
|
<25K |
238 |
(51.0) |
229 |
(49.0) |
|
|
25-75K |
220 |
(55.8) |
174 |
(44.2) |
|
|
75K< |
119 |
(64.0) |
67 |
(36.0) |
|
|
Missing |
149 |
(44.5) |
186 |
(55.5) |
|
|
Alcohol consumption |
<0.001 |
||||
|
< 1day/week |
179 |
(56.5) |
138 |
(43.5) |
|
|
1-4days/week |
155 |
(54.6) |
129 |
(45.4) |
|
|
5-7days/week |
111 |
(66.5) |
56 |
(33.5) |
|
|
Missing |
281 |
(45.8) |
333 |
(54.2) |
|
|
Physical activity change |
<0.001 |
||||
|
Persistently active |
292 |
(57.0) |
220 |
(43.0) |
|
|
Increased |
308 |
(54.3) |
259 |
(45.7) |
|
|
Decreased |
66 |
(38.6) |
105 |
(61.4) |
|
|
Persistently inactive |
60 |
(45.5) |
72 |
(54.5) |
|
Table 5 shows that the decreased activity and persistently inactive group had a higher percentage of diabetes patients than the persistently active and increased group. Age, race/ethnicity, education, income, alcohol consumption, and changes in physical activity were statistically significant in univariate analysis. Table 6 shows that the decreased and persistently inactive groups had a higher diabetes risk than the persistently active group (decreased activity group: OR 1.79 [95% CI: 1.18–2.72], p=0.006; persistently inactive group: OR 1.73 [95% CI: 1.10–2.72], p=0.018).
|
Variables |
non-Diabetes |
Diabetes |
p-value |
||
|
Age |
55.3 |
±11.3 |
59.1 |
±11.0 |
0.021 |
|
Sex |
0.570 |
||||
|
Male |
516 |
(86.7) |
79 |
(13.3) |
|
|
Female |
639 |
(87.9) |
88 |
(12.1) |
|
|
Race/ethnicity |
<0.001 |
||||
|
White |
920 |
(90.2) |
100 |
(9.8) |
|
|
Black |
40 |
(72.7) |
15 |
(27.3) |
|
|
Asian |
5 |
(71.4) |
2 |
(28.6) |
|
|
Others |
69 |
(88.5) |
9 |
(11.5) |
|
|
Marital status |
0.771 |
||||
|
Married |
723 |
(88.9) |
90 |
(11.1) |
|
|
Separated, divorced, widowed |
211 |
(90.2) |
23 |
(9.8) |
|
|
Never married |
100 |
(87.7) |
14 |
(12.3) |
|
|
Education |
<0.001 |
||||
|
High school or lower |
362 |
(85.8) |
60 |
(14.2) |
|
|
Some college |
376 |
(90.6) |
39 |
(9.4) |
|
|
Bachelor |
296 |
(91.4) |
28 |
(8.6) |
|
|
Graduate |
177 |
(76.0) |
56 |
(24.0) |
|
|
Income ($) |
<0.001 |
||||
|
<25K |
401 |
(85.5) |
68 |
(14.5) |
|
|
25-75K |
366 |
(92.4) |
30 |
(7.6) |
|
|
75K< |
173 |
(92.5) |
14 |
(7.5) |
|
|
Missing |
271 |
(79.2) |
71 |
(20.8) |
|
|
Alcohol consumption |
<0.001 |
||||
|
< 1day/week |
284 |
(89.0) |
35 |
(11.0) |
|
|
1-4days/week |
270 |
(93.4) |
19 |
(6.6) |
|
|
5-7days/week |
159 |
(94.6) |
9 |
(5.4) |
|
|
Missing |
498 |
(80.6) |
120 |
(19.4) |
|
|
Physical activity change |
<0.001 |
||||
|
Persistently active |
463 |
(90.1) |
51 |
(9.9) |
|
|
Increased |
505 |
(88.3) |
67 |
(11.7) |
|
|
Decreased |
131 |
(74.9) |
44 |
(25.1) |
|
|
Persistently inactive |
122 |
(84.2) |
21 |
(15.8) |
|
|
Variables |
Obesity |
Insulin resistance |
Diabetes |
||||||
|
|
OR |
(95%CI) |
p |
OR |
(95%CI) |
p |
OR |
(95%CI) |
p |
|
Age |
1.00 |
(0.99–1.01) |
0.963 |
1.00 |
(0.99–1.02) |
0.397 |
1.01 |
(1.00–1.02) |
0.083 |
|
Sex (female vs. male) |
|
|
|
0.40 |
(0.31–0.53) |
<0.001 |
|
|
|
|
Race/ethnicity |
|
|
|
|
|
|
|
|
|
|
Black vs. White |
2.81 |
(1.58–5.12) |
<0.001 |
2.75 |
(1.53–5.10) |
<0.001 |
2.29 |
(1.28–4.21) |
0.006 |
|
Asian vs. White |
0.00 |
(0.00–0.00) |
0.978 |
0.56 |
(0.08–2.82) |
0.510 |
0.58 |
(0.08–2.80) |
0.522 |
|
Others vs. White |
1.06 |
(0.65–1.70) |
0.824 |
1.21 |
(0.75–1.97) |
0.436 |
1.18 |
(0.73–1.91) |
0.490 |
|
Education |
|
|
|
|
|
|
|
|
|
|
Some college vs. ≤HG |
0.73 |
(0.55–0.98) |
0.035 |
0.73 |
(0.55–0.98) |
0.037 |
0.77 |
(0.58–1.02) |
0.068 |
|
Bachelor vs. ≤HG |
0.81 |
(0.59–1.12) |
0.200 |
0.77 |
(0.55–1.06) |
0.106 |
0.77 |
(0.56–1.05) |
0.104 |
|
Graduate vs. ≤HG |
0.00 |
(0.00–0.00) |
0.988 |
0.00 |
(0.00–0.00) |
0.972 |
0.00 |
(0.00–0.00) |
0.971 |
|
Income |
|
|
|
|
|
|
|
|
|
|
US$ 25–US$ 75K vs. |
1.01 |
(0.75–1.36) |
0.935 |
0.77 |
(0.57–1.04) |
0.085 |
0.90 |
(0.67–1.20) |
0.469 |
|
>US$ 75K vs. |
1.02 |
(0.69–1.51) |
0.920 |
0.57 |
(0.38–0.86) |
0.007 |
0.75 |
(0.51–1.10) |
0.140 |
|
Missing vs. |
1.08 |
(0.69–1.67) |
0.729 |
1.01 |
(0.65–1.58) |
0.958 |
1.03 |
(0.67–1.59) |
0.900 |
|
Alcohol consumption |
|
|
|
|
|
|
|
|
|
|
1–4 days/week vs. <1 day/week |
0.99 |
(0.70–1.40) |
0.954 |
0.97 |
(0.68–1.38) |
0.860 |
1.18 |
(0.84–1.66) |
0.350 |
|
5–7 days/week vs. <1 day/week |
0.51 |
(0.33–0.79) |
0.002 |
0.58 |
(0.38–0.88) |
0.011 |
0.72 |
(0.48–1.09) |
0.121 |
|
Missing vs. <1 day/week |
1.19 |
(0.87–1.62) |
0.260 |
1.38 |
(1.01–1.90) |
0.042 |
1.48 |
(1.09–2.01) |
0.012 |
|
Physical activity (change) |
|
|
|
|
|
|
|
|
|
|
Increased vs. persistently active |
1.27 |
(0.97–1.66) |
0.088 |
1.20 |
(0.91–1.58) |
0.190 |
1.07 |
(0.82–1.40) |
0.610 |
|
Decreased vs. persistently active |
2.29 |
(1.52–3.46) |
<0.001 |
1.88 |
(1.23–2.88) |
0.004 |
1.79 |
(1.18–2.71) |
0.006 |
|
Persistently inactive vs. persistently active |
2.03 |
(1.29–3.20) |
0.002 |
1.79 |
(1.13–2.50) |
0.013 |
1.73 |
(1.10–2.72) |
0.018 |
Discussion
This study examined the relationship between changes in physical activity levels in young adults (aged 20–35 years) and middle-aged adults (aged ≥35 years) and obesity, insulin resistance, and diabetes. Participants who had decreased physical activity levels and were continuously inactive were more likely to have obesity, insulin resistance, and diabetes than those who regularly exercised before and after the age of 35 years.
A decline in physical activity and persistent low fitness from young adulthood to middle age predicted obesity, insulin resistance, and diabetes in middle age or older. Previous studies support these findings, showing the protective effects of regular physical activity against overweight, obesity, and insulin resistance. However, most previous studies have focused on declines in fitness levels from childhood (or adolescence) to young adulthood and their impact on overweight or obesity [8,9,16], adiposity [7], insulin resistance [9], and the development of unhealthy habits such as smoking and saturated fat intake [17]. A Finnish study [18] on working-age adults found that continuous low physical activity and decreased activity levels over a 10-year period were strongly associated with significant body mass gains, whereas increased activity was associated with smaller weight gains. Our findings suggest that changes in physical activity levels between young adulthood and middle age may be critical not only in obesity development but also in diabetes incidence. Furthermore, this study showed that continued participation in regular physical activity could aid in obesity and diabetes prevention.
This study shows that continued participation in regular physical activity could aid in obesity and diabetes prevention. Therefore, health promotion programs that encourage maintaining physical activity levels are necessary. However, maintaining motivation for regular exercise is challenging for many adults. Addressing barriers to physical activity is crucial in developing effective programs. Salmon et al. identified significant barriers to physical activity among adults, including cost, fatigue, lack of time, and work and family commitments. These perceived barriers to physical activity were significantly associated with decreased physical activity and increased sedentary behavior [19]. Intrinsic motivational factors including mastery (getting better at an activity), physical fitness (being physically fit), affiliation (being with friends and engaging in activities with others), psychological state (improving psychological health), and appearance (maintaining or improving appearance and body shape) were associated with consistent physical activity [20]. Programs that help individuals identify their values and make physical activity more meaningful may improve adherence.
The strength of this study lies in its utilization of data from the MIDUS study, a widely recognized and comprehensive dataset that includes a diverse U.S. population. By categorizing participants based on their physical activity levels from young adulthood to middle age, we provide insights into the long-term impact of activity changes. The findings highlight the importance of maintaining consistent physical activity to prevent metabolic disorders, contributing to the development of targeted health promotion strategies.
This study has some limitations that should be considered when interpreting the results. First, the cross-sectional assessment of the current physical activity level when classifying physical activity changes before and after the age of 35 years. Current physical activity may not represent the physical activity level during the entire period after the age of 35 years. Longitudinal studies would provide a better understanding of the association between physical activity changes and obesity, insulin resistance, and diabetes. Second, the sample was predominantly white, limiting the generalizability of the results to ethnic minorities. Therefore, future studies should examine diverse populations to assess the external validity of these findings. Third, the presence of missing data for many participants in the MIDUS database may have introduced potential confounders. For example, smoking data were missing for >70% of participants, while alcohol intake data were missing for 44.4%, and income data were missing for 24.5%. These factors may have affected the results. Finally, information on whether the participants with diabetes had type 1 or type 2 diabetes was unavailable. However, this limitation likely did not significantly impact the results, as type 2 diabetes accounts for > 90% of adult diabetes cases in the United States [21].
Conclusion
This study shows that decreased physical activity after the age of 35 years is associated with obesity, insulin resistance, and diabetes. Health promotion programs aimed at maintaining physical activity levels in middle-aged individuals may help reduce the risk of these conditions.
Acknowledgments
The author thanks James Davis, MD, MS, and Eunjung Lim, PhD, the John A. Burns School of Medicine (JABSOM), University of Hawaii at Manoa, for helpful discussions during the data analysis of the study. Dr. Davis and Dr. Lim received no financial support for their participation.
Author Contributions
Tomoya Sato is the sole author of this manuscript and was responsible for the study conception, design, data analysis, and manuscript writing. No other individuals contributed to this work in a manner that meets the ICMJE criteria for authorship.
Disclosure of Potential Conflict of Interest
The author has no conflicts of interest to disclose.
Compliance with Ethical Standards
This article does not contain any studies with human or animal subjects performed by any of the authors.
References
2. Melmer A, Kempf P, Laimer M. The Role of Physical Exercise in Obesity and Diabetes. Praxis (Bern 1994). 2018 Aug; 107(17-18):971-6.
3. Haskell WL, Lee IM, Pate RR, Powell KE, Blair SN, Franklin BA, et al. Physical activity and public health: updated recommendation for adults from the American College of Sports Medicine and the American Heart Association. Med Sci Sports Exerc. 2007 Aug; 39(8):1423-34.
4. Wahid A, Manek N, Nichols M, Kelly P, Foster C, Webster P, et al. Quantifying the Association Between Physical Activity and Cardiovascular Disease and Diabetes: A Systematic Review and Meta-Analysis. J Am Heart Assoc. 2016 Sep 14; 5(9):e002495.
5. Dumith SC, Gigante DP, Domingues MR, Kohl HW. Physical activity change during adolescence: A systematic review and a pooled analysis. Int J Epidemiol. 2011; 40:685-98.
6. Micklesfield LK, Hanson SK, Lobelo F, Cunningham SA, Hartman TJ, Norris SA, et al. Adolescent physical activity, sedentary behavior and sleep in relation to body composition at age 18?years in urban South Africa, Birth-to-Twenty+ Cohort. BMC Pediatr. 2021;21:30.
7. Oh M, Zhang D, Whitaker KM, Letuchy EM, Janz KF, Levy SM. Moderate-to-vigorous intensity physical activity trajectories during adolescence and young adulthood predict adiposity in young adulthood: The Iowa Bone Development Study. J Behav Med. 2021; 44:231-40.
8. Yang X, Telama R, Viikari J, Raitakari OT. Risk of obesity in relation to physical activity tracking from youth to adulthood. Med Sci Sports Exerc. 2006; 38:919-25.
9. Dwyer T, Magnussen CG, Schmidt MD, Ukoumunne OC, Ponsonby AL, Raitakari OT, et al. Decline in physical fitness from childhood to adulthood associated with increased obesity and insulin resistance in adults. Diabetes Care. 2009; 32:683-7.
10. Brim OG, Baltes PB, Bumpass LL, Cleary PD, Featherman DL, Hazzard WR, et al. Midlife in the United States (MIDUS 1), 1995-1996 (ICPSR 2760; Version V19). ICPSR-Interuniversity Consortium for Political and Social Research. Sep 28, 2020. Doi:10.3886/ICPSR02760.v19.
11. Ryff CD, Almeida DM, Ayanian JZ, Carr DS, Cleary PD, Coe C, et al. Midlife in the United States (MIDUS 2), 2004-2006: (ICPSR 4652; Version V7). Inter-university Consortium for Political and Social Research. Nov 20, 2017. Doi: 10.3886/ICPSR04652.v7.
12. Ryff C, Almeida DM, Ayanian JZ, Binkley N, Carr DS, Coe C, et al. Midlife in the United States (MIDUS Refresher 1), 2011-2014 (ICPSR 36532; Version V3). ICPSR-Interuniversity Consortium for Political and Social Research. Nov 20, 2017. Doi: 10.3886/ICPSR36532.v3
13. Ryff CD, Seeman T, Weinstein M. Midlife in the United States (MIDUS 2): Biomarker Project, 2004–2009 (ICPSR 29282; Version V9). ICPSR-Interuniversity Consortium for Political and Social Research. Mar 27, 2019. Doi:10.3886/ICPSR29282.v9.
14. Weinstein M, Ryff CD, Seeman TE. Midlife in the United States (MIDUS Refresher): Biomarker Project, 2012–2016 (ICPSR 36901; Version V6). ICPSR-Interuniversity Consortium for Political and Social Research. Nov 18, 2019. Doi:10.3886/ICPSR36901.v6.
15. Tam CS, Xie W, Johnson WD, Cefalu WT, Redman LM, Ravussin E. Defining insulin resistance from hyperinsulinemic-euglycemic clamps. Diabetes Care. 2012 Jul; 35(7):1605-10.
16. Kvaavik E, Tell GS, Klepp KI. Predictors and tracking of body mass index from adolescence into adulthood: follow-up of 18 to 20 years in the Oslo Youth Study. Arch Pediatr Adolesc Med. 2003 Dec; 157(12):1212-8.
17. Raitakari OT, Porkka KV, Taimela S, Telama R, Räsänen L, Viikari JS. Effects of persistent physical activity and inactivity on coronary risk factors in children and young adults. The Cardiovascular Risk in Young Finns Study. Am J Epidemiol. 1994; 140:195-205.
18. Haapanen N, Miilunpalo S, Pasanen M, Oja P, Vuori I. Association between leisure time physical activity and 10-year body mass change among working-aged men and women. Int J Obes. 1997; 21:288-96.
19. Salmon J, Owen N, Crawford D, Bauman A, Sallis JF. Physical activity and sedentary behavior: a population-based study of barriers, enjoyment, and preference. Health Psychol. 2003 Mar; 22(2):178-88.
20. Aaltonen S, Rottensteiner M, Kaprio J, Kujala UM. Motives for physical activity among active and inactive persons in their mid-30s. Scand J Med Sci Sports. 2014; 24:727-35.
21. Xu G, Liu B, Sun Y, Du Y, Snetselaar LG, Hu FB, et al. Prevalence of diagnosed type 1 and type 2 diabetes among US adults in 2016 and 2017: population based study. BMJ. 2018 Sep 4; 362:k1497.