Abstract
Objective: This study investigated clinical inertia in the management of type 2 diabetes mellitus (T2DM), a major challenge in clinical practice. The primary aim was to assess the delay in therapeutic intensification among patients with persistently elevated hemoglobin A1c (HbA1c) levels (>8.0%) who were already receiving two oral antidiabetic drugs, considering the availability of newer effective therapies.
Research design and methods: We conducted a retrospective cohort study using data from the Clalit Health Service database in Israel. The initial cohort comprised 554 patients with T2DM and HbA1c >8.0%, of whom 518 managed by general practitioners were included in the primary analysis. Patients were stratified into two subgroups: HbA1c >8% to ≤9% and HbA1c >9%. Data were analyzed to determine the timing, type, and effectiveness of treatment intensification decisions over up to 18-month follow-up period.
Results: Therapeutic intensification with a third medication occurred in 58.4% of patients with HbA1c >9% compared to 47.4% of those with HbA1c >8% to ≤9% (p = 0.012), with shorter median time to intensification in the less controlled group (6.4 vs 10.3 months respectively, p = 0.034). The most common form of intensification was the addition of a third oral agent (79.2% vs. 53.4%, p <0.001). Injectable therapies were used less frequently, and insulin was preferred over glucagon-like peptide-1 receptor agonists (GLP-1Rs) (32.9% vs. 11.8% for insulin, p <0.001; 16.4% vs. 10.2% for GLP-1RAs, p = 0.137). Despite intensification, many patients did not achieve their glycemic targets.
Conclusions: Clinical inertia represents a significant barrier to effective T2DM management. Targeted educational interventions are urgently needed to improve adherence to current clinical guidelines among primary care physicians.
Keywords
Hyperglycemia, Diabetes care, Clinical inertia, General practitioner, Oral antidiabetic drugs (OADs), Glucagon-like peptide 1 receptor agonist (GLP1-RA)
Introduction
The effective management of type 2 diabetes mellitus is paramount in preventing the onset and progression of diabetes-related complications [1–3]. Central to this management is the timely monitoring of hemoglobin A1c (HbA1c) levels and the prompt intensification of treatment regimens upon the detection of sustained hyperglycemia. Nevertheless, research consistently highlights a pervasive delay in clinical response even among patients who are already on two oral antidiabetic drugs (OADs) [4,5]. This delay, often referred to as clinical inertia, represents a significant deviation from recommended practices, potentially compromising patient outcomes. Notably, the hesitation to initiate injectable treatments, such as glucagon-like peptide-1 receptor agonists (GLP-1RAs) or insulin, underscores a critical gap between guideline-directed management and real-world clinical practices.
Recent initiatives aimed at enhancing the knowledge and capabilities of primary care physicians, alongside the introduction of novel OADs and injectable therapies, posit a potential shift in the landscape of type 2 diabetes mellitus treatment intensification [6]. However, the extent to which these efforts have mitigated treatment delays, particularly in transitioning patients to injectable therapies, remains unclear. Furthermore, the decision-making process underlying the selection of third-line medication addition is influenced by a myriad of factors, including but not limited to the prescribing physician's specialty and the patient's ethnicity [7,8]. These elements may significantly impact both the timing of treatment intensification and the choice of medication, thereby affecting patient outcomes.
This study aims to assess the interval from the identification of uncontrolled HbA1c levels (>8.0%) in patients already on two oral antidiabetic drugs to the initiation of a third antidiabetic medication, and to examine how this delay varies according to baseline glycemic control, type of medication prescribed (oral versus injectable), and influencing factors such as the prescribing physician’s specialty and patient ethnicity.
The importance of this study is evaluating the real-world gap between clinical guidelines and actual practice which is vital for understanding why many patients remain at high risk for diabetes-related complications despite the availability of effective therapies. This research could highlight critical areas for improvement in the transition to injectable treatments and optimizing personalized management strategies in uncontrolled type 2 diabetes.
Methods
Study design and data source
This research was a retrospective cohort study designed to investigate the timing and effectiveness of treatment intensification in patients with uncontrolled type 2 diabetes mellitus who were initially treated with two OADs and had an HbA1c level greater than 8.0%.
The methodology of this study was modelled after established protocols for evaluating clinical inertia in chronic disease management [4]. Rather than an arbitrary selection, our criteria for 'therapeutic intensification' and 'uncontrolled glycemia' were defined according to the American Diabetes Association and European Association for the Study of Diabetes consensus guidelines relevant to the 2017–2018 study period. To ensure high-quality reporting of our observational data, we adhered strictly to the STROBE (STrengthening the Reporting of OBservational studies in Epidemiology) checklist. Figure 1 summarizes the flowchart selection of the patients with uncontrolled diabetes.
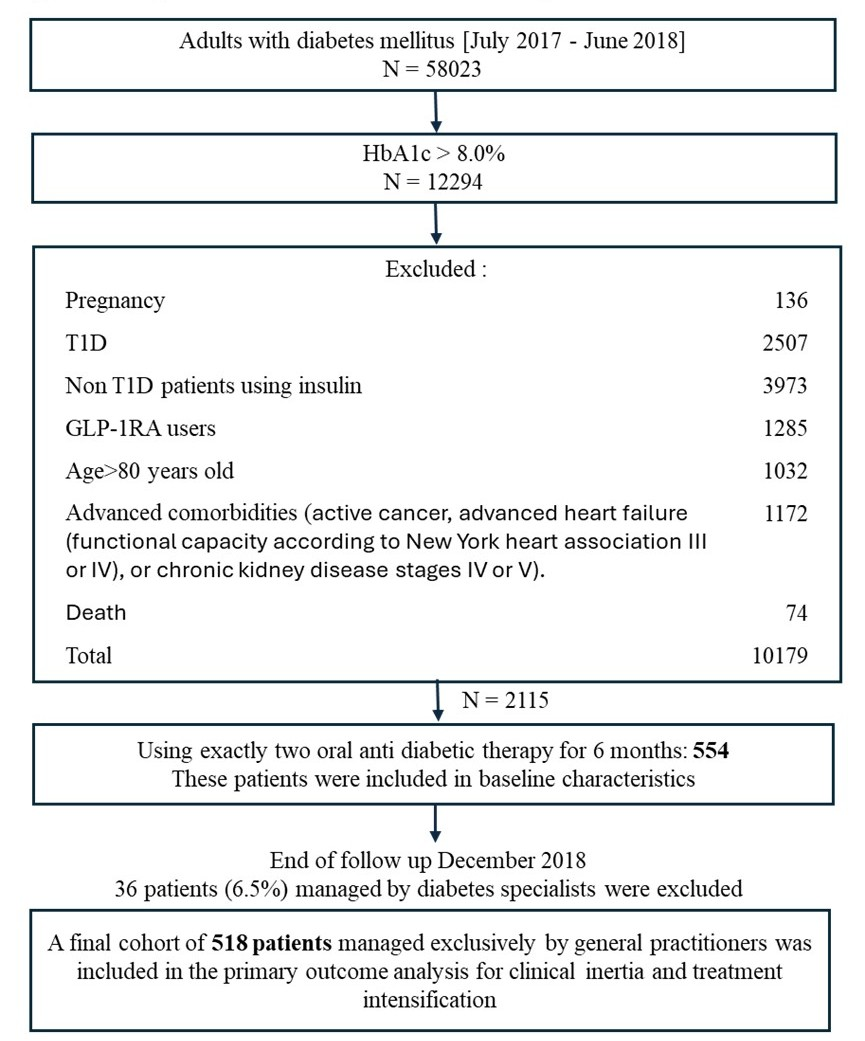
Figure 1. Study flowchart and timeline for selection of patients with uncontrolled T2D. Abbreviations: T2D: Type 2 Diabetes; T1D: Type 1 Diabetes; GLP-1-RA: Glucagon-Like Peptide-1 Receptor Agonists. * Exclusion criteria over the period of follow up.
Among the non-controlled patients, those with 8% > HbA1c >9% were considered more controlled, compared to the less controlled group (HbA1c >9%). Data was collected from 01/07/2017, until 30/06/2018, with a follow-up period of up to 18 months till 31/12/2018. The study utilized de-identified patient data sourced from the Clalit Health Service database, covering the Israeli regions of Sharon and Shomron. Ethical approval, including a waiver of informed consent, was granted by the Clalit Helsinki Committee. This retrospective study utilized de-identified data from Clalit’s computerized systems, covering enrolment, medical, and pharmacy claims recorded during routine care. To ensure patient confidentiality, all datasets were de-identified before analysis, and no identifiable personal information was accessible to the research team at any stage.
Study participants
We identified adult patients from the Clalit Health Service database, which covers the Sharon and Shomron regions in Israel. patients who were included have poorly controlled type 2 diabetes mellitus, which is characterized by HbA1c levels over 8.0% while taking two OADs. patients were then divided into two groups based on their HbA1c value: those who have HbA1c >8% and ≤9% were deemed more controlled and those above 9% who were deemed less controlled. To be included in the study, the individuals had to be between 18–80 years of age, and they should have taken two OADs within six months before their HbA1c test. We have excluded patients with type 1 diabetes, pregnant women at any point during the study, those treated with injectable therapies (insulin or GLP-1RAs), and individuals suffering from advanced comorbid conditions, including active cancer, advanced heart failure (functional capacity according to New York heart association III or IV), or chronic kidney disease stages IV or V. This approach is aimed at gathering a group of patients with type 2 diabetes who face difficulties in controlling their blood glucose levels with standard oral therapy. These patients were monitored for at least six months and up to eighteen months to assess the timing and effectiveness of treatment intensification (Supplementary Figure 1). Data regarding their demographics, clinical characteristics, and dispensed medications were collected as part of their routine care, de-identified, and analyzed to evaluate the impact of treatment adjustments in this population.
The data was collected after December 31st, 2018, and included only alive patients who met the inclusion criteria without developing any of exclusion criteria during the follow up period. The period before data collection was divided into two parts: determining patients who meet inclusion criteria in the period from July 1st, 2017, until June 30th, 2018, and follow up period starting from HbA1c test till December 31st, 2018.
Drug exposure
This was quantified based on the documented dispensing of two OADs to the patients within the six months preceding their index HbA1c test, which served as a marker for the initiation of our observational period. The OADs of interest were divided into groups: (1) metformin, (2) insulin release stimulants (sulfonylureas and glinides), (3) glitazones, (4) alpha-glucosidase inhibitors (acarbose), (5) dipeptidyl peptidase-4 inhibitors, and (6) sodium-glucose cotransporter 2 (SGLT2) inhibitors. Fixed-dose oral combinations were acknowledged as two distinct OADs, aligning with their dual components. The specific third antidiabetic agent added during the study period was also recorded, alongside the specialty of the prescribing physician—either primary care or a diabetes consultant. This detailed accounting of drug exposure allowed for a comprehensive analysis of treatment patterns, including the shift towards or preference for certain antidiabetic agents over others in the process of treatment intensification. Moreover, medication adherence was assessed through the pharmacy claims data, providing insight into patients' compliance with their prescribed treatment regimens.
Outcome (aim)
The primary outcome was time to treatment intensification after HbA1c >8%. Our secondary outcomes were the type of third medication prescribed and the degree of HbA1c reduction after intensification. Other secondary outcomes: Association between the index HbA1c (>8–9% or >9%) on the time to therapy intensification, the type of third medication used, the correlation between cardiovascular and renal disease and the type of third medication prescribed and the association between the specialty of the prescribing physician and the specific third medication.
Statistical analysis
All analyses were performed using SPSS Statistical Software, v. 26.0. Categorical variables were expressed by frequencies and percentages. Continuous variables were presented as mean ± standard deviation. Chi-square tests were used to evaluate the differences between the research groups in the distribution of categorical variables. Independent-sample t-tests were performed to determine between-group differences in continuous variables. Independent-sample t-tests were used for between-group comparisons of continuous baseline variables. For the primary time-to-event outcome (time to treatment intensification), Kaplan–Meier methods were used and HbA1c groups were compared using the log-rank test; time to intensification is summarized using the median (interquartile range). Paired t-tests were carried out pre- and post-intensification. All statistical tests were performed at a significant level of 5%. P-values were rounded to three decimal places. Subgroup analyses were conducted, categorizing patients by gender and ethnicity (Jews or Arabs). Due to a significantly small number of patients utilizing specialized diabetes clinics (n = 36, 6.5%), this subgroup was excluded from the primary outcome analysis of clinical inertia to maintain sufficient statistical power.
In addition to univariate comparisons, we performed multivariable regression analyses to estimate independent associations with treatment intensification and medication type. Time to treatment intensification was analyzed using Cox proportional hazards regression, with follow-up time defined as the interval from the index HbA1c measurement to initiation of a third glucose-lowering agent. For patients without documented intensification, follow-up time was defined as the interval between the index HbA1c measurement and the end of the study period (December 31st, 2018), capped at 18 months. We also used multivariable logistic regression to evaluate (1) the likelihood of any treatment intensification during follow-up and (2) the likelihood of receiving injectable (vs oral) therapy among patients who intensified. Models were adjusted a priori for baseline HbA1c group (>9.0% vs >8.0%–9.0%), ethnicity (Arab vs Jewish), age, sex, body mass index (BMI), diabetes duration, and major comorbidities (ischemic heart disease, cerebrovascular disease, heart failure, retinopathy, nephropathy, and neuropathy). Adjusted effect estimates are reported as hazard ratios (HRs) or odds ratios (ORs) with 95% confidence intervals; two-sided p values <0.05 were considered statistically significant.
Missing data were handled using a complete-case analysis approach. Individuals with missing values for the key baseline measurements (index HbA1c) were excluded from the cohort. For secondary clinical characteristics, analyses were conducted on available data without the use of imputation.
Results
Baseline characteristics
A total of 554 individuals with type 2 diabetes mellitus and a baseline HbA1c >8% on 2 OADs for at least 6 months were identified in the period from July 1st, 2017, until June 30th, 2018, and stratified based on their HbA1c levels at the index point into two groups: those with 8.0%> HbA1c ≤9.0% (n = 282, 50.9%) and those with HbA1c >9.0% (n = 272, 49.1%) (Table 1). of those, 336 (60.6%) were male, and the remainder were female (218, 39.4%). The mean age was 59.7 years. Notably, the age difference between the less controlled group (mean age 60.8 ± 9.6) and the more controlled group (mean age 58.5 ± 9.7) was statistically significant (P = 0.005) but not deemed clinically significant. The distribution across ethnicities was balanced, with 323 Jewish patients (58.3%) and 231 Arab patients (41.7%), highlighting the study's inclusivity. Notably, Jewish participants accounted for just 54.8% of the study cohort who have HbA1c levels higher than 9% (less controlled group), potentially indicating a higher proportion of Arab individuals within the less controlled group, yet the distribution based on HbA1c level wasn't statistically significant between both Jews and Arabs. The mean BMI was 29.7 ± 5.4 kg/m2 as expected for patients with diabetes to be overweight and obese. Regarding comorbid conditions, a significant portion of the cohort had been diagnosed with either microvascular or macrovascular complications: ischemic heart disease (24.5%), strokes or transient ischemic attacks (21.7%), neuropathy (14.4%), retinopathy (13.9%), and nephropathy (5.4%). Micro and macrovascular complications did not significantly differ between groups, suggesting that the baseline health status of diabetes-related complications was comparable across the cohort.
|
Characteristics |
Total |
8.0%< HbA1c ≤9.0% |
HbA1c >9.0% |
p-value |
|
N |
554 |
282 (50.9) |
272 (49.1) |
|
|
Gender (Male), n (%) |
336 (60.6) |
175 (62.1) |
161 (59.2) |
0.490 |
|
Age(years), Mean ± SD |
59.7 ± 9.7 |
60.8 ± 9.6 |
58.5 ± 9.7 |
0.005 |
|
Ethnicity (Jew), n (%) |
323 (58.3) |
174 (61.7) |
149 (54.8) |
0.099 |
|
BMI, Mean ± SD |
29.7 ± 5.4 |
30.1 ± 5.3 |
29.3 ± 5.4 |
0.066 |
|
Duration of diabetes (years), Mean ± SD |
10.4 ± 4.5 |
10.3 ± 4.6 |
10.5 ± 4.4 |
0.657 |
|
Comorbidities, n (%) |
|
|
|
|
|
Ischemic heart disease |
136 (24.5) |
68 (24.1) |
68 (25.0) |
0.808 |
|
Stroke/Transient ischemic attack |
120 (21.7) |
60 (21.3) |
60 (22.1) |
0.823 |
|
Peripheral artery disease |
25 (4.5) |
15 (5.3) |
10 (3.7) |
0.352 |
|
Carotid artery disease |
7 (1.3) |
5 (1.8) |
2 (0.7) |
0.274 |
|
Heart failure |
20 (3.6) |
11 (3.9) |
9 (3.3) |
0.709 |
|
Retinopathy |
77 (13.9) |
34 (12.1) |
43 (15.8) |
0.202 |
|
Nephropathy |
30 (5.4) |
17 (6.0) |
13 (4.8) |
0.516 |
|
Neuropathy |
80 (14.4) |
44 (15.6) |
36 (13.2) |
0.428 |
|
Abbreviations: SD: standard deviation; BMI: body mass index |
||||
Supplementary Table 1 shows the laboratory parameter comparisons between the two subgroups of our study cohort, differentiated by their HbA1c levels. The less controlled group with HbA1c >9.0% exhibited significantly elevated HbA1c values (10.4%) compared to the more controlled group with 8.0% < HbA1c ≤9.0% (8.5%). Total cholesterol and non-HDL cholesterol levels, primarily driven by elevated triglycerides were higher in the less controlled group (HbA1c >9%) (Triglyceride levels of 175.5 mg/dl vs. 203.6 mg/dl in the less controlled (HbA1c >9%) (p = 0.011)). Higher triglyceride levels in the less controlled groups can be attributed to increased hyperglycemia and insulin deficiency, which explains the more frequent use of fibrates in these groups. Additionally, mean hemoglobin levels were statistically but non-clinically significantly higher in the more controlled group (8%> HbA1c >9%) (13.7 g/dL vs. 13.4 g/dL). In contrast, serum creatinine levels were significantly lower in the more controlled group (0.76 vs. 0.81), although these differences were not clinically significant.
Supplementary Table 2 depicts the comparison of oral OADs and other medications for dyslipidemia, hypertension, and atherosclerotic cardiovascular disease (ASCVD) between the two groups based on their HbA1c levels. Notably, a significant difference was observed in the usage of fibrates between the groups, with 42.7% in the less controlled (HbA1c >9.0%) group versus 24.4% in the more controlled (8.0%< HbA1c ≤9.0%) group (p = 0.013), indicating a higher inclination towards fibrate use among patients with more poorly controlled diabetes, most probably due to insulinopenia associated hypertriglyceridemia in this group. However, there were no significant differences in the use of other medications between the two groups (less controlled vs. more controlled), nor medication compliance, which stood at approximately 70.4% for both groups. This suggests that while specific treatment approaches such as fibrate usage vary with diabetes control levels, overall adherence to medication remains constant across different glycemic control statuses.
Outcomes
Out of 554 patients initially screened, 518 managed by general practitioners were included in the primary outcome analysis. As shown in Figure 1, 36 patients (6.5%) managed by diabetes specialists were excluded due to the limited capacity and small sample size of this subgroup (in this small group, 35 out of 36 patients started third medication for diabetes: 19 oral medication, 11 insulin, one GLP-1RA, one FRC and 3 patients started combination of oral therapy and insulin). Shown in Table 2 is a comparison of intensification during the follow-up period between two patient subgroups categorized by HbA1c levels. The rate of therapy intensification during the follow-up period was significantly higher in the group with poorer glycemic control (HbA1c >9.0%) compared to the more controlled group (8.0%< HbA1c ≤9.0%). Specifically, 58.4% of patients in the less controlled group underwent treatment intensification, compared to 47.4% in the group with HbA1c between 8.0% and 9.0% (p = 0.012). These findings align with the data presented in Supplementary Table 3, confirming that patients with the highest baseline hyperglycemia were more likely to receive a third antidiabetic agent. Our observed intensification rate of 52.7% within 18 months is notably higher than the 25–35% reported in other studies [5,9]. This may be due to our inclusion criteria requiring baseline OAD adherence, which selects for a more 'engaged' patient population.
We examined the time intervals associated with treatment intensification in uncontrolled type 2 diabetes mellitus, based on their HbA1c levels, revealing insights into clinical inertia (Table 2).
|
Category |
Total |
8.0%< HbA1c ≤9.0% |
HbA1c > 9.0% |
p-value |
|
Analyzed (n) |
518 |
268 |
250 |
|
|
Lack of intensification, n (%) |
245 (47.3%) |
141 (52.6%) |
104 (41.6%) |
0.013 |
|
Intensification n (%) |
273 (52.7%) |
127 (47.4%) |
146 (58.4%) |
0.013 |
|
Days to intensification (Mean ± SD) |
117 ± 119.1 |
122.7 ± 123.4 |
110.1 ± 115.0 |
0.386 |
Table 2 shows that the time to treatment intensification in uncontrolled type 2 diabetes mellitus who underwent de-facto treatment intensification was similar between the two groups stratified based on their HbA1c levels. As shown by the Kaplan–Meier curves in Figure 2, the proportion of patients remaining without treatment intensification over 180 days was significantly lower in the higher HbA1c group (>9.0%) compared to the more controlled group. The median time to intensification was 67 days (interquartile range 20-170 days) vs 85.5 days (interquartile range 22.3-206.3 days) in higher versus lower HbA1c groups respectively (P = 0.034).
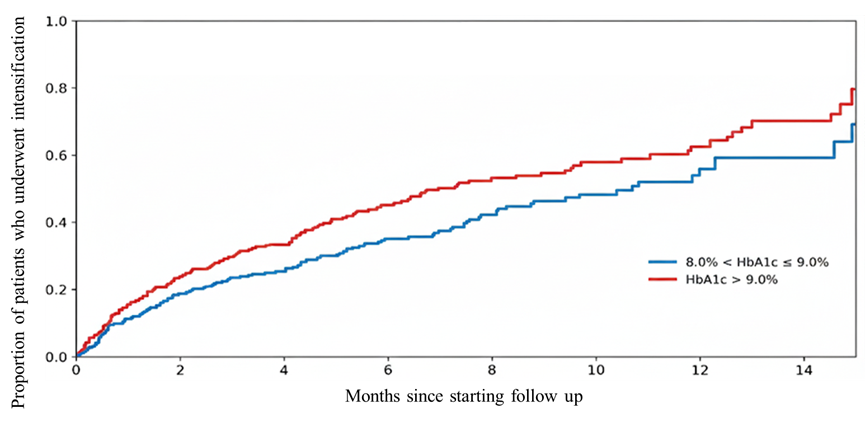
Figure 2. Time to treatment intensification by baseline HBA1c category. Kaplan–Meier curves showing the proportion of patients remaining without treatment intensification over 180 days. Patients were stratified into two groups: 8.0% < HBA1c ≤9.0% (blue line) and HBA1c >9.0% (red line). Log-rank p = 0.034.
In multivariable Cox regression, HbA1c >9% was independently associated with earlier treatment intensification (adjusted HR 1.42, 95% confidence interval (CI) 1.11–1.81; p = 0.005), whereas Arab ethnicity was associated with delayed intensification (adjusted HR 0.76, 95% CI 0.58–0.98; p = 0.038) (Supplementary Table 4).
Supplementary Table 3 shows third medication prescriptions among 518 patients divided by index HbA1c, showing 58.1% of those with HbA1c>9.0% received a third medication compared to 47% with HbA1c between 8.0% and 9.0% (p = 0.012). patients with HbA1c 8.0–9.0% were more likely prescribed oral antidiabetics (79.2% vs. 53.4%, p <0.001). In contrast, those with HbA1c >9.0% received more injectable therapies, notably insulin or fixed ratio insulin/GLP-1RA combinations (FRC) (p <0.001), especially basal insulin (26.4% vs. 10.4%, p <0.001), with no significant differences in GLP-1RA prescriptions between groups which were prescribed for a low percentage patients with type 2 diabetes mellitus in both groups (37/518 total patients, 7.1%). Among patients who underwent treatment intensification, multivariable logistic regression showed that baseline HbA1c >9% was independently associated with higher odds of receiving injectable rather than oral therapy (adjusted OR 3.20, 95% CI 1.81–5.67; p <0.001). Arab ethnicity was also independently associated with receiving injectable therapy (adjusted OR 1.96, 95% CI 1.09–3.54; p = 0.025). Older age was associated with lower odds of injectable therapy (adjusted OR 0.97 per year, 95% CI 0.93–1.00; p = 0.046). Ischemic heart disease was also associated with higher odds of intensification (adjusted OR 1.90, 95% CI 1.19–3.04; p = 0.034) (Supplementary Tables 5 and 6).
In examining treatment patterns for type 2 diabetes mellitus, our study provides insights into the associations between demographic and clinical characteristics and the escalation of therapy (Supplementary Table 7). While our findings highlight trends in prescribing practices, such as younger individuals and those of Arab ethnicity being more likely to receive injectable therapies, these observations are associative in nature and do not imply causality. Additionally, comorbid conditions, such as stroke or retinopathy, were associated with a preference for oral medications in patients with HbA1c >9.0% (Supplementary Table 8). Importantly, there was no significant increase in the use of guideline-recommended medications, such as GLP-1RAs or SGLT2 inhibitors, for patients with cardiovascular or renal disease. Discover study [10] found similar results regarding suboptimal use of these pharmacological groups particularly in patients who can benefit from using it.
We assessed HbA1c changes post-intensification, revealing significant reductions in both groups (more controlled vs less controlled). Following intensification, the 8.0%< HbA1c ≤9.0% group showed a significant reduction from 8.6%–8.2% (p = 0.003), while the HbA1c >9.0% group demonstrated a more substantial decrease from 10.4%–8.9% ($p <0.001$). Although the larger magnitude of change in the higher baseline group is clinically relevant, it may partially reflect regression toward the mean—where extreme baseline values naturally show greater variability toward the average. This underscores that while intensification is effective, baseline glycemic burden is a critical modifier of the observed treatment effect.
As shown in Supplementary Table 9, for patients without treatment intensification, a notable decrease was only seen in the HbA1c >9.0% cohort (10.3%–9.7%, p = 0.7) that was smaller compared to patients with HbA1c >9.0% who started third medication (HbA1c decreased from 10.4%–8.9%, p <0.001). The overall percentage of patients achieving the target HbA1c (<7%) post-intervention did not significantly differ between HbA1c-based subgroups and was low (14% vs. 7%, p = 0.153). A one-way ANOVA was conducted to assess the impact of different third anti-diabetic agents on HbA1c reduction, as detailed in (Supplementary Table 10). The findings revealed no significant differences in the absolute HbA1c decline across the types of medications used, within both the 8.0%Supplementary Table 3 provides the selected third medication added for each group of uncontrolled patients showing higher use of any OAD in 8.0%< HbA1c ≤9.0% group without difference when comparing the specific OADs used in both groups. On the other hand, the use of basal insulin, any insulin or FRC was higher in the less controlled group.
Discussion
Our study examines clinical inertia in the real-world Israeli population, between 2017 and 2018 with a follow-up period of 6–18 months. In accordance with prior observational studies [9], intensification rates were 55.1% within the follow-up period of up to 18 months, with a long delay to intensification (117 days). The 6-month intensification rates reported in published studies ranged from 25–35% [9–13], which is lower compared to the finding of our present study, but still, the gap between our data and what is desired is very significant. Additionally, patients included in this study had documented dispensing of two OADs in the 6 months before the HbA1c index test. Individuals who declined diabetes treatment were not part of the study population. This selection criterion likely accounts for the higher rate of treatment intensification observed in our study compared to others.
Our study also provides additional information regarding treatment inertia in patient groups, depending on their index HbA1C measurements, with time to intensification longer in the more controlled group. Patients in the more uncontrolled group had higher rates of treatment intensification, however, the time to intensification was similar between both subgroups. Consistent with prior research [14], patients with less controlled diabetes were more likely to receive intensified treatment, resulting in greater reductions in HbA1C levels. However, most of these patients remained uncontrolled throughout the follow-up period. Notably, we found that in the less controlled group (HbA1c>9%), only 58% received treatment intensification in 18 months follow-up, with 53% receiving oral medication, and 47% receiving injectables either Insulin\FRC or GLP1-RA, however intensification by prescribing GLP-1RA was very low (16.4%). In the less uncontrolled group (8%> HbA1c >9%), only 43% received treatment intensification, 79% of whom received oral medication, and 21% received either Insulin\FRC or GLP1RA which was prescribed for 10.2% of patients in this group only. This may indicate an inclination of treating physicians to prescribe more non-oral treatment intensification to less controlled patients, however, the reluctance to prescribe GLP-1RA is not clear despite being reimbursed in Israel in most of the patients with diabetes who were included in the study. Patients whose HbA1c is above 8% and are on 2 OADs need intensification by injectable therapy, preferably by GLP1RA [6]. However, only 21.4% and 47.7% of patients who underwent treatment intensification in the 8%< HbA1c ≤9% and HbA1c >9%, respectively started injectable therapy, with insulin being prescribed more often than GLP1RA (11.2% and 10.2% vs. 31.3% and 16.4% respectively), with only a small proportion of patients achieving target HbA1c goal of less than 7% in both groups (16.1% and 8.8% respectively). It is worth mentioning that there was no association between baseline cardiovascular and/or renal disease, and prescribing GLP1-RA and/or SGLT2i. However, this study was performed in a relatively short time after the introduction of new treatment guidelines that emphasize the need to prescribe anti-diabetic medication with evidence of ASCVD, heart failure, or renal benefit in patients with diabetes and ASCVD, heart failure, or renal disease respectively.
Our cohort included patients with overweight and uncontrolled diabetes while taking two OADs. Most of them didn’t have a clear indication for insulin, thus we expected a higher prescription of GLP1-RA which was prescribed only in 37 of 273 (13.55%) of patients with diabetes who underwent intensification in this study. We expected that the introduction of new, effective, and safe anti-diabetic medications, the reimbursing program by the Israeli government for those medications, and the extensive education programs among GPs, could have a positively significant impact on treatment decisions in uncontrolled diabetics. Unfortunately, our study shows that although there are strong recommendations for prescribing these effective and affordable medications (in Israel), uncontrolled type 2 diabetes mellitus patients still suffer from clinical inertia.
Limitations, primarily, its retrospective design inherently limits the ability to establish relationships between treatment modalities and background diseases. The data, sourced exclusively from medical records, may not comprehensively capture factors such as patient adherence to medication and lifestyle changes, which significantly influence the management of diabetes, however, the absence of treatment intensification was very high which could not be explained by poor adherence of patients with relatively good adherence to baseline two OAD's. Additionally, as the study was conducted within a singular healthcare system, the results may not be universally applicable to other settings with different healthcare infrastructures, however, GLP1-RA's are affordable and reimbursed in this cohort, and the international guidelines in 2017/2018 [15] supported the immediate intervention of healthcare providers in cases of uncontrolled diabetes and supported the early use of effective treatment like GLP1-RA in those uncontrolled and overweight patients. The analysis was further limited by the small number of patients attending specialized diabetic clinics, which restricted the potential for conducting detailed subgroup analyses to assess the impact of specialized care, however, it reflects the reality of the limited capacity of diabetes consultations in the area where this study was performed. Moreover, important socioeconomic and educational factors, which can affect treatment choices and outcomes, were not available in the dataset used for analysis.
Conclusions
This study highlights a high prevalence of clinical inertia in type 2 diabetes management within primary care, with nearly half of uncontrolled patients failing to receive therapy intensification within up to 18 months. Data analysis reveals a notable underutilization of GLP-1RAs; despite their proven cardiovascular and glycemic benefits, they represented a small fraction of the intensification choices compared to older agents. This suggests that clinical inertia is not only a delay in timing but also a failure to adopt evidence-based, newer therapeutic classes.
Several limitations must be acknowledged. First, the retrospective nature of this study relies on pharmacy claims data, which may not fully capture patient adherence or the specific clinical reasoning behind a physician's decision to withhold intensification. Second, the study was conducted between 2017 and 2018; while this captures the era of GLP-1RA introduction, it does not reflect the most recent shifts in practice following the widespread adoption of SGLT2 inhibitors and oral GLP-1RAs. Finally, the small sample size of patients managed in specialized diabetes clinics limited our ability to compare primary vs. specialty care outcome.
Despite these limitations, the findings underscore an urgent need for targeted interventions to assist general practitioners in overcoming therapeutic inertia and optimizing the use of modern antidiabetic agents to improve long-term patient outcomes.
Acknowledgements
The authors would like to thank Michael Hopp who collaborated with the study in terms of statistical analysis and epidemiology.
Data Availability
All data supporting the findings and datasets generated during the current study are available from the corresponding author upon reasonable request.
Funding
This project has received funding from Clalit Health Services.
Contribution Statement
RT conceptualized and planned the study. JB and EA performed data acquisition and analysis with the help of Michael Hopp. JB and EA created the figures and tables. RT also provided guidance on the workflow and interpretation of the study. RT and JB wrote the first draft of the manuscript.
Conflicts of Interest
There are no relevant conflicts of interest to disclose.
References
2. Holman RR, Paul SK, Bethel MA, Matthews DR, Neil HA. 10-year follow-up of intensive glucose control in type 2 diabetes. N Engl J Med. 2008 Oct 9;359(15):1577–89.
3. Inzucchi SE, Bergenstal RM, Buse JB, Diamant M, Ferrannini E, Nauck M, et al. Management of hyperglycaemia in type 2 diabetes: a patient-centered approach. Position statement of the American Diabetes Association (ADA) and the European Association for the Study of Diabetes (EASD). Diabetologia. 2012 Jun;55(6):1577–96.
4. Strain WD, Cos X, Hirst M, et al. Time to do more: Addressing clinical inertia in the management of type 2 diabetes mellitus. Diabetes Res Clin Pract. 2014;105(3):302–12.
5. Reach G. Clinical inertia, uncertainty and individualized guidelines. Diabetes Metab. 2014 Sep;40(4):241–5.
6. ElSayed NA, Aleppo G, Aroda VR, Bannuru RR, Brown FM, Bruemmer D, et al. Introduction and Methodology: Standards of Care in Diabetes–2023. Diabetes Care. 2023 Jan 1;46(Suppl 1):S1–S4.
7. Grant RW, Wexler DJ, Watson AJ, Lester WT, Cagliero E, Campbell EG, et al. How doctors choose medications to treat type 2 diabetes: a national survey of specialists and academic generalists. Diabetes Care. 2007 Jun;30(6):1448–53.
8. Walker RJ, Strom Williams J, Egede LE. Influence of Race, Ethnicity and Social Determinants of Health on Diabetes Outcomes. Am J Med Sci. 2016 Apr;351(4):366–73.
9. Paul SK, Klein K, Thorsted BL, Wolden ML, Khunti K. Delay in treatment intensification increases the risks of cardiovascular events in patients with type 2 diabetes. Cardiovasc Diabetol. 2015 Aug 7;14:100.
10. Arnold SV, Tang F, Cooper A, Chen H, Gomes MB, Rathmann W, et al. Global use of SGLT2 inhibitors and GLP-1 receptor agonists in type 2 diabetes. Results from DISCOVER. BMC Endocr Disord. 2022 Apr 26;22(1):111.
11. Fu AZ, Sheehan JJ. Treatment intensification for patients with type 2 diabetes and poor glycaemic control. Diabetes Obes Metab. 2016 Sep;18(9):892–8.
12. Lin J, Zhou S, Wei W, Pan C, Lingohr-Smith M, Levin P. Does clinical inertia vary by personalized A1c goal? A study of predictors and prevalence of clinical inertia in a u.s. managed-care setting. Endocr Pract. 2016 Feb;22(2):151–61.
13. Maguire A, Douglas I, Smeeth L, Thompson M. Determinants of cholesterol and triglycerides recording in patients treated with lipid lowering therapy in UK primary care. Pharmacoepidemiol Drug Saf. 2007;16(2):228.
14. Pantalone KM, Misra-Hebert AD, Hobbs TM, Ji X, Kong SX, Milinovich A, et al. Clinical Inertia in Type 2 Diabetes Management: Evidence From a Large, Real-World Data Set. Diabetes Care. 2018 Jul;41(7):e113–e114.
15. Davies MJ, D'Alessio DA, Fradkin J, Kernan WN, Mathieu C, Mingrone G, et al. Management of Hyperglycemia in Type 2 Diabetes, 2018. A Consensus Report by the American Diabetes Association (ADA) and the European Association for the Study of Diabetes (EASD). Diabetes Care. 2018 Dec;41(12):2669–701.