Abstract
Background: This study investigates the role of Calcium Homeostasis Modulator 6 (CALHM6) in immune regulation during SARS-CoV-2 infection, with the aim of exploring its potential as a prognostic marker.
Methodology: Peripheral blood mononuclear cells (PBMCs) from 42 SARS-CoV-2 positive patients and 19 healthy controls were analyzed for CALHM6 expression. Clinical data were collected from patients admitted with low oxygen saturation (≤90%) and severe symptoms, and RNA was extracted at admission. Additionally, 18 SARS-CoV-2 positive patients were followed every two days, with RNA extracted on Days 1, 3, 5, 7, and 9 until they either succumbed or were discharged. CALHM6 expression was measured using RT-PCR and the 2−ΔΔCt method, and serum samples from eight SARS-CoV-2 positive and negative individuals were analyzed via ELISA.
Results: Out of the forty-two included patients, thirty (n=30) succumbed to SARS-CoV-2 (71.42%). Results revealed a significant reduction in CALHM6 mRNA expression in SARS-CoV-2 positive patients compared to healthy controls (p<0.0001) via qRT-PCR. This downregulation was consistent when CALHM6 levels were quantified using an ELISA kit (p=0.0025 **). Notably, 80% of discharged patients exhibited elevated CALHM6 expression at follow-up, and all showed an increase in expression at their final follow-up compared to Day 1. Moreover, the expression level of CALHM6 was elevated on the final follow-up of all discharged patients (100%, n=5) in comparison with the prior successive reading, meriting CALHM6 as a critical immune modulator. Out of the thirteen deceased patients during follow-ups (n=13), the expression level of CALHM6 decreased in eight patients and increased in five patients compared to their prior successive reading.
Conclusion: Our research is the first to demonstrate the association between CALHM6 and SARS-CoV-2. Further studies are needed to explore its potential as a therapeutic target for modulating immune response and calcium homeostasis to improve SARS-CoV-2 outcomes.
Keywords
SARS-CoV-2, CALHM6, ROS, Calcium homeostasis, ARDS, Immune modulator, Follow-up
Introduction
The novel coronavirus SARS-CoV-2 has been one of the deadliest combined health and economic crisis of this century, affecting imbalances in ACE2 and lead to hyper-inflammatory immune responses within the host, which can severely amplify comorbidities [1]. The clinical spectrum of SARS-CoV-2 differs significantly, with many patients developing severe complications such as acute respiratory distress syndrome (ARDS), multi-organ failure or cytokine storm syndrome (CSS), resulting in more adverse outcomes [2]. It is still very much blurred what leads to this varied progression of the disease, but they likely involve exaggerated neutrophils extracellular traps (NETS), delayed type I interferon response, pyroptosis, and delayed and impaired virus clearance [3]. In addition, SARS-CoV-2 pathogenesis is profoundly impacted by oxidative stress associated with cell activation [4]. Coronaviruses, amongst other viruses have been reported to adversely affect host’s calcium signaling mechanism. A study reports that envelope protein (E) of SARS coronavirus (SARS-CoV-2) plays its part in activating NLRP3 inflammasome, which in turn is facilitated by E protein as a Ca2+ channel. This allows calcium flux in Golgi membranes and Endoplasmic Reticulum-Golgi intermediate compartment (ERGIC), leading to adverse inflammatory responses and contributing to the pathogenesis of viral infections [5]. As the global research is expanding our understanding of SARS-CoV-2’s pathogenesis, several vaccines have been able to mitigate the spread and severity of the disease. However, we are witnessing vaccine skepticism, persistent infections amongst vaccinated and risk of variants leading to alternative approached for combating SARS-CoV-2. The high-priority is to understand the pathogenesis of SARS-CoV-2 and be able to use effective treatment regimens, and foresee a patient outcome has led researchers to look into various alternatives and biomarkers. Given established role of calcium signaling in multiple viral infections, it demonstrates a promising focus for further prognostic and therapeutic research [6].
The Calcium Homeostasis Modulator Family Member 6 (CALHM6) is gaining recognition for its role in immune regulation. It contains a conserved Ca_hom-mod domain and is functionally linked to calcium-binding proteins, with its expression influenced by cytosolic calcium disturbances [7,8]. Studies using whole transcriptome analyses have revealed differential expression of CALHM6 in various viral infections (such as SIV and HBV (Hepatitis B virus)) [9,10], bacterial (such as Septicemicmelioidosis, Staphylococcal Superantigens, also Staphylococcal Enterotoxin B) [11–13] and parasitic infections, as well as in liver transplantation and several cancers (including breast, mammary gland, cervix, and uterus) [14,15]. CALHM6 has been found to correlate with overall viral load in SIV-infected Rhesus macaques, suggesting its potential as an early prognostic marker for the rate and strength of antiviral immune responses [10]. In HCV (Hepatitis C virus) patients, CALHM6 was identified as one of 91 differentially expressed genes linked to HCV clearance [10]. A study examining the association between CALHM6 and HBV infection suggests that reduced CALHM6 expression levels in HBV patients compared to controls could serve as a key predictive marker for infection [7]. In the placental transcriptome of Villitis of Unknown Etiology (VUE), CALHM6 was similarly found to be considerably up regulated alongside numerous chemokines, MHC class I, and MHC class II molecules, where its expression rose in accordance with the intensity of the inflammatory response [16]. Collectively, these findings indicate that investigating the Ca2+ pathways could provide valuable insights into the unexplored association between CALHM6 and SARS-CoV-2.
The SARS-CoV-2 disease spectrum varies with age and comorbidities, affecting its manifestation. Biomarkers are crucial for early detection, diagnosis, and monitoring, serving as diagnostic and prognostic indicators of disease severity, especially in low-resource settings. This study proposes a potential relationship between SARS-CoV-2 and CALHM6 expression, suggesting that SARS-CoV-2-induced inflammation might influence CALHM6 production. CALHM6, an important regulator and activator of the innate immune response, is integral to immune signaling pathways. Investigating its expression during SARS-CoV-2 infection and its correlation with disease progression could provide valuable insights. Furthermore, CALHM6 expression might serve as an early predictive marker for SARS-CoV-2. This study aims to shed light on the previously unnoticed association of CALHM6 with SARS-CoV-2. Understanding these novel immune mechanisms and responses and their variation with diseases progression can open new avenues for therapeutic and prognostic marker approaches for existing as well as future infection and pandemics.
Materials and Methods
Ethical statement
The study received approval from the Departmental Ethical Review Board of Mardan Medical Complex and the Institutional Review Board (IRB) of Atta Ur Rahman School of Applied Biosciences (ASAB), NUST, Islamabad, Pakistan. All participating patients and their legal guardians provided written informed consent, with assurances that individual participant data would remain confidential.
Study subjects
The experimental group consisted of 42 patients with severe SARS-CoV-2 infection who were admitted at Mardan Medical Complex from December 2021–February 2022. Patients tested positive for SARS-CoV-2 via RT-PCR and demonstrated commonly associated symptoms of SARS-CoV-2 such as fever, sore throat, dropping oxygen saturation levels (≤ 90%) and chills (Table 1). Clinical data including age, gender, and saturation level was recorded on Day 1 of admission. All those patients who showed no signs of associated symptoms (asymptomatic) were excluded from the study. For the control group, blood samples from 19 patients tested negative for SARS-CoV-2 and having no history of using tobacco or related products were taken as healthy/negative controls. Moreover, eighteen patients were followed up, and RNA was extracted every alternate day until the patient either succumbed to SARS-CoV-2 or was discharged from hospital. The follow-up days were scheduled specifically on Day 1, Day 3, Day 5, Day 7, and Day 9.
|
Age group |
Distribution – No. (%) |
Discharged Patients |
Deceased Patients |
|
20 to 40 years |
3 (7.1) |
1 |
2 |
|
40 to 60 years |
19 (45.23) |
7 |
12 |
|
60 to 80 years |
16 (38.09) |
4 |
12 |
|
>80 years |
4 (9.52) |
0 |
4 |
|
Gender |
Distribution– No. (%) |
Discharged Patients |
Deceased Patients |
|
Male |
14 (33.33) |
4 |
10 |
|
Female |
28 (66.67) |
8 |
20 |
Follow-up of patients for determining changes in CALHM6 expression during hospitalization
To measure the changes/variation in expression of CALHM6 during diseases progression, eighteen patients were monitored until either they were deceased or discharged from the hospital (Figure 1). Blood samples were collected every 48 hours until patients were discharged from the hospital or deceased, with 18 patients meeting the specified criteria for follow-up.
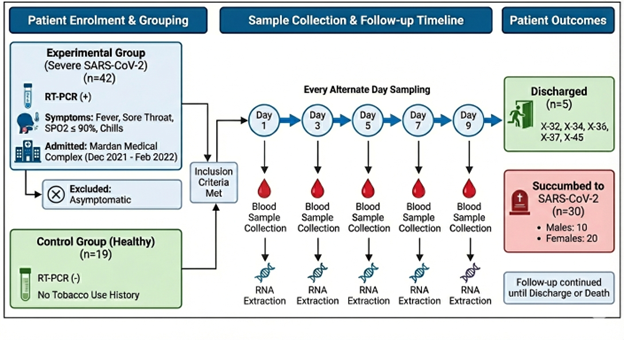
Figure 1. Schematic illustration of the follow-up process for patients who met the inclusion criteria. The study involved an experimental group of 42 patients admitted to Mardan Medical Complex (December 2021–February 2022) with confirmed severe SARS-CoV-2 infection (RT-PCR positive) and associated symptoms. A control group consisting of 19 healthy, SARS-CoV-2 negative individuals with no history of tobacco use was also established. A subset of eighteen patients underwent longitudinal monitoring, where blood samples were collected and RNA was extracted starting on Day 1 and continuing every alternate day (Days 3, 5, 7, and 9).
RNA extraction and downstream processing
RNA extraction of all SARS-CoV-2-positive samples was initiated at Abdul Wali Khan University Mardan. RNA extraction was performed using RBC lysis buffer pH 7.3 (17.98 g NH4Cl, 2g KHCO3, 400 μL 0.5 M EDTA in 200 mL total volume) and SolarbioTriquick Reagent R1100. 5 mL of blood was mixed with 25 mL RBC lysis buffer, incubated for 10 minutes, and then centrifuged. The supernatant was discarded, and the pellet was resuspended in 1 mL lysis buffer and incubated at room temperature for 5 minutes. After a second centrifugation, the white blood cells pellet was resuspended in 1 mL PBS, centrifuged again, and the final pellet was resuspended in 1 mL SolarbioTriquick Reagent R1100. The successfully extracted white blood cells with added SolarbioTriquick Reagent R1100 were stored at -80°C and transported to ASAB, NUST Islamabad after 3 days for further processing.
The samples received were thawed properly and mixed with 200 μL chloroform and vortexed for 30 seconds. Then, this mixture was incubated at -20°C for 3 minutes and centrifuged at 12,000 rcf for 10 minutes at 4°C. Aqueous phase was meticulously transferred to new microcentrifuge tube and 500 μL of isopropanol was added. This mixture was inverted several times and then incubated at -20°C for 10 minutes. Afterwards, this mixture was centrifuged at 12,000 rcf for 10 minutes at 4°C. Supernatant was discarded and pellet was washed with 1 mL 75% ethanol. Centrifuge was performed at 12,000 rcf for 2 minutes at 4°C. Supernatant was discarded and final RNA pellet was dried in sterile conditions at 4°C for 10 minutes before final suspension in nuclease free water. Presence of RNA was confirmed first using Berthold Detection Systems GmbH, Pforzheim (A 260/280 ratio of nearly 1.8 to 2 indicated RNA purity) and then denaturing gel electrophoresis performed at 90 V, 90 mA for 50 minutes (Figure 2).
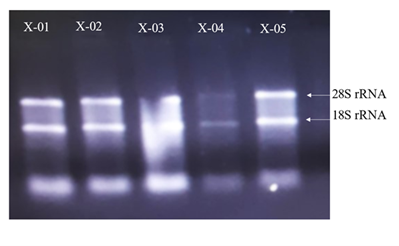
Figure 2. RNA denaturing gel. The gel was run to assess the integrity and purity of the RNA extracted from SARS-CoV-2 (+) patients. The distinct bands correspond to the 28S and 18S rRNA.
cDNA synthesis
The quantification of extracted RNA was performed using a photometer, and 1 μg of RNA was employed for cDNA synthesis. The RevertAid First Strand cDNA Synthesis Kit (Cat#K1622) Thermo Fisher Scientific was utilized for synthesizing cDNA as per the manufacturer's instructions. Subsequently, the cDNA was diluted 1:10 for subsequent downstream experiments.
Real-time PCR analysis
The RNA levels of each gene were assessed using real-time quantitative reverse transcription PCR (qRT-PCR) with the Solis BioDyne 5X HOT FIREPol®EvaGreen® qPCR Mix Plus (ROX) (Cat # 08-24-00001) in the final concentration of 1X, 5 pmol of forward and reverse primers, 250 ng of cDNA in a reaction volume of 20 μL. Real-time PCR was performed at 95°C initial activation for 12 minutes, followed by 40 cycles of 95°C denaturation for 15 seconds, annealing at 60°C for 20 seconds, and extension at 72°C for 20 seconds. Primer pairs for the target genes were designed using Primer3 software, targeting Homo sapiens calcium homeostasis modulator family member 6 (CALHM6), transcript variant 2, mRNA, and Homo sapiens CALHM6, transcript variant 1, mRNA. These primers were then optimized through gradient PCR to determine their optimal annealing temperature. The primer sets used for qRT-PCR included: CALHM6 forward primer: 5'-TGTTGGGCTGGATCTTGATAG-3', CALHM6 reverse primer: 5'-GCTCCTGTTCCAAATAGATTTTCC-3', GAPDH forward primer: 5'-CCTGCACCACCAACTGCTTA-3', and GAPDH reverse primer: 5'-CATGAGTCCTTCCACGATACCA-3'. The ABI PRISM 7000 Sequence Detection System (Applied Biosystems) was employed for real-time qPCR analysis. Gene copy number for CALHM6 was calculated for each sample following real-time PCR analysis, using the provided formula.
Copy number = 100 × 2 –ΔCt
The 2−ΔΔCT method is used for quantification of relative gene expression where Ct denotes the threshold cycle and 〖ΔC〗t represents the difference between the reference gene and the target gene. The ΔΔCT is the difference in 〖ΔC〗t between the control and experimental group providing fold changes in gene expression.
ELISA
The expression level of CALHM6 was quantified by Human FAM26F ELISA Kit (https://www.biobool.com/elisa_kit/14259.html, Catalog # E014259). The instruction manual was followed for quantification of CALHM6.
Statistical analysis
Statistical analysis was conducted using GraphPad Prism 6.0 software (GraphPad Software, San Diego, CA, USA). All experiments were performed with appropriate biological replicates, and data are presented as mean ± SD. Statistical significance was determined using a two-tailed nonparametric Mann–Whitney U test for comparisons between SARS-CoV-2-positive and SARS-CoV-2-negative groups, with p<0.05 considered statistically significant (*p<0.05, **p<0.01, ***p<0.001).
Results
Demographic profile
From December 2021–February 2022, 42 admitted patients were included in the study, after they were diagnosed SARS-CoV-2 positive through RT-PCR testing. The majority of the patients were between 40 to 60 years age (45.23%), followed by the age group 60 to 80 years (38.09%). Females were the majority group comprising 66.67% of the population (Table 1).
The majority of the patients (n=30) died in the hospital with SARS-CoV-2 as the primary cause of death. None of the four patients, above the age of 80 years, could survive. Amongst the age group 60–80, twelve were deceased and four were discharged from the hospital. Similarly, twelve patients in the age group 40–60 were deceased and four were discharged. In the age group 20 to 40 years, one patient survived and two were deceased. Males and females exhibited a comparable mortality trend with 10 out of 14 males and 20 out of 28 females succumbing to the SARS-CoV-2.
Assessment of CALHM6 expression via (qRT-PCR)
CALHM6 expression was assessed via qRT-PCR in SARS-CoV-2-positive (n=42) and SARS-CoV-2-negative patients (n=19). The analysis revealed a significant downregulation of CALHM6 in SARS-CoV-2-positive patients (p<0.0001****, Mann Whitney Test) compared to the control group (Figure 3). These findings indicate a notable reduction in CALHM6 expression among infected individuals.
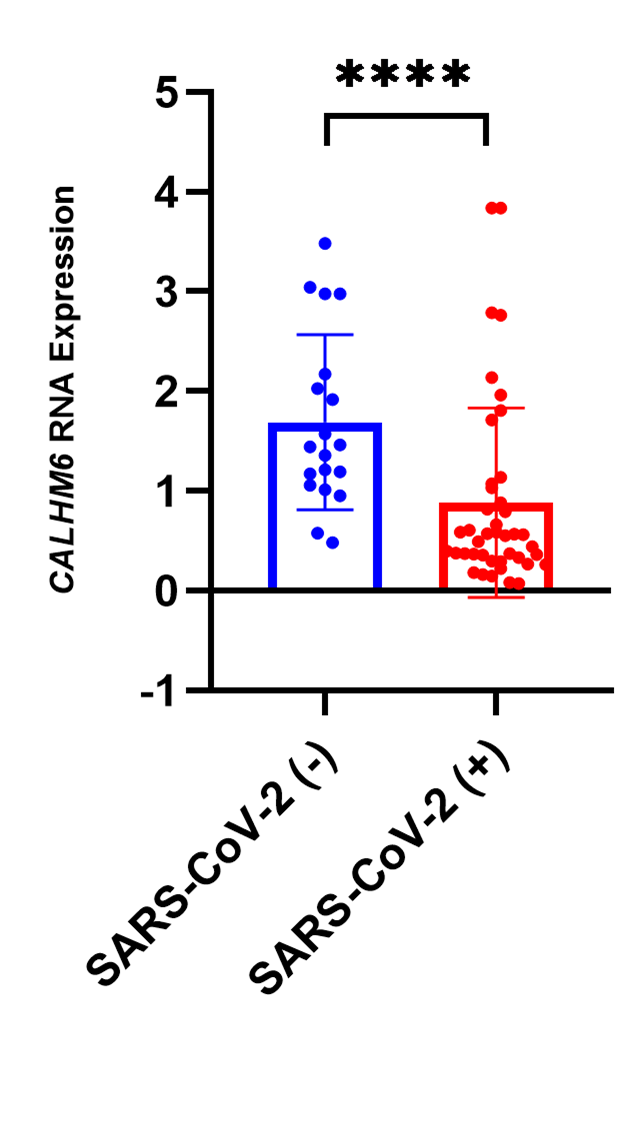
Figure 3. Fold change in CALHM6 mRNA levels in SARS-CoV-2 (+) & SARS-CoV-2 (-) individuals. The mRNA expression of CALHM6 was analyzed in SARS-CoV-2 (+) patients (n=42) and SARS-CoV-2 (-) individuals (n=19). CALHM6 was found to be significantly downregulated in SARS-CoV-2(+) patients compared to the SARS-CoV-2 (-) individuals (p<0.0001****). The X-axis represents the groups of individuals, while the Y-axis displays the relative mRNA expression levels of CALHM6. Statistical significance was determined using the two-tailed nonparametric Mann Whitney U test.
Quantification of CALHM6 in serum samples via ELISA
CALHM6 expression was assessed via ELISA in SARS-CoV-2 (+) patients (n=8) and SARS-CoV-2-negative patients (n=8). The analysis revealed a significant downregulation of CALHM6 in SARS-CoV-2-positive patients (p=0.0047**, Mann Whitney Test) compared to the control group (Figure 4) in line with qRT PCR findings. This confirms the in vivo reduction of both CALHM6 mRNA and protein expression following infection.
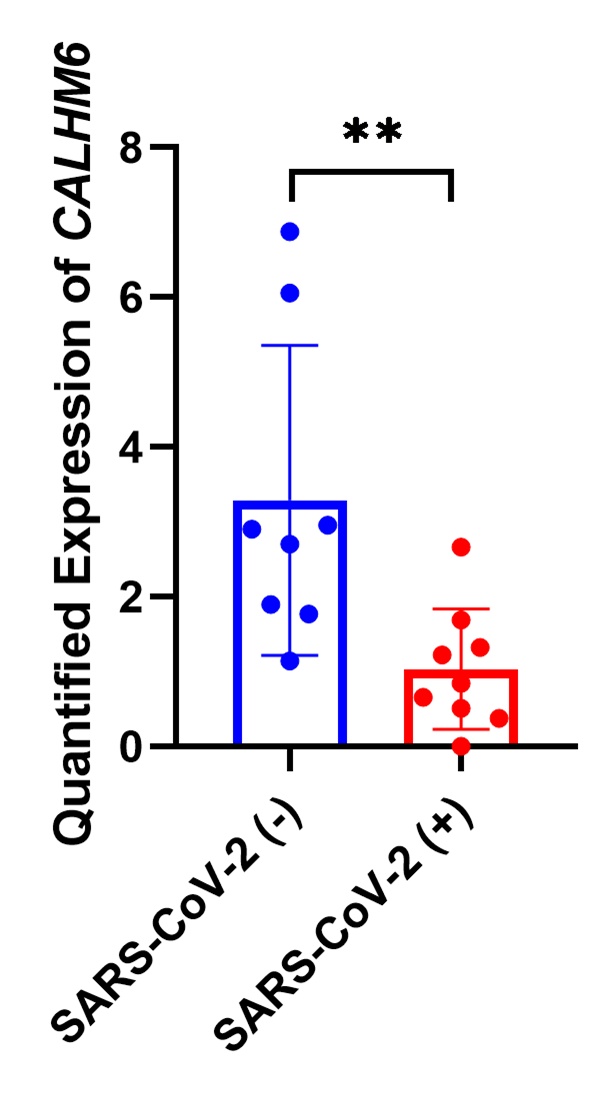
Figure 4. Fold change in CALHM6 protein expression in SARS-CoV-2 (+) & SARS-CoV-2 (-) individuals. The protein expression of CALHM6 in SARS-CoV-2 (+) patients (n=9) and SARS-CoV-2 (-) individuals (n=8) was quantified using Human FAM26F ELISA Kit. CALHM6 was found to be significantly downregulated in SARS-CoV-2 (+) patients compared to the SARS-CoV-2 (-) individuals (p=0.0025**). The X-axis represents the groups of individuals, while the Y-axis displays the protein expression values of CALHM6 (ng/L). Statistical significance was determined using the two-tailed nonparametric Mann Whitney U test.
Follow-up of SARS-CoV-2infected patients for assessment of CALHM6 expression levels
Throughout the follow up period, out of eighteen in total, five patients (X-32, X-34, X-36, X-37 and X-45) were discharged from the hospital, and the rest succumbed to the virus. The qRT-PCR analysis was done to compare the expression of CALHM6 throughout the follow up period. On Day 3, six patients expired (X-28, X-29, X-30, X-31, X-33 and X-35) and two patients (X-32 and X-34) were discharged from the hospital (Figures 5a and 5b). Elevated levels of CALHM6 were observed on Day 3on follow-up of the surviving patients (0.53 and 23.67) compared to Day 1 (0.49 and 0.61). On Day 5, four patients (X-38, X-39, X-40 and X-41) expired and X-36 and X-37 were discharged from the hospital. X-36 and X-37 exhibited decreased levels of CALHM6 on Day 3 (0.26 and 0.01) compared to Day 1 (0.79 and 0.15), however both the patients recorded an increase in CALHM6 level on Day 5 (0.57 and 2.59) (Figure 5c and 5d). Additionally, three patients (X-42, X-43 and x-44) made it to Day 5, however none of them could survive and all were recorded to have fluctuating CALHM6 levels (Figure 5e). Only X-45 reached Day 9 (Figure 5f), showing elevated levels of CALHM6 on Day 3 (0.93) and Day 5 (1.18), followed by a sharp decrease on Day 7 (0.42) and a sudden spike on Day 9 (2.52), compared to Day 1 (0.37). On the final day of their respective follow-ups, four out of five (80%) discharged patients exhibited elevated expression of CALHM6 (Figure 6). Specifically, patient X-32 showed an increase from 0.49 on Day 1 to 0.53 on Day 3. Patient X-34 had a significant rise from 0.61 on Day 1 to 23.67 on Day 3. Patient X-37’s CALHM6 expression increased from 0.15 on Day 1 to 2.59 on Day 5. Lastly, patient X-45 exhibited a marked increase from 0.37 on Day 1 to 2.52 on Day 9. Only X-36 was reported to have lower CALHM6 level on Day 5 (0.57), compared to Day (0.79).
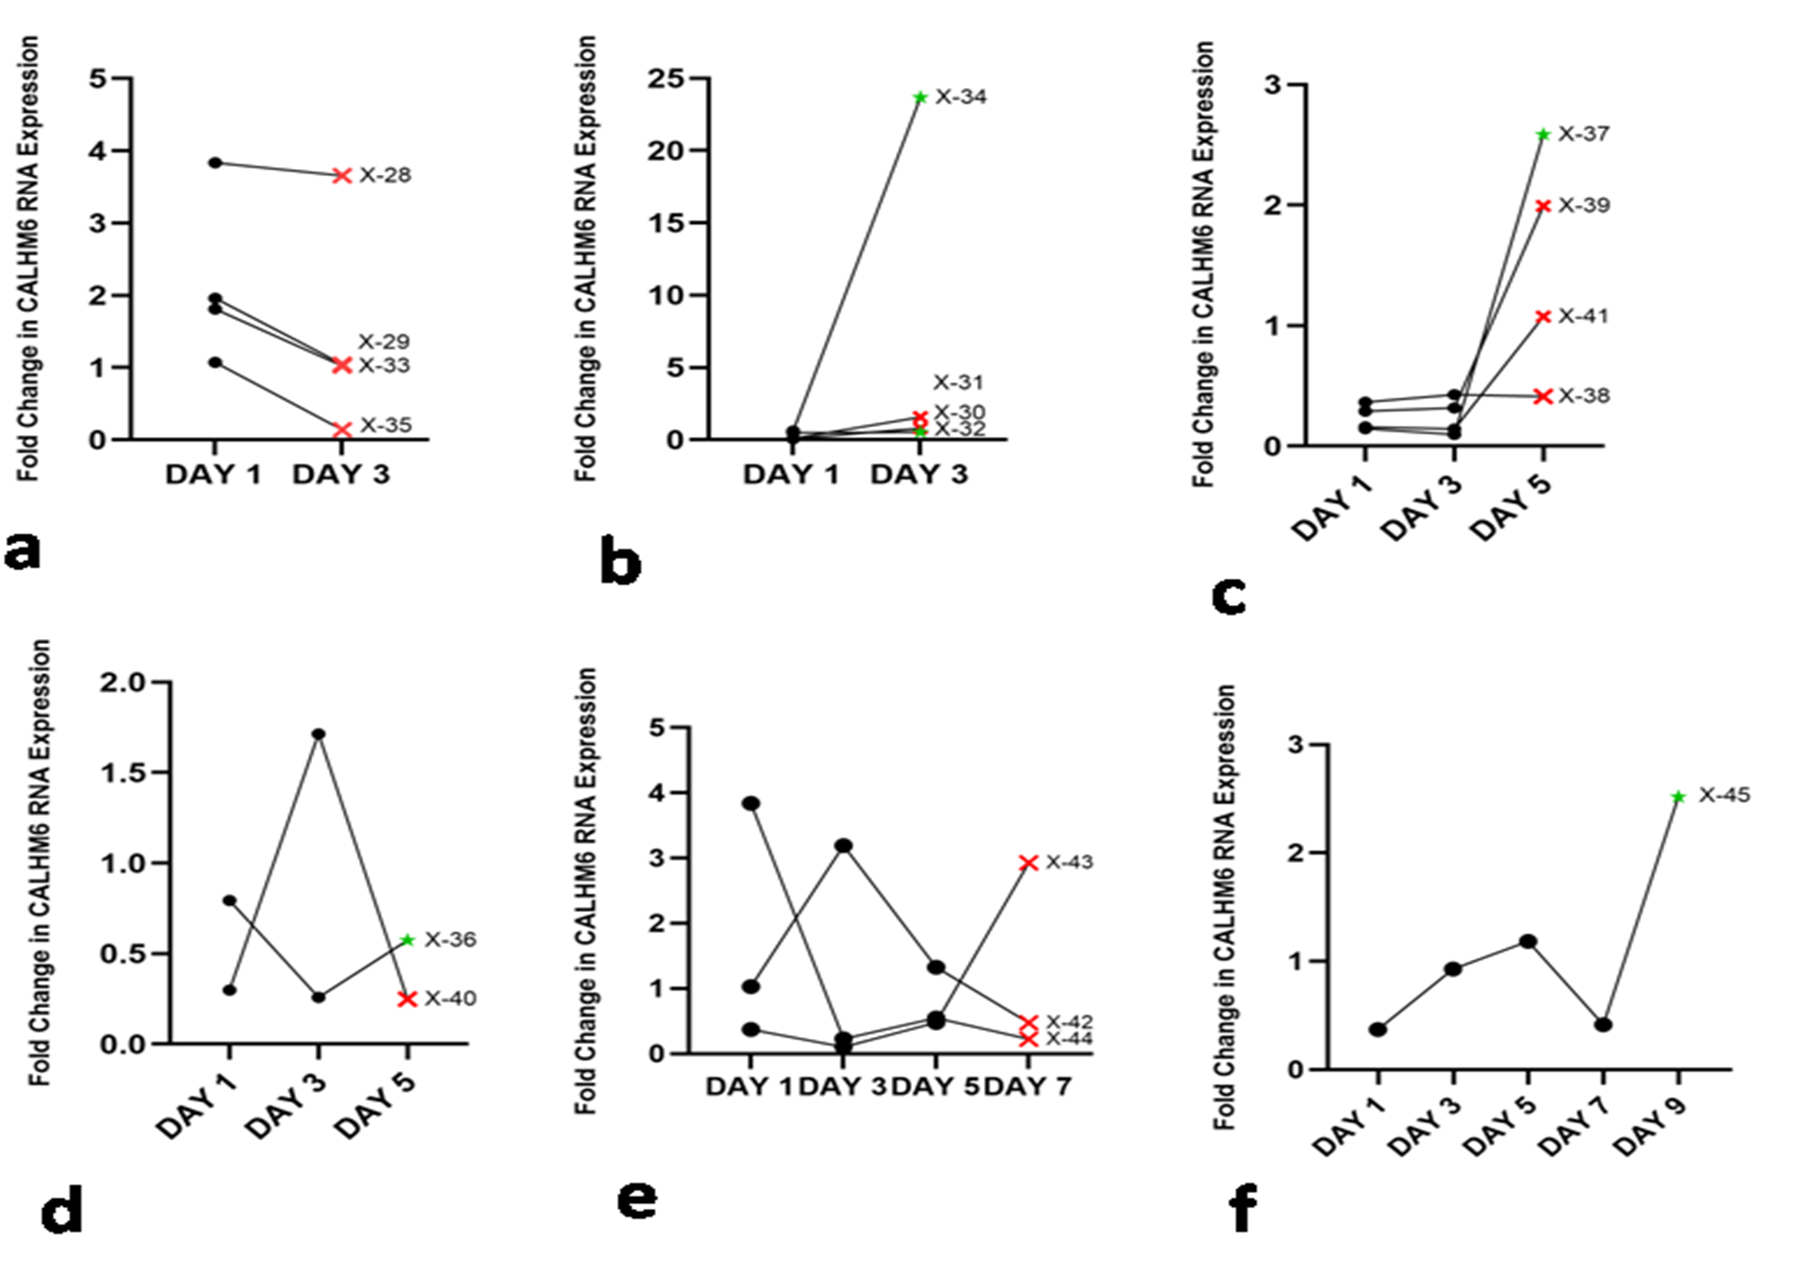
Figure 5. CALHM6 expression (qRT-PCR) on alternate days of hospitalization. The X-axis denotes days of hospitalization, while the Y-axis represents the fold change in CALHM6 mRNA expression. The follow up continued until the patients passed away (depicted as Red Cross) or were discharged from the hospital (depicted as green star). Panel (a) illustrates the fold change in CALHM6 mRNA level on Day 3 of hospitalization where the expression of CALHM6 in PBMCs of deceased X-28, X-29, X-33, and X-35 decreased on Day 3. Panel (b) indicates elevated CALHM6 expression in PBMCs of X-32 and X-34, resulting in discharge from the hospital. However, patients X-30 and X-31 also exhibited increased CALHM6 expression but did not survive. Panel (c) and (d) illustrate the fold change in CALHM6 mRNA level on Day 3 and Day 5 of hospitalization. In panel (c), the expression of CALHM6 in PBMCs of X-36 decreased on Day 3 and increased on Day 5, and the patient was discharged from the hospital. The expression of CALHM6 in PBMCs of X-40 increased on Day 3 and abruptly decreased on Day 5, the patient succumbed to the disease. Panel (d) shows that on Day 5, the expression of CALHM6 in PBMCs of X-37, X-38, X-39, and X-41 increased compared to Day 1, with only X-37 being discharged from the hospital. Panel (e) depicts the fold change in CALHM6 mRNA level on Days 3, 5, and 7 of hospitalization. On Day 7, the expression of CALHM6 in PBMCs of X-42 and X-44 decreased to the minimum levels compared to Day 1, while it increased in X-43. Fluctuating trend was observed throughout the follow-up and none of the patients survived. Panel (f) illustrates the expression of CALHM6 in PBMCs of X-45, which increased on Day 3 and Day 5; however, there was a sudden decrease on Day 7 and an abrupt elevation on Day 9 and the patient was discharged from the hospital.
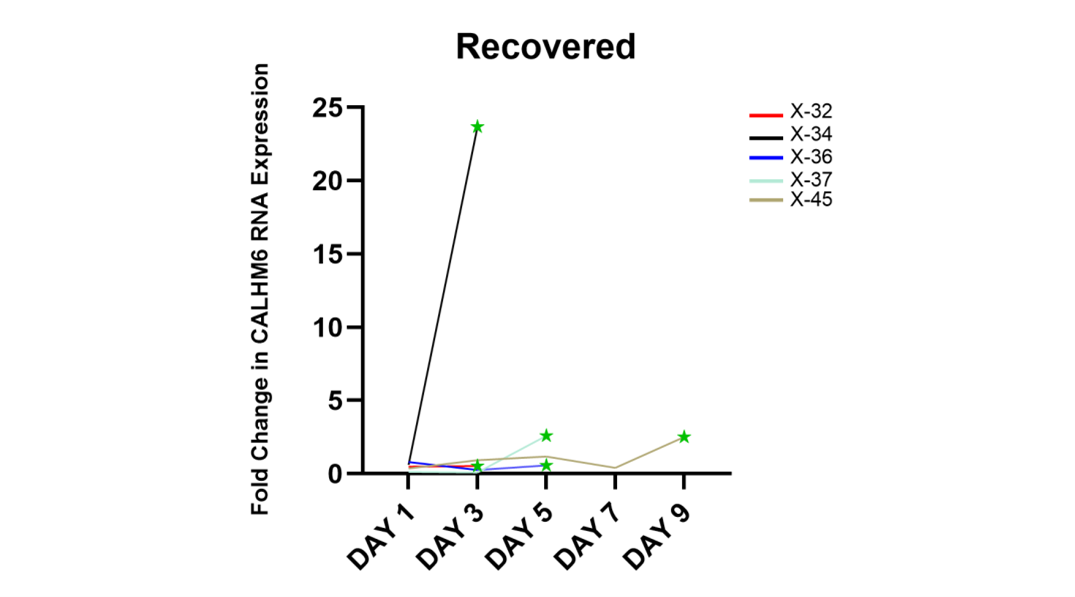
Figure 6. CALHM6 expression levels in PBMCs of discharged patients on alternate days of hospitalization (qRT-PCR). The figure depicts the CALHM6 mRNA level in PBMCs of patients who were discharged from the hospital. X-32 and X-34 exhibited increased expression on Day 3 (0.49 to 0.53 and 0.60 to 23.66). Patient X-36 showed an overall decreased expression on Day 5 (0.79 to 0.57) compared to Day 1, while X-37 displayed elevated expression of CALHM6 on Day 5 compared to Day 1 (0.14 to 2.58). Patient X-45 demonstrated maximum expression of CALHM6 on Day 9 compared to Day 1 (0.37 to 2.51).
Comparison of CALHM6 mRNA Levels (qRT-PCR) on the penultimate and final days of respective follow-ups
The expression level of CALHM6 in PBMCs of all discharged patients elevated on the final follow-up in comparison with the prior successive reading (Figure 7). Increased levels of CALHM6 were noted on the final day of follow-up, Day 3, in both patients X-32 and X-34 (0.53 and 23.67) compared to the prior successive reading on Day 1 (0.49 and 0.60). For patients X-36 and X-37, the expression of CALHM6 depreciated on Day 3 (0.26 and 0.099 respectively) compared to Day 1 (0.79 and 0.15). Nevertheless, on the next successive reading on Day 5, there was an elevation in the levels of CALHM6 (0.57 and 2.59). Similarly, X-45 exhibited elevated levels of CALHM6 on Day 7 (2.52), compared to the prior successive reading on Day 7 (0.42).
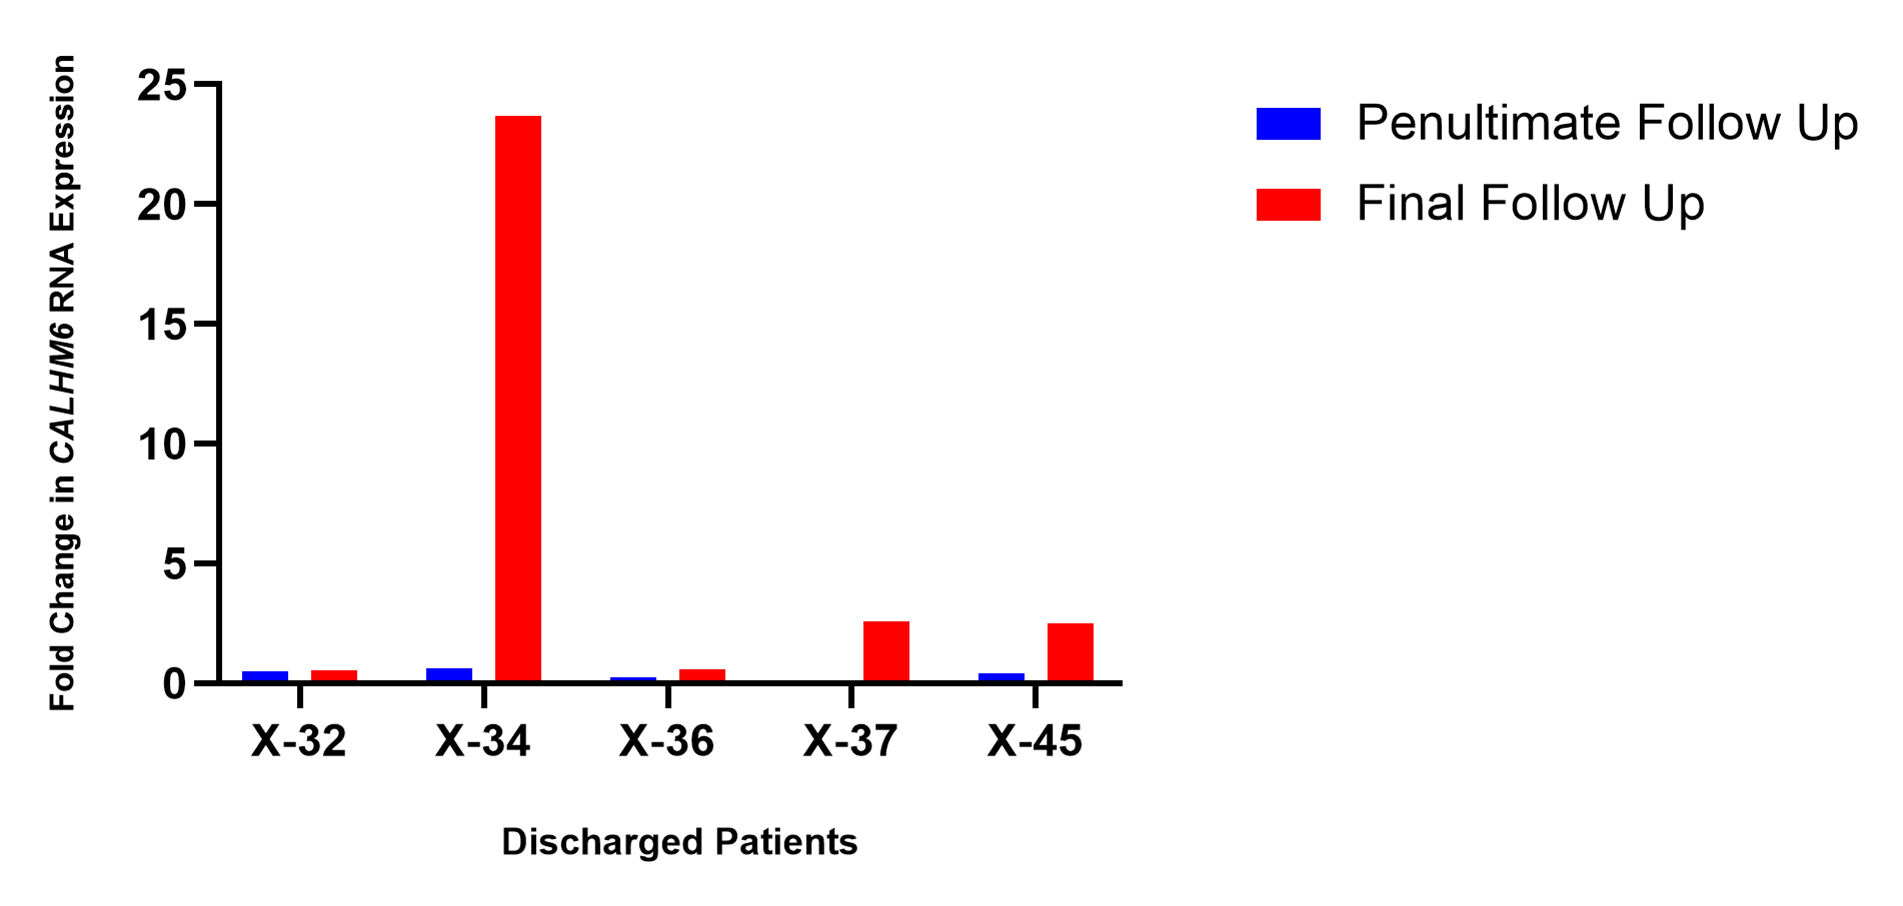
Figure 7. CALHM6 expression levels in PBMCs of discharged patients on penultimate day and final day of hospitalization (qRT-PCR). The expression of CALHM6 in PBMCs of all discharged patients X-32, X-34, X-36, X-37 and X-45 increased compared to prior successive reading.
As demonstrated in Figure 8, the expression level of CALHM6 in PBMCs of eight patients (X-28, X-29, X-33, X-35, X-38, X-40, X-42, and X-44), who succumbed to SARS-CoV-2, depreciated on the final day of their respective follow-ups compared to previous successive reading (61.53%). However, five deceased patients (X-30, X-31, X-39, X-41 and X-43) recorded an increase in CALHM6 levels on the final day of their respective follow-ups.
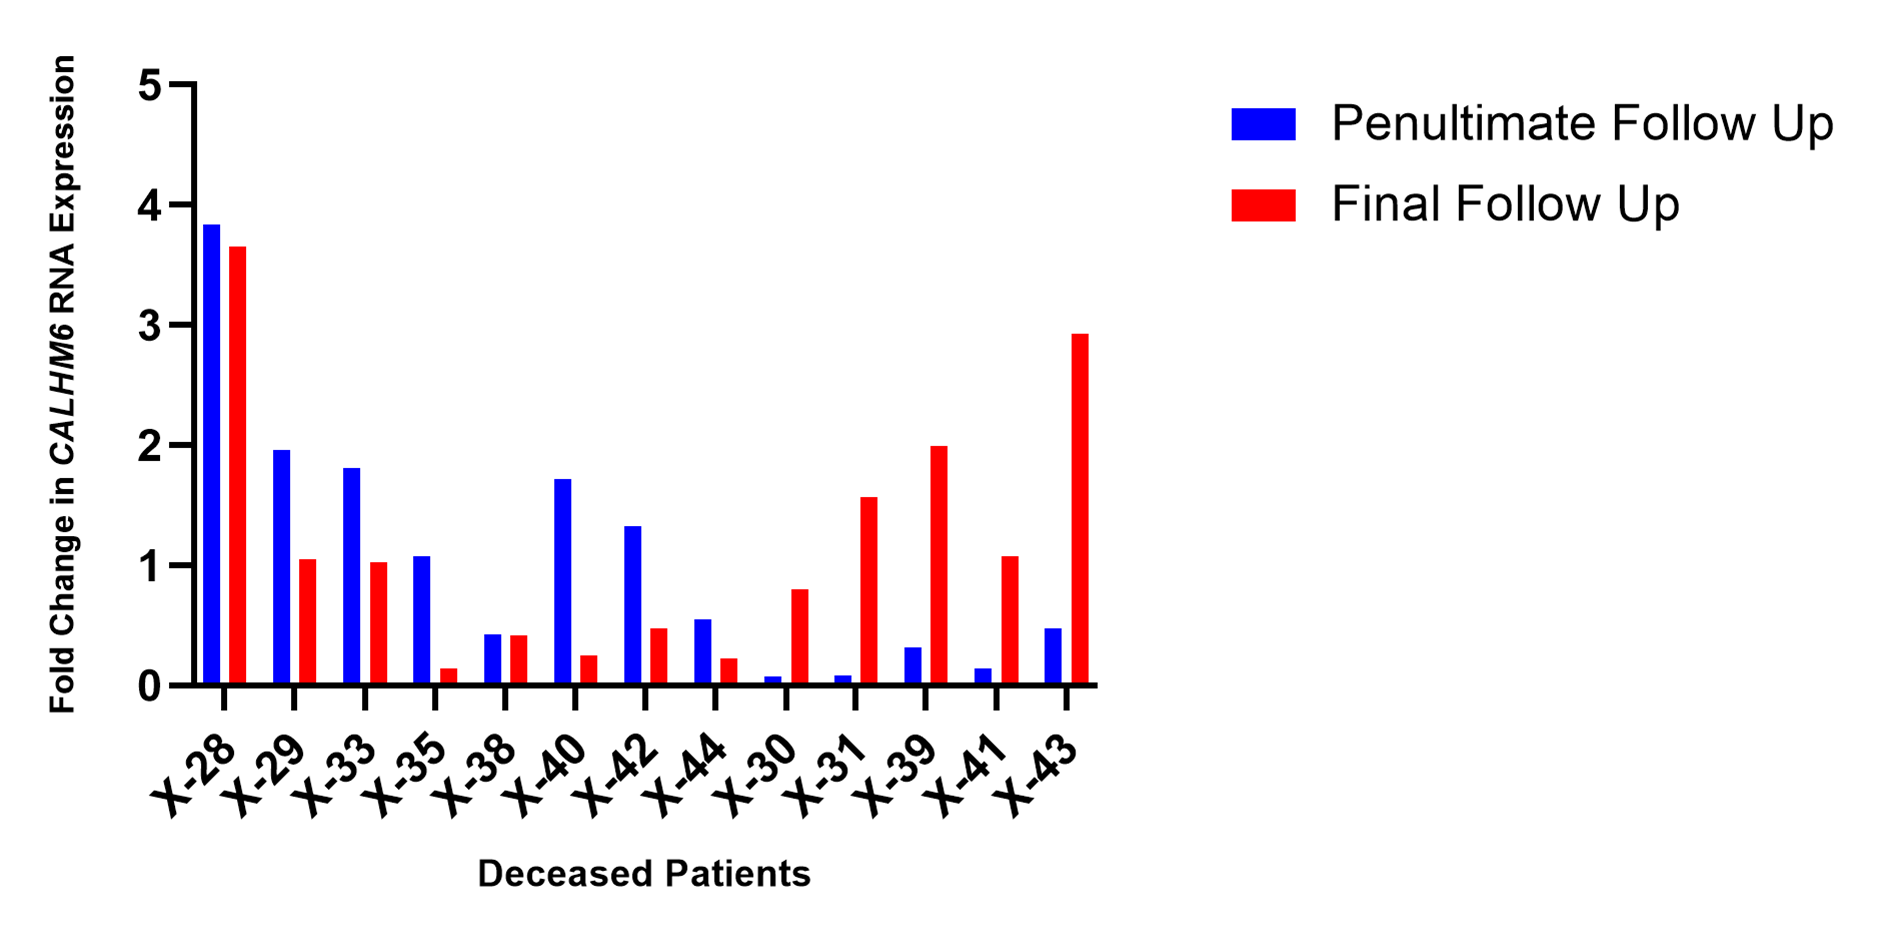
Figure 8. CALHM6 expression levels in PBMCs of deceased patients on penultimate day and final day of hospitalization (qRT-PCR). The expression level of CALHM6 in PBMCs of eight deceased patients (X-28, X-29, X-33, X-35, X-38, X-40, X-42, X-44) decreased compared to prior successive reading. Five patients (X-30, X-31, X-39, X-41 and X-43) recorded an increase of CALHM6 levels compared to prior successive reading.
Comparison of real time gene expression and protein expression of CALHM6
The qRT-PCR expression levels of CALHM6 were compared with ELISA protein expression level of CALHM6 during the follow-up period of patients X-45 and X-32. A similar trend was observed throughout the follow-up period (Day 3, Day 5, Day 7 and Day 9) of the SARS-CoV-2 (+) patient X-45; however, the initial readings did not match (Day 1). The qRT-PCR analysis revealed the CALHM6 expression to increase in PBMCs of the patient X-32 on the second follow-up (Day 3), whereas the protein expression of CALHM6 in serum samples decreased on Day 3 (Figure 9).
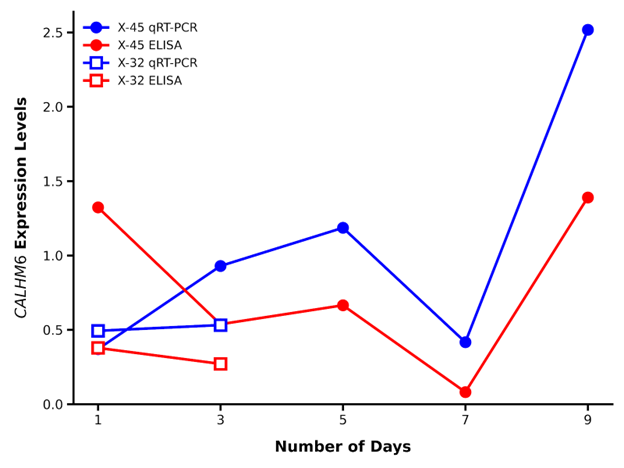
Figure 9. Comparison of qRT-PCR and ELISA readings throughout the follow up period. The qRT-PCR analysis revealed the expression of CALHM6 to be lower on Day 1 compared to Day 3 whereas ELISA concentration was observed to be higher on Day 1 compared to Day 3, for both X-45 and X-32. However, on Day 5, Day 7, and Day 9, the expression levels of CALHM6 observed through qRT-PCR and ELISA exhibited a similar trend. X-axis: Number of days. Y-axis: CALHM6 expression levels (Blue line qRT-PCR expression and red line ELISA concentration).
Discussion
The onset of the SARS-CoV-2 pandemic has driven extensive research into its pathogenesis and potential treatments. CALHM6, an innate immunity modulator, has gained attention for its role in immune signaling and inflammatory responses across various infections and malignancies [15]. Studies have shown differential expressions of CALHM6 in viral, bacterial, and parasitic infections, highlighting its significance in immune responses [11,12,16,17]. CALHM6 is a transmembrane protein that functions as a pore-forming subunit of a voltage-gated ion channel, playing a critical role in calcium homeostasis and immune signaling. It belongs to the Calcium Homeostasis Modulator (CALHM) family and contains a conserved calcium homeostasis modulator domain (Ca_hom_mod), which is responsible for calcium transport across the membrane. Studies have shown that CALHM6 localizes to the Golgi apparatus under normal conditions but translocate to the plasma membrane in response to extracellular stress, where it facilitates the rapid movement of calcium ions, contributing to reactive oxygen species (ROS) generation and immune cell activation [18,19].
Additionally, CALHM6 interacts with key calcium-binding proteins such as calpain, vinculin, S100-A7, thioredoxin, peroxiredoxin, and calmodulin-like protein 5, further reinforcing its role in calcium-mediated signaling pathways [18,19].
Given its integral role in calcium influx and immune modulation, CALHM6 is increasingly recognized as a potential target in immune-related diseases and viral infections, including SARS-CoV-2, where disruptions in calcium homeostasis can significantly impact disease progression [8,18,19].
The results of current study demonstrated that CALHM6 mRNA expression was significantly reduced in SARS-CoV-2 positive patients compared to controls. Similarly, CALHM6 protein levels were significantly downregulated in infected patients. Among the patients followed up, those who were discharged showed elevated CALHM6 expression by the end of their follow-up, while deceased patients exhibited varied expression levels. Our previous investigation of CALHM6 expressions in HIV (in vivo), HCV (Hepatitis C virus) (in vivo) and HBV (Hepatitis B virus) (both in vitro and in vivo) revealed that both there is a decrease in CALHM6 expression after all these infections and in recovered patients of HBV, the expression of CALHM6 reverse back [7,20,21]. The same pattern is followed in the current study where a significant reduction in CALHM6 expression (at both mRNA and protein level) was observed in SARS-CoV-2 infected patients as compared to the uninfected controls (p<0.0001****), Moreover four out of five (80%, n=4) recovered (discharged) patients exhibited elevated expression of CALHM6 compared to Day 1 when they had severe diseases symptoms. Moreover, the expression level of CALHM6 was elevated on the final follow-up of all discharged patients (100%, n=5) in comparison with the prior successive reading. We have proposed two hypotheses for this decrease a), Virus/infection/diseases condition itself downregulates the expression of FAM26F as indicator of downregulating the immune system. Thus, a decreased expression of CALHM6 is indicative of weak immune system weaker immunity/struggling immunity. b). an increases/elevated expression of FAM26F (as seen in recovered patients as well as healthy controls) is indicative of better immune function. Thus, CALHM6 expression can also be used as prognostic marker for diseases /infections. The elevated levels of CALHM6 recovered and health controls are indicative of a better immune system. It is yet to be deciphered whether increasing the expression of CALHM6 by external means (as immune therapeutic agent) can have any positive effects or not. Thus, the therapeutic role of CALHM6 is yet to be investigated in detail. We are working on these lines and currently applying for funding to further investigate this correlation.
Furthermore, this study compared mortality rates between older and younger adults, revealing that older age is a significant predictor of mortality, consistent with previous findings [22]. Mortality rates increased exponentially with age, with the highest rates observed in patients aged 80 or older [23]. The most significant mortality risk increase was seen in patients aged 60–80 compared to those aged 40–60, aligning with previous research on higher mortality rates in older age groups [24].
Global data suggest that males with comorbidities are at higher risk of SARS-CoV-2 mortality [25]. However, our findings, similar to Asfahan et al. (2020), found no significant correlation between male gender and mortality [26]. Both males and females exhibited comparable mortality trends, with 10 out of 14 males and 20 out of 28 females succumbing to SARS-CoV-2 infection. We acknowledge that our small sample size (n=42) and random sampling may limit the generalizability of our results. Further studies with larger sample sizes are needed to comprehensively evaluate sex differences in SARS-CoV-2 mortality risk.
Variations in CALHM6 mRNA expression levels in total PBMCs could reflect changes in the proportions of various cell type for e.g. myeloid cells such as monocytes and neutrophils. In an event of sharp CALHM6 surge in a deceased patient during final follow up (Figure 8), it would be of utmost importance to evaluate if there is any significant link between these changes and composition of PBMCs. Although our research does not address this, future studies can benefit from recording PBMCs cell composition. This can help in stratifying patients further and better understand the changing aspects of CALHM6 mRNA expression.
Chiba et al., (2014) proposed an alternative pathway for NK cell activation involving CALHM6 [27]. Javed et al., (2016) found that IFN-γ induces CALHM6 expression in PBMCs [9], while Jabeen et al., (2021) showed significant downregulation of CALHM6 in HBV-infected cells, which was reversed by calcium modulators [7]. Similar findings in HCV-infected cells suggest that boosting CALHM6 can enhance immune function and virus clearance [10]. Our recent study supports this, showing a significant downregulation of CALHM6 mRNA expression in SARS-CoV-2-positive patients compared to healthy controls (p<0.0001***), as evidenced by qRT-PCR and ELISA analyses, implicating impaired calcium homeostasis in severe disease. Elevated CALHM6 expression in recovered SARS-CoV-2 and in study of Hepatitis B patients [20] further highlights its role in immune response regulation and potential as a therapeutic target.
During the follow-up period of eighteen SARS-CoV-2-positive patients, five were discharged, while the remaining succumbed to the virus. A dynamic trend in CALHM6 expression was observed: discharged patients generally showed an increase in CALHM6 expression from Day 1 to their final day in the hospital, while deceased patients exhibited either a decrease or inconsistent patterns in CALHM6 levels.
Specifically, four of the five discharged patients demonstrated elevated CALHM6 mRNA expression by their final day, with qRT-PCR analysis confirming higher CALHM6 levels on their last follow-up compared to previous readings. Only one discharged patient showed a decrease in CALHM6 expression compared to Day 1. This up regulatory trend in recovering patients highlights CALHM6's potential as a marker of improving immune response and prognosis.
The differential expression of CALHM6 between deceased and discharged patients suggests its potential as a prognostic marker for SARS-CoV-2 outcomes. In deceased patients, qRT-PCR analysis showed that 61.5% had decreased CALHM6 levels compared to previous readings, emphasizing the need for further molecular research on CALHM6.
Although both qRT-PCR and ELISA studies reported significant downregulation of CALHM6 in infected patients, discrepancies were noted. For example, Day 1 showed higher CALHM6 expression via qRT-PCR and lower via ELISA. These inconsistencies could be due to post-transcriptional modifications, differences in mRNA stability, or protein degradation detected by ELISA but not by qRT-PCR. Variations in CALHM6 cellular localization and individual immune responses might also affect protein levels. These complexities highlight the intricate regulation of CALHM6 during infection, aligning with Jabeen et al., 2021; Jabeen et al., 2023, who found higher CALHM6 expression in recovered Hepatitis B patients, suggesting its crucial role in immune response and prognosis [7,20]. Sara et al. (2023) supports this by showing that CALHM6, highly expressed in immune cells, enhances NK cell anti-tumor activity and is vital for pro-inflammatory responses in macrophage-NK cell interactions [28]. This study highlights CALHM6's crucial role in activating the innate immune response and its association with SARS-CoV-2 infection progression. As the first to explore CALHM6 in the context of SARS-CoV-2, our findings suggest its potential as an immune modulator and prognostic marker, with broader relevance for immune cell activation and IFN-γ production by NK cells. Future research may further elucidate CALHM6's role in various immune challenges.
A key limitation of this study is that CALHM6 expression was assessed in total peripheral blood mononuclear cells rather than in specific immune subsets such as natural killer cells or monocytes. As a result, cell-type–specific contributions to the observed changes in CALHM6 expression could not be determined. Additionally, the relatively small cohort size and single-center design may limit the generalizability of the findings. Future studies incorporating immune cell subset analysis and larger, multi-center cohorts will be essential to further define the mechanistic and prognostic role of CALHM6 during SARS-CoV-2 infection.
Conclusion
This study provides the first evidence of a significant association between CALHM6 expression and SARS-CoV-2 infection. The downregulation of CALHM6 in SARS-CoV-2-positive patients and its varying expression trends during disease progression highlight its potential as a critical immune modulator and prognostic marker. These findings pave the way for future research to explore CALHM6-targeted therapies and its role in managing SARS-CoV-2 and other viral infections.
Acknowledgments
We extend our profound gratitude to the doctors and management of Mardan Medical Complex for their invaluable support and for providing an environment that greatly facilitated our sampling process. We are especially thankful to the patients who, despite their illness, graciously volunteered their samples, enabling us to carry out this vital work.
References
2. Yazdanpanah F, Hamblin M, Rezaei N. The immune system and COVID-19: friend or foe? Life Sci. 2020;256:117900.
3. Wong RSY. Inflammation in COVID-19: from pathogenesis to treatment. Int J Clin Exp Pathol. 2021;14(7):831–44.
4. Chernyak BV, Popova EN, Prikhodko AS, Grebenchikov OA, Zinovkina LA, Zinovkin RA. COVID-19 and oxidative stress. Biochemistry (Mosc). 2020;85(12):1543–53.
5. Nieto-Torres JL, Verdiá-Báguena C, Jimenez-Guardeño JM, Regla-Nava JA, Castaño-Rodriguez C, Fernandez-Delgado R, et al. Severe acute respiratory syndrome coronavirus E protein transports calcium ions and activates the NLRP3 inflammasome. Virology. 2015;485:330–9.
6. Berlansky S, Sallinger M, Grabmayr H, Humer C, Bernhard A, Fahrner M, et al. Calcium signals during SARS-CoV-2 infection: assessing the potential of emerging therapies. Cells. 2022;11(2):253.
7. Jabeen K, Malik U, Mansoor S, Shahzad S, Zahid S, Javed A. Effect of oxidative stress and calcium deregulation on FAM26F (CALHM6) expression during hepatitis B virus infection. BMC Infect Dis. 2021;21:228.
8. Malik U, Javed A, Ali A, Asghar K. Structural and functional annotation of human FAM26F: a multifaceted protein having a critical role in the immune system. Gene. 2016;597:66–75.
9. Javed A, Leuchte N, Salinas G, Opitz L, Stahl-Hennig C, Sopper S, et al. Pre-infection transcript levels of FAM26F in peripheral blood mononuclear cells inform about overall plasma viral load after simian immunodeficiency virus infection. J Gen Virol. 2016;97(12):3400–12.
10. Grimes CZ, Hwang LY, Wei P, Shah DP, Volcik KA, Brown EL. Differentially regulated gene expression associated with hepatitis C virus clearance. J Gen Virol. 2013;94(Pt 3):534–42.
11. Pankla R, Buddhisa S, Berry M, Blankenship DM, Bancroft GJ, Banchereau J, et al. Genomic transcriptional profiling identifies a candidate blood biomarker signature for the diagnosis of septicemic melioidosis. Genome Biol. 2009;10(11):R127.
12. Grumann D, Scharf SS, Holtfreter S, Kohler C, Steil L, Engelmann S, et al. Immune cell activation by enterotoxin gene cluster–encoded and non-egc superantigens from Staphylococcus aureus. J Immunol. 2008;181(7):5054–61.
13. Ferreyra GA, Elinoff JM, Demirkale CY, Starost MF, Buckley M, Munson PJ, et al. Late multiple organ surge in interferon-regulated target genes characterizes staphylococcal enterotoxin B lethality. PLoS One. 2014;9(2):e88756.
14. Ahmed AM, Good B, Hanrahan JP, McGettigan P, Browne J, Keane OM, et al. Variation in the ovine abomasal lymph node transcriptome between breeds differing in resistance to gastrointestinal nematode infection. PLoS One. 2015;10(5):e0124823.
15. Mosca E, Merelli I, Viti F, Calabria A, Milanesi L. A multilevel data integration resource for breast cancer study. BMC Syst Biol. 2010;4:76.
16. Brito H, Juliano P, Altemani C, Altemani A. Is the immunohistochemical study of the inflammatory infiltrate helpful in distinguishing villitis of unknown etiology from nonspecific infectious villitis? Placenta. 2005;26(10):839–41.
17. Defamie V, Carron C, Le Brigand K, Moreilhon C, Saint-Paul MC, Laurens M, et al. Gene expression profiling of human liver transplants identifies an early transcriptional signature associated with poor graft function. Am J Transplant. 2008;8(6):1221–36.
18. Javed A, Habib S, Ayub A. Evolution of protein domain repertoires of CALHM6. PeerJ. 2023;12:e16063.
19. Malik U, Zafar S, Younas N, Zerr I, Javed A. Physical and functional niches of FAM26F revealed by subcellular localization and interacting partners. ACS Omega. 2020;5(35):22008–20.
20. Jabeen K, Javed A, Waris A, Shahzad S. Restoration of IL-11 and IL-15 cytokine production post calcium and ROS modulation assists viral clearance. Iran J Basic Med Sci. 2023;26(2):176–82.
21. Jabeen K, Khalid M, Mansoor S, Zalan A, Ejaz M, Mansoor A, et al. Host immune players and their response to hepatitis C therapies. PLOS Glob Public Health. 2024;4(6):e0003110.
22. Zhou F, Yu T, Du R, Fan G, Liu Y, Liu Z, et al. Clinical course and risk factors for mortality of adult inpatients with COVID-19 in Wuhan, China. Lancet. 2020;395(10229):1054–62.
23. Bonanad C, García-Blas S, Tarazona-Santabalbina F, Sanchis J, Bertomeu-González V, Fácila L, et al. Effect of age on mortality in patients with COVID-19: a meta-analysis. J Am Med Dir Assoc. 2020;21(7):915–8.
24. Henkens MTHM, Raafs AG, Verdonschot JAJ, Linschoten M, van Smeden M, Wang P, et al. Age is the main determinant of COVID-19-related in-hospital mortality. BMC Geriatr. 2022;22:184.
25. Kelada M, Anto A, Dave K, Saleh SN. Role of sex in mortality risk from COVID-19: a systematic review. Cureus. 2020;12(8):e10114.
26. Asfahan S, Deokar K, Dutt N, Niwas R, Jain P, Agarwal M. Extrapolation of mortality in COVID-19: role of age, sex, and comorbidities. Monaldi Arch Chest Dis. 2020;90(2):313–7.
27. Chiba S, Ikushima H, Ueki H, Yanai H, Kimura Y, Hangai S, et al. Recognition of tumor cells by Dectin-1 orchestrates innate immune cells for antitumor responses. eLife. 2014;3:e04177.
28. Danielli S, Ma Z, Pantazi E, Kumar A, Demarco B, Fischer FA, et al. The ion channel CALHM6 controls bacterial infection-induced cellular cross-talk at the immunological synapse. EMBO J. 2023;42(7):e111450.