Commentary Overview
Traumatic brain injury (TBI) is a leading cause of death and neurological disability worldwide with millions of people sustaining and living with its long-term effects [1-3]. TBI is often categorized as mild, moderate and severe with primary injuries separated as either focal or diffuse, with the latter including contusions, intracranial hematomas and brain herniation. The frequent assumption of sever TBI (sTBI) being self-evident, underlies its frequent mistriage, which is exacerbated by the limited sensitivity or specificity of assessment via Glasgow coma scale (GCS), concomitant injuries, common association with alcohol intoxication or drugs, to name a few. In fact, sTBI can be missed even after the initial CT scan, as pathologies such as diffuse axonal injuries are not necessarily associated with radiological abnormalities on structural scans and only reveal themselves when attempts are made to wake the patient up, days down the line. The delay in diagnosing the brain injury in confused or unconscious patients negates the opportunity to implement early neuroprotective measures or deal with an expanding intracranial clot in timely fashion. This is subsequently associated with increased morbidity and mortality. A technology to triage TBI with sufficient sensitivity and timeliness at the point-of- care is therefore needed. Whilst the combination of neurological exam with a CT scan or magnetic resonance imaging (MRI) with the associated (H)-magnetic resonance spectroscopy (1H-MRS) offer detailed information about TBI, the presence of confounders (e.g., alcohol or rapid intubation) can prevent neurological assessment at the point-of-care and CT or MRI would not be available until the patient reaches hospital. This can lead to misdiagnosis or delayed treatment in the prehospital settings, where most of the acute damage occurs. This justifies the intense quest for a rapid, point-of-care assessment of TBI in austere environments. In our recent study [4], the N-acetylasparate (NAA) along with the further acute biomarkers (e.g., S100B, GFAP) measured via the newly developed surface enhanced Raman scattering (SERS) miniaturized device, comprised of reproducible electrohydrodynamic (RED) patterned substrates, has convincingly been demonstrated to correlate with the TBI, neurological dysfunction and recovery as function of time from clinical human blood plasma samples. Detection of TBI indicative biomarkers within the plasma of affected individuals may indeed represent a more convenient, reproducible and inexpensive alternative (or complementarity) to 1H-MRS as a modality. The developed technique provides an opportunity to measure these biomolecules, paving the way for clinical utility and validation studies. SERS is a powerful vibrational spectroscopy that allows for labelfree, highly-sensitive and selective detection of analytes through the amplification of localized electric fields on the surface of a plasmonic material when excited with monochromatic light, resulting in enhancement of the Raman scattering signal, enabling the detection of low concentration analytes. It offers distinct advantages over other spectroscopic methods for sensing including, the immediate detection of analytes without complex samplepreparation and undergoes no bleaching. SERS is the only detection technique that can be deployed out of a laboratory setting without a significant loss in performance and is capable of rapid sensing with considerably lower detection limits. This unique set of attributes makes it well suited to address the challenges associated with point-of-care detection. In the past decade SERS has been therefore, emerging as a strong platform for the development of sensitive biomedical assays, which are capable of detecting low levels of analytes from very small sample volumes [5-13]. High-sensitivity and the wealth of chemical information in the readout signal (SERS spectrum) have been shown to provide a great potential of SERS in detecting biomarkers at early stages of disease development [14]. Furthermore, when SERS is combined with the merits of microfluidics, it enables the capabilities to perform rapid, low- volume and high-throughput multiplex detection with high-sensitivity and reproducibility of minute analytes in a microfluidic chip due to the fact that distance dependence of SERS is well known to decay away from the surface and the enhancement sharply decreases as the distance between the adsorbate and the surface increases [15-20].
Measuring abnormal blood TBI indicative biomarker levels via SERS would be interpreted by clinicians as an indication to treat the patients according to the TBI guidance without delay and potentially starting at the pointof- injury (e.g., roadside) as well as help triage the patient appropriately e.g., directing them to a major trauma centre with neurosurgical facilities, as the mechanism of injury would be clear in the majority of cases and neuroprotective measures would be instigated immediately irrespective of the exact diagnosis or a more detailed pathoanatomical classification, which would come later, after in-hospital neuroimaging. It is therefore, important for clinicians to be alerted to the possibility of TBI by the presence of a biomarker or signature molecule(s), particularly in the pre-hospital setting, as this injury is frequently missed in the presence of confounders. RED-SERS utility would be in pointing the presence of TBI in the context of trauma at the earlies stages and helping to quantify the damage, holding a great potential to help triaging the TBI patients appropriately.
Optofluidic Red-Sers Lab-on-a-Chip
We have engineered, optimized and fabricated novel reproducible electrohydrodynamic surface enhanced Raman scattering active substrates and subsequently, obtained strong, highly-reproducible SERS signals from both standard biomolecules and from complex bio-matrices in clinical samples. Our miniaturized labon- a-chip postures salient advantages of rapidness and high-sensitivity via integration of the RED-SERS with the original optofluidic platform for on- chip separation and SERS detection, exhibiting good repeatability whilst achieving specific detection [4]. Furthermore, we have developed a microfluidic chip, where capillary forces are the primary driving forces used to drive the fluid flow in the system thus, enabling cheap and easy, mass producible, stand-alone units that do not require additional supporting, fluid- handling equipment, yielding a system suitable for low-cost, disposable point-of-care analysis. TBI indicative biomarkers (NAA, GFAP and S100B) were detected at trace levels from blood plasma. The final development and integration of the lab-on-a-chip with the portable Raman system provides an innovative label-free system with combined simplicity, sensitivity and reproducibility and holds a great potential to help triaging the TBI patients appropriately. This exploratory study may further promote this label-free blood SERS technique into practical clinical applications.
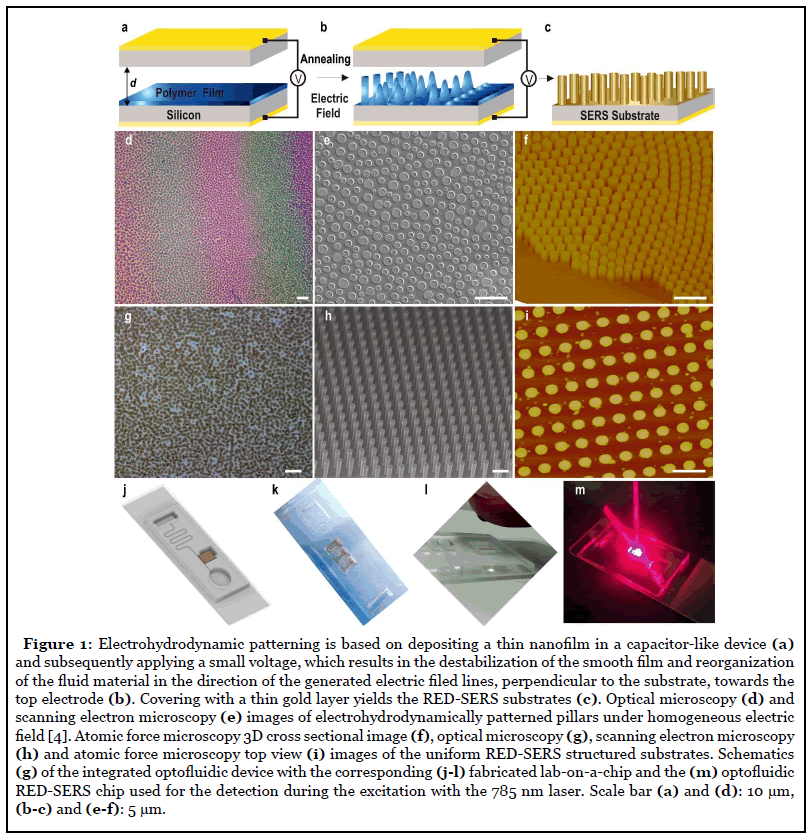
Initially, we have fabricated the RED-SERS substrates using the novel electrohydrodynamic lithography as described in details in Ref. [4] and outlined in Figure 1a- 1c. We have then studied the uniformity and reliability of the RED-SERS platforms (Figure 1). In contrast to the nanoparticle based SERS systems, where the reproducibility is generally related to the uniformity of the hot spots distribution, we have fabricated submicrostructured SERS substrates, which intrinsically overcome this problem for highly-stable, uniform SERS measurements. These substrates are highly-uniform across the substrate area. Importantly, unique to our platforms, each of the RED patterned individual structural units yields a considerable SERS enhancement thus, enabling each single unit to function as an isolated SERS sensor. To characterize the SERS intensity uniformity of the signal, we have performed extensive imaging (Figure 1d-1f) along with Raman mapping of the RED-SERS substrates (measured over several randomly chosen scan areas, 100 × 100 μm2, 3mW laser power, 10s acquisition time at each point). The deviation of surface enhanced Raman scattering intensities from the strongest point to the weakest point was found to be less than 4.7%, indicating that the RED-SERS substrates have a greatly uniform SERS enhancement effect over the whole surface. The overall reliability of SERS platforms was monitored via the rational design of the RED-SERS substrate, careful sample preparation, consistent measurement conditions and adequate statistical and classification data analysis. In our SERS measurements all the experimental conditions were kept constant including, the objective lens, laser frequency, incident power, integration time and the polarization direction, to further improve the surface-enhanced Raman signal reliability. Since the spot size of the laser in SERS measurements is on the microscale (i.e., 1-2 μm), Raman signals from different pillars on the RED substrates are consequently, highly- uniform, exhibiting excellent signal reproducibility. Both, SERS spectra acquired from four random locations across each substrate as well as from three different substrates with 5-7 locations tested, under identical experimental conditions demonstrated a good consistency and yielded reproducible relative SERS intensities with the target analytes on the gold monolayer retaining their stable orientations due to the optimized conformation of the underlying surfaces. Variations of less than 9% in the relative standard deviation with an average variation of less than 4.5% in terms of the relative peak intensities were determined. Thus, RED-SERS substrates offer uniform periodic platforms with reproducible and stable SERS. The reproducibility coefficient was found to be such that the absolute difference between any three future measurements made on a particular substrate are estimated to be no greater than 4.3% on 95% of occasions. We have also assessed the reproducibility of the SERS signals in our RED-SERS arrays measuring ten random spectra across the entire sample area for two different standard molecules i.e., benzenethiol and methylene blue. Highly-repeatable SERS response was obtained from REDSERS surfaces with relative standard deviation values of less than 8.5% and ~4.3% in the framework of one sample (error bars) and between the different samples (height of the bars), accordingly.
The average substrate enhancement factor of the REDSERS was found to be (7.79 ± 0.29) × 109 and it depends on the laser excitation, intrinsic properties of the analyte in particular Raman tensors of the modes and intrinsic crosssections and SERS analyte surface coverage properties and therefore, on the molecule and the vibration mode due to the symmetry, orbital overlap, and orientation [21,22]. Importantly, SERS on RED substrates arises almost exclusively from a single pillar. The adjacent structures are not plasmonically coupled to each other unlike some other sub-micrometer SERS structures [23-24] and therefore, individual pillars function as isolated detection centres, rendering these patterned substrates as optimal platforms for multiplexed SERS. In contrast to the periodic grating which couple light into plasmon-polariton and propagating plasmon resonances by diffraction, RED-SERS structures do not couple due to the large gap between the adjacent pillars. For the incident excitation, the SERS signals which occur at these red-shifted wavelengths are Stokes shifted and therefore, enhanced on the pillar region. Such polarization sensitive anistropic localization of plasmons and SERS signals offers the possibility of selective detection at the single structure level.
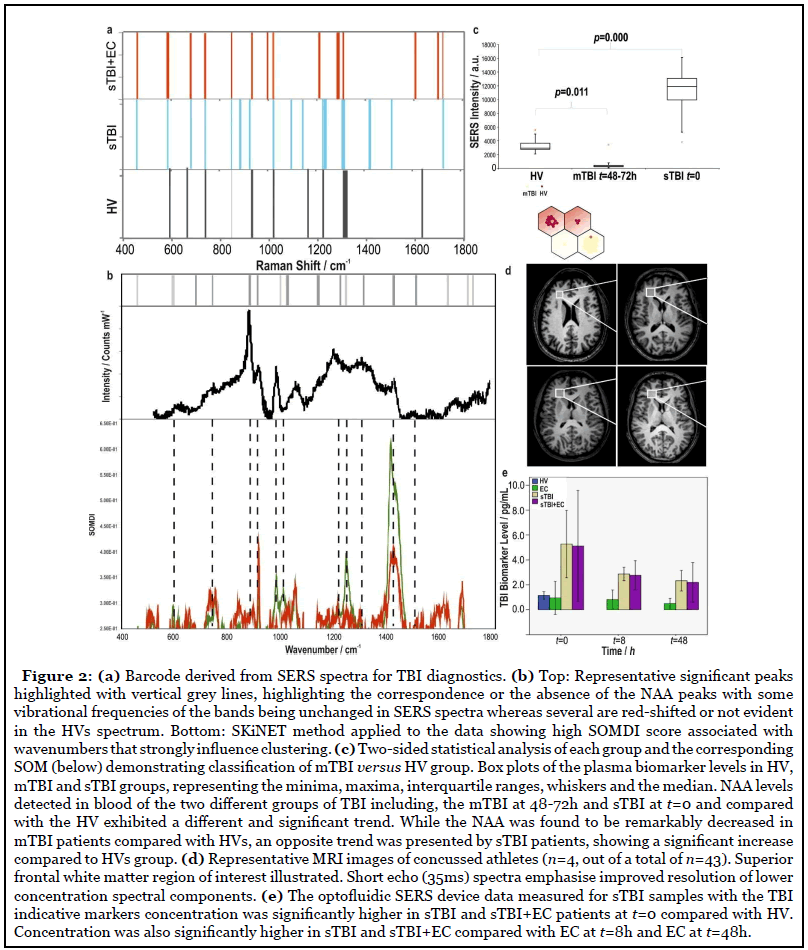
Further, SERS detection was combined with multi-layer perception statistical classification analysis, based on maximum a posterior, combined with Wilcoxon rank sum/ Mann-Whitney U statistical analysis and self-organizing classification maps, employed to analyze and differentiate the blood plasma SERS spectra obtained from the different TBI and healthy control groups thus, establishing a powerful procedure for SERS spectral analysis to classify in sTBI discrimination. Figure 2a shows the representative diagnostic barcodes for each biomarker i.e., NAA, GFA and S100B for classification of SERS spectra between healthy control (HV) and sTBI patients. Resolving the interference of various solutes in biofluids is addressed by acquiring the SERS-fingerprint of a set of substances and then comparing it with the vibrational spectrum of an unknown mixture of substances using advanced computational and statistical analysis to elucidate the composition of the sample. Initially, the Raman shift of a certain peak and the relative intensity of characteristic peaks are used to determine the chemical content and chemical structure of the biomolecules. Subsequently, by comparing the SERS spectrum with that from the bioanalytes in their native states, the environment and the configuration of the molecules in the solution or on the surface is further determined.
Based on the enhancement via the electromagnetic mechanism, the wavelengths of the localized surfaces plasmon resonance and the strength of the electric field are highly-sensitive to the shape, dimensions and coupling modes of micro- nanostructures and therefore, SERS substrates with tuneable and optimized SERS enhancement at the desired laser wavelength, especially near-infrared laser for the bioanalysis, can be obtained via rational design by controlling the sizes, shapes, materials and coupling modes. For RED-SERS patterning, the gap between the electrodes can be carefully adjusted via the use of spacers with various dimensions, which can in turn, tune the achievable heights of the pillars. The strength of the applied voltage (and the generated electric field) controls the speed and the consistency of the patterning as well as dictates the characteristic, dominant electrohydrodynamic wavelength of the instability, which in turn, determines the gap between the fabricated pillars. The filling ration, i.e., the proportion of the initial film thickness to the height between the electrodes, allows for the tuning of the final diameters of the formed pillars. Choosing and tailoring of any of these parameters allows us to fine-tune RED-SERS platforms with resulting substrates comprised of gold coated pillars with controlled diameter, height and spacing, all dictating the optical responses of the structures. Using our unique electrohydrodynamic patterning technique, it is further possible to generate structures either under homogenous electric field with a slight wedge geometry (only a few micrometers per cm) allowing for the lateral distribution of pillars’ aspect ratios, generating bands of color, easily observable under optical magnifying lenses (Figure 1a and 1b) with tuneability of the extended surface plasmon resonance observed in the range of 600–1000 nm, or under heterogeneous electric filed, where the structures are guided by the well-aligned top electrode, resulting in a single pillar aspect ratio with no color variation (Figure 1c-1f). We have demonstrated that the enhancement factor is maximized when the LSPRs are redshifted and a consistent dependence of the field intensity with periodic boundary conditions reveals increasing intensity with an increasing aspect ratio up to optimal dimensions at f=0.8, variation which mainly arises from coupling of light into plasmon resonances which are tuned by the pillar dimensions and therefore, the relative SERS enhancement is correlated with the increased strength of plasmonic coupling into the structure. Experimentally, the measured reflectance across pillars, R/R0, with laterally varying aspect ratios exhibits increased extinction with increasing aspect ratio with a nearly 30% increase occurs in extinction when varying the aspect ratio from 0.6 to 0.8 [ 4].
Integrating RED-SERS chip in our microfluidic chip (Figure 1g and 1h), where capillary forces are the primary forces used to drive the fluid flow in the system thus, enables cheap and easy, mass-producible, rapid, standalone units that do not require additional supporting fluid handling equipment, yielding a system suitable for low-cost, disposable point-of-care analysis. The individual components of the chip were developed, tested and integrated with RED-SERS platform to form a fully functional whole system. Pillar structure of the RED-SERS substrates pose further advantage within the microfluidic chip as they have been shown to increase the surface to volume ratio and subsequently, increase the capillary flow as well as the yield from blood while autonomous microfluidic capillary systems have also been shown to efficiently separate small liquid volumes within a few minutes [25]. A small droplet of whole blood introduced into the inlet reservoir flows through the main capillary channel (110μm width ×10 μm depth ×100 mm length) and drawn through the cross flow filter combs, consisting of repetitive arrays of 2 μm wide, 200 μm long and 1.2 μm deep channels eliminating the infiltration of red blood cells, with shear stress reducing the flow resistance, while providing a consistent flow rate within the primary channel, with the separated plasma directed to the detection area (cross-section of 6×3 mm2) comprised of the integrated RED-SERS structures, in the final optofluidic design. The channels twisting is used to draw sample past the filters towards the outlet reservoir for the depleted blood. This design allows coupling of the high capillary pressure between deeper and shallower structures with relatively low flow resistance by means of capillary phenomena, effectively separating small volumes of whole blood in rapid manner and delivering it to the detection area.
Detection of Severe TBI
Our study has focused on patients with diagnosed sTBI, with blood samples collected immediately at the point of injury and consequent hours post TBI, with clearly established mechanism of injury in each case. All individuals recruited were subject to two tier screening via the on-call trauma research team at the local University Hospital. Initial identification and recruitment were undertaken by senior research nurses, individuals successfully recruited were then reviewed by specific clinical (medically qualified) research fellows. The presence of pre-morbid neurological pathology or chronic neuro degenerative pathology (including dementia, epilepsy and previous ischemic brain injury) was specific exclusion pathology, and if this was identified or suspected in the recruited patient they were excluded and samples dissuaded. We have compared patients across different groups with the biomarkers measured in clinical blood plasma from patients with TBI and healthy volunteers including, the sTBI group only, the mildTBI (mTBI) cohort, the extracranial (EC)-injury-only group and sTBI subjects including a subgroup with the STBI combined with EC (STBI + EC).
The multi-layer perception statistical classification analysis combined with Wilcoxon rank sum/Mann- Whitney U statistical analysis was employed to classify TBI from SERS spectra thus, incorporating the entire spectrum and determine the most diagnostically significant features for improving the efficiency for plasma analysis and differentiation. The peak at 1420 cm-1 was chosen as the best performing for classification as a reference peak and subsequently, ranking the classification performance and examining the features of the top ten percent of the cases, the most frequently appearing features including, intensity and the ratio peaks at 1517, 682, 717, 930, 1010, 1168 cm-1 were selected for barcoding (Figure 2a and 2b).
The 1420 cm-1 SERS band corresponds to the acetylamide in the CH3-NH-C=O of the N-acetyl asymmetric vib CH3 deformations, and is part of the NAA molecular structure. Peaks that contributed the most to the classification matrix and clustering and match those of each biomarker and sTBI were chosen. An intrinsic classification accuracy of 98.7% at time, t from injury: t=0, 90.9% at t=8h and 91.0% at t=48h for identifying severe TBI from healthy controls was achieved. Similar to establishing a characteristic fingerprint along with the selective barcode for the identification of NAA (Figure 2b, top) through comparison of the HVs, combined sTBI with extracranial injury (EC) group and sTBI only patients, we have also generated the barcodes for neuro-biomarkers of S100B and GFAP, demonstrating a selective and multiplex identification of other biomolecules, which could be crossing the blood brain barrier after the TBI. Receiver operating characteristic curves confirmed that plasma SERS together with diagnostic algorithm employing the entire SERS spectral features as powerful for classification between sTBI, sTBI+EC and normal control groups, showing a classification accuracy of 98.7% for identifying NAA at t=0 using the combined qualitative analysis of the severe TBI biomarkers with quantitative classification, projection and clustering algorithm for the discrimination between the normal and severe TBI groups for several TBI-indicative biomarkers. An interesting facet of the data set was the strong correlation observed between the levels of NAA detected with GFAP and S100B with the calculated Spearman rank correlation coefficients (function ‘coef’ Mathworks software MATLAB), were found to be of 0.97711 for NAA-GFAP and 0.96079 for NAAS100B (p<0.001). Since these are established markers of neurological injury and although not robustly specific to TBI, represent a reasonable measure of neuro cytological injury, it is expected that the quantity of NAA release will relate directly to the burden of cytological injury in a similar way and therefore, these two quantities would closely correlate.
Furthermore, we have recently shown how embracing the ‘noise’ from the raw data via the self-optimising Kohonen index network (SKiNET) can provide a generic framework for multivariate analysis that simultaneously provides scientific insights and classification for multi-class problems [26]. The method was tested by classification of anatomical eye tissue from porcine eyes, yielding an accuracy >93% versus 51% using PLS-DA across five tissue types. In this approach, individual SERS spectra were kept consciously noisy by using a short acquisition time and limited laser power, to be representative of realworld applications, which are limited by both scan time and maximum permissible exposure defining eye safe limits. As neural networks are data ‘hungry’ algorithms by nature, a meaningful model could be trained by using a large enough number of noisy inputs. The ability to quickly identify tissue from the noisy spectral response of a short acquisition, as demonstrated in our work allows capturing of clean signal in the region of interest only. Filtered signal is then fed into a second SKiNET model designed to distinguish between specific disease states. Figure 2b, bottom exemplifies the SKiNET method applied to the data in this study showing high SOMDI score associated with wavenumbers that strongly influence clustering.
Weights that identify each group type can quickly be identified. From this method it is possible to identify either isolated or strong weights associated with each group (sTBI versus HV) at 1420, 1292 1168, 930, 717 and 682 cm-1 representing for instance, wagging of C=O and twisting of –OH bonds in N-acetyl groups, acetylamide in the CH3-NH-C=O of the N-acetyl (in the NAA) asymmetric vib CH3 deformations etc.
We have also recently demonstrated a pathway towards detection of changes to brain chemistry, by using spectra from tissues of the retina to identify TBI in ex-vivo murine model with a high-degree of accuracy and affinity for differing degrees of injury severity [27]. A subtle, but clear change in the ratio of the intense peaks was observed in the high wavenumber region suffering little interference from fluorescence of 2850 and 2930 cm-1 distinguishing between control and TBI samples using Raman spectroscopy.
Preliminary Mild TBI Cohort
Our study has predominantly focused on severe TBI patients and detection of TBI-indicative biomarkers from blood post TBI showing for the first time measurement of abnormal blood NAA, GFAP and S100B values which would be interpreted by clinicians as an indication to treat the patient according to the TBI guidance prehospitally and without delay. We have further carried out a preliminary study on a small mild TBI (mTBI) cohort (Figure 2c). The assay data in this study was supported by the MRI images, (Figure 2d) available for 13 mTBI patients (with the corresponding GCS score and Marshall Grade) for each of the patients. The samples in this study came from a standard, widely accepted classification of the TBI severity based on clinical and neurological criteria i.e., the Mayo Classification including, GCS score, Marshall Grade, basic neurological exams combined with CT scans (for severe TBIs) and MRI/1H-MRS (for mild TBIs).
Wilcoxon sum/Mann-Whitnbey U test projections of the NAA biomarker revealed significant differences (p=2.3 ×10⁻⁹) between HV, sTBI and mTBI groups along with the statistical analysis of each group and the corresponding self-organising map clearly demonstrating classification of mTBI versus HV group. NAA levels detected in blood of the two different groups of TBI including, the mTBI at 48-74h and sTBI at t=0 and compared with the healthy volunteers (HV) exhibited a different and significant trend. While the NAA was found to be remarkably decreased in mTBI patients (p=0.011) compared with HVs, an opposite trend was presented by sTBI patients, showing a significant increase (p=0.000) compared to HVs group. Profound differences between mild and severe TBI (Figure 2c-2e) evidenced are to be considered preliminary but do suggest an interesting correlation between the biomarker levels and the mechanism of injury. [4] NAA is thought to be of increasing importance to the pathophysiology of TBI since experimental evidence has suggested that it was observed that NAA concentration is reduced markedly with traumatic insult negatively affected by TBI. The magnitude of this depletion also seems to correlate with the degree of its depletion depending on TBI severity. The decrease in the NAA ratios on 1H- MRS can be attributed to reduced mitochondrial NAA synthesis in mild TBI, whereas in severe TBI, the late decrease in the NAA ratios is attributed to depletion of the neuronal population. This could explain why in mTBI we have recorded a drop in blood NAA levels (reduced biosynthesis and/or increased utilisation) whereas in severe TBI the increase in blood levels can be explained by outflow of NAA from damaged cells. It is plausible that the NAA depletion found in blood of mTBI patients after 48h from concussion is a result of the concomitant actions of the two enzymes, NAT8L (NAA biosynthesis) and Aspa (NAA catabolism), directly regulating brain NAA homeostasis. Because of the wellknown energy crisis triggered by TBI, neurons respond by repressing expression of the NAT8L gene to avoid acetyl- CoA consumption for NAA biosynthesis. This in turn, allows the use of acetyl-CoA for other reactions of major importance for cell survival. For the same reason, increase in the NAA catabolism mediated by ASPA supplies acetate and aspartate for other metabolic processes, promoting recovery and survival of the cells. This temporary homeostasis will resolve spontaneously and will allow the recovery of normal brain functions in mTBI. On the other hand, the significant NAA increase found in blood of sTBI patients at the very early time points represents NAA released into the bloodstream due to the damage of the cell membrane after severe trauma hence, representing a viable marker of cell damage.
In summary, TBI is a complex pathology and requires more than a single biomarker to capture this complexity. Tissue biomarkers of brain injury can only quantify the extent of tissue damage, which only weakly correlates with clinical severity or specific neurological abnormalities (for example, as small area of tissue damage in the brain stem would be associated with more neurological dysfunction than a much larger area in right frontal region). However, it is important for clinicians to be alerted to the possibility of TBI by the presence of a biomarker or a signature molecule, particularly in the pre-hospital setting, as this injury is frequently missed in the presence of confounders. This underpins the intense quest for hyperacute biomarkers of TBI. Brain tissue neuro-biomarkers depletion is seen in a number of different forms of acute brain injury [28]. However, in the context of trauma as a mechanism of injury, i.e., a road traffic accident or pitchside, TBI biomarkers measurement should be interpreted as an indicator of brain trauma until proven otherwise. In this context, a measurement of abnormal blood biomarker values would be interpreted by clinicians as an indication to treat the patient according to the TBI guidance without delay and potentially starting at the roadside, as the mechanism of injury would be clear in the majority of cases and neuroprotective measures would be instigated immediately irrespective of the exact diagnosis or a more detailed pathoanatomical classification, which would come later, after in-hospital neuroimaging. Finally, it is worth noting the plausible timeline for implementation of this technology to patients. Whilst the rapid and accurate assessment of brain injury has prospects for clinical use and may assist the discovery of new insights into TBI pathophysiology, large clinical trials would be needed to further establish the device’s overall performance, sensitivity and clinical relevance [29].
References
2. Carney N, Totten AM, O’Reilly C, Ullman JS, Hawryluk GW, Bell MJ, et al. Guidelines for the management of severe traumatic brain injury. Neurosurgery. 2017 Jan 1;80(1):6-15.
3. Robertson C. Critical Care Management of Traumatic Brain Injury. Elsevier. 2015; 4, 334.
4. Rickard JJ, Di-Pietro V, Smith DJ, Davies DJ, Belli A, Oppenheimer PG. Rapid optofluidic detection of biomarkers for traumatic brain injury via surface-enhanced Raman spectroscopy. Nature Biomedical Engineering. 2020 Feb 3:1-4.
5. McQueenie R, Stevenson R, Benson R, MacRitchie N, McInnes I, Maffia P, et al. Detection of inflammation in vivo by surface-enhanced Raman scattering provides higher sensitivity than conventional fluorescence imaging. Analytical Chemistry. 2012 Jul 17;84(14):5968-75.
6. Wang YW, Khan A, Som M, Wang D, Chen Y, Leigh SY, et al. Rapid ratiometric biomarker detection with topically applied SERS nanoparticles. Technology. 2014 Jun 19;2(02):118-32.
7. Wang Y, Kang S, Khan A, Ruttner G, Leigh SY, Murray M, et al. Quantitative molecular phenotyping with topically applied SERS nanoparticles for intraoperative guidance of breast cancer lumpectomy. Scientific Reports. 2016 Feb 16;6:21242.
8. Han XX, Zhao B, Ozaki Y. Surface-enhanced Raman scattering for protein detection. Analytical and Bioanalytical Chemistry. 2009 Aug 1;394(7):1719-27.
9. Han XX, Ozaki Y, Zhao B. Label-free detection in biological applications of surface-enhanced Raman scattering. TrAC Trends in Analytical Chemistry. 2012 Sep 1;38:67-78.
10. Wang R, Chon H, Lee S, Ko J, Hwang J, Choi N, et al. Biomedical applications of surface-enhanced raman scattering spectroscopy. In:Frontiers and Advances in Molecular Spectroscopy 2018 Jan 1 (pp. 307-326). Elsevier.
11. Moore TJ, Moody AS, Payne TD, Sarabia GM, Daniel AR, Sharma B. In vitro and in vivo SERS biosensing for disease diagnosis. Biosensors. 2018 Jun;8(2):46.
12. Kahraman M, Mullen ER, Korkmaz A, Wachsmann- Hogiu S. Fundamentals and applications of SERSbased bioanalytical sensing. Nanophotonics. 2017 Mar 20;6(5):831-52.
13. Gauglitz G, Moore DS, editors. Handbook of spectroscopy. Weinheim, Germany: Wiley-VCH; 2014 May 5.
14. Song Y, Huang YY, Liu X, Zhang X, Ferrari M, Qin L. Point-of-care technologies for molecular diagnostics using a drop of blood. Trends in Biotechnology. 2014 Mar 1;32(3):132-9.
15. Jahn IJ, Žukovskaja O, Zheng XS, Weber K, Bocklitz TW, Cialla-May D, et al. Surface-enhanced Raman spectroscopy and microfluidic platforms: challenges, solutions and potential applications. Analyst. 2017;142(7):1022-47.
16. Chen L, Choo J. Recent advances in surface-enhanced Raman scattering detection technology for microfluidic chips. Electrophoresis. 2008 May;29(9):1815-28.
17. Chen G, Wang Y, Wang H, Cong M, Chen L, Yang Y, et al. A highly sensitive microfluidics system for multiplexed surface-enhanced Raman scattering (SERS) detection based on Ag nanodot arrays. RSC Advances. 2014;4(97):54434-40.
18. Hoonejani MR, Pallaoro A, Braun GB, Moskovits M, Meinhart CD. Quantitative multiplexed simulated-cell identification by SERS in microfluidic devices. Nanoscale. 2015;7(40):16834-40.
19. Novara C, Lamberti A, Chiadò A, Virga A, Rivolo P, Geobaldo F, et al. Surface-enhanced Raman spectroscopy on porous silicon membranes decorated with Ag nanoparticles integrated in elastomeric microfluidic chips. RSC Advances. 2016;6(26):21865-70.
20. Singh AK, Khan SA, Fan Z, Demeritte T, Senapati D, Kanchanapally R, et al. Development of a long-range surface-enhanced Raman spectroscopy ruler. Journal of the American Chemical Society. 2012 May 23;134(20):8662-9.
21. Gao X, Davies JP, Weaver MJ. Test of surface selection rules for surface-enhanced Raman scattering: the orientation of adsorbed benzene and monosubstituted benzenes on gold. Journal of Physical Chemistry. 1990 Aug;94(17):6858-64.
22. Moskovits M, Suh JS. Surface selection rules for surface-enhanced Raman spectroscopy: calculations and application to the surface-enhanced Raman spectrum of phthalazine on silver. The Journal of Physical Chemistry. 1984 Nov;88(23):5526-30.
23. Mahajan S, Cole RM, Soares BF, Pelfrey SH, Russell AE, Baumberg JJ, et al. Relating SERS intensity to specific plasmon modes on sphere segment void surfaces. The Journal of Physical Chemistry C. 2009 May 28;113(21):9284-9.
24. Goldberg-Oppenheimer P, Mahajan S, Steiner U. Hierarchical Electrohydrodynamic Structures for Surface- Enhanced Raman Scattering. Advanced Materials. 2012 Jun 19;24(23):OP175-80.
25. Juncker D, Schmid H, Drechsler U, Wolf H, Wolf M, Michel B, et al. Autonomous microfluidic capillary system. Analytical Chemistry. 2002 Dec 15;74(24):6139-44.
26. Banbury C, Mason R, Styles I, Eisenstein N, Clancy M, Belli A, et al. Development of the self optimising Kohonen Index Network (sKiNet) for Raman spectroscopy based detection of anatomical eye tissue. Scientific Reports. 2019 Jul 25;9(1):1-9.
27. Banbury C, Mason R, Styles I, Eisenstein N, Clancy M, Belli A, et al. Spectroscopic Detection of Traumatic Brain Injury Severity and Biochemistry from the Retina. Biomedical Optics Express. 2020;399473.
28. Rigotti DJ, Inglese M, Gonen O. Whole-brain N-acetylaspartate as a surrogate marker of neuronal damage in diffuse neurologic disorders. American Journal of Neuroradiology. 2007 Nov 1;28(10):1843-9.
29. Li C, Shah KA, Narayan RK. Rapid detection of traumatic brain injury. Nature Biomedical Engineering. 2020 Jun;4(6):579-80.