Abstract
Background: Rheumatic diseases are one of the most common problems in modern societies. The majority of rheumatic diseases occur when the human immune system attacks its own tissues, including the joints. Therefore, the aim of this study was to investigate the effect of sex, age, and drugs on element levels in synovial fluids originating from patients with arthritis and rheumatic diseases.
Methods: This study was based on a flame atomic absorption (FAAS) and emission spectroscopic analysis (AES) of the concentration of selected essential elements, including both microelements (iron, zinc, copper, and manganese) and macro elements (calcium, magnesium, sodium, and potassium) and their interpretation by statistical methods.
Results: The concentrations of essential elements in synovial fluids showed the following order: Mn > Fe > Zn > Cu for microelements, and Na > Mg > Ca > K for macro elements. It was also revealed that in the case of arthritis (rheumatic disease) several elements, such as Fe, Zn, K, Mg, and Ca were accumulated in the synovial fluid. The linear correlation coefficients indicated statistically significant relationships among elements in the investigated samples, such as Fe and Zn, and Ca and Mg. A negative correlation was found between Zn and Na.
Conclusions: The chemical profiling of synovial fluids of patients with rheumatic diseases based on the identification of essential elements and applying principal component analysis (PCA), allowed us to identify that the levels of Fe, Zn, Ca, Mg, and K have the highest impact on the differentiation of synovial fluid samples. No significant differences in element levels by sex or age were observed. The drug effect was especially significant for Zn, Cu, Na, and K, where differences in these element levels were noticed.
Keywords
Arthritis, Rheumatic disease, Synovial fluids, Micro- and macro elements
Introduction
Rheumatic diseases are one of the most common problems in modern societies. The majority of rheumatic diseases occur when the human immune system attacks its own tissues, including the joints. There is no single cause of rheumatic diseases. Sometimes it may be a genetic factor, but in other cases cigarette smoking is responsible for the disease, or pollution, or other factors such as an infection. Seidman and Limaiem [1] claim that “synovial fluid aspiration and analysis is a necessary therapeutic and diagnostic procedure useful in alleviating pain from a joint effusion and in the diagnosis of potentially serious joint pathologies.” Moreover, it was found that patients suffering from rheumatoid arthritis (RA) can be at increased risk of cardiovascular disease and mortality when compared to the general population [2].
It is also known that sex can be important in the development of rheumatic diseases, because they seem to affect women more than men, and women seem to have a higher risk of autoimmune diseases [3]. For example, rheumatoid arthritis (RA) is more common in women, who are two to three times more prone to developing the disease than men [4].
There are many possibilities for the treatment of rheumatic disease. Among them are pharmacological agents, such as nonsteroidal anti-inflammatory drugs, as well as opioids for patient pain relief [5]. In the diagnosis of arthritis and other rheumatic diseases the analysis of synovial fluid obtained from rheumatic patients can be helpful [6]. Synovial fluid (SF) consists of three main components, namely phospholipids of the membrane, lubricin, and hyaluronan, and the main function of SF is to lubricate the surface of the cartilage [7]. There are several studies where the possibility of the relationship between rheumatic disease and the level of elements in the synovial fluid as well as in the serum was reported [8-11]. In our previous research, it was found that diversification of synovial fluids taken from individual patients living in northern Poland can be performed based on the determination of essential elements and statistical analysis [12].
Another study of synovial fluid samples showed that periprosthetic tissue chromium and cobalt concentrations correlated weakly with whole blood and synovial fluid chromium and cobalt concentrations in a total hip replacement group [13]. The same study showed that in the resurfacing group, only the synovial fluid cobalt concentration reached a statistically significant correlation with the periprosthetic tissue cobalt concentration.
Therefore, the aim of this study was to obtain an analytical tool useful for chemical profiling of biological material, specifically synovial fluids originating from patients with rheumatic disease. This is based on atomic absorption and emission spectroscopic analysis of the concentration of selected essential elements, including both microelements (iron, zinc, copper and manganese), and macro elements (calcium, magnesium, sodium, and potassium) and their interpretation by using statistical methods.
Materials and Methods
Patients
The material used for the study consisted of 22 samples of synovial fluid obtained from patients suffering from rheumatic diseases. The volumes of the samples ranged from 1.5 to 10 mL. Prior to analysis, the samples were stored in a refrigerator at 4°C. The characteristics of the patients are given in Table 1. The ethics committee at the Medical University of Gdansk, Poland, approved the investigations of the patients (Decision No NKBBN/61/2016). Participant eligibility was based on age, sex, type of rheumatic disease, and previous treatments or health concerns. There were no exclusion criteria in this study.
| No | Sampling date | Patient’ gender | Patient’ age | Patient’ disease | Drugs taken by patients |
|---|---|---|---|---|---|
| 1 | IV. 2018 | Woman | 71 | M17 | Euflexxa |
| 2 | IV. 2018 | Woman | 71 | M17, arthrosis | Euflexxa |
| 3 | IV. 2018 | Man | 70 | M17, arthrosis, hypotension | Depo-Medrol |
| 4 | I. 2019 | Woman | 53 | chondropathy | No drug |
| 5 | I .2019 | Woman | 55 | ganglion cyst | Depo-Medrol |
| 6 | II. 2019 | Man | 56 | L44, L23 | Metronidat |
| 7 | II. 2019 | Man | 60 | M23, M94 | Euflexxa |
| 8 | II. 2019 | Man | 78 | L44, chondromalatio patellae | Metronidat |
| 9 | II. 2019 | Man | 58 | rheumatoid arthritis | Euflexxa |
| 10 | III. 2019 | Man | 58 | rheumatoid arthritis | Euflexxa |
| 11 | III. 2019 | Man | 58 | rheumatoid arthritis | Euflexxa |
| 12 | III. 2019 | Man | 60 | M23, M94 | Euflexxa |
| 13 | III. 2019 | Man | 60 | M23, M94 | Euflexxa |
| 14 | IV. 2019 | Woman | 81 | M23 | Euflexxa |
| 15 | IV. 2019 | Woman | 81 | M23 | Euflexxa |
| 16 | IV. 2019 | Woman | 81 | M23 | Euflexxa |
| 17 | IX. 2019 | Woman | 64 | M23 | No drug |
| 18 | IX. 2019 | Woman | 22 | ganglion cyst | Diprophos |
| 19 | XII. 2019 | Woman | 74 | M17, E78, N39 | Flexus |
| 20 | XII. 2019 | Woman | 74 | M17, E78, N39 | Flexus |
| 21 | XII. 2019 | Man | 77 | LMM, arthrosis | Euflexxa |
| 22 | I. 2020 | Man | 64 | chondromalatio patellae | Euflexxa |
| Disease symbol based on ICD classification: E78 – disorders of lipoprotein metabolism, M17 – gonarthrosis, M23 –internal damage to the knee joint, M94 –other cartilage diseases, M47 – spondylosis, L23 – allergy, L44 – other skin diseases. | |||||
Table 1: Basic information about patients under study.
Statement of patient’s consent
The patients confirmed their consent to participate in the study and to the collection of a synovial fluid sample by signing the text: “I know that my personal data will only be used for scientific purposes and will not be disclosed. I also understand that the investigators performing the study will have access to my medical records for verification. By signing this document, I consent to access of my personal data by medical personnel”.
Instrumentation
In the experimental part of the study the following instrumentation was used: Jupiter-B microwave digestion unit (Sineo Microwave Chemistry Technology, China), atomic absorption spectrometer SpectrAA 250 plus (Varian, Australia), and laboratory centrifuge EBA 20S (Hettich Zentrifugen, Germany). Redistilled water obtained from a water distillation system (Heraeus, Switzerland) was used.
Preparation of the synovial fluid samples
The analyzed samples from the synovial fluids were centrifuged for 15 min (3200 rpm). Next, they were digested in conc. HNO3/H2O2 30% solution (5 mL/0.5 mL) in a microwave digestion unit, applying the following conditions: - stage I: 150°C for 10 min, - stage II: 160°C for 5 min, and stage III: 180°C for 10 min. The digests obtained in this way were transferred to 25 mL volumetric flasks and the volume was made up with redistilled water. Prior to analysis, the samples were stored in a refrigerator at 4°C.
Procedures for metallic element determinations
Metallic elements in the digests obtained from the synovial fluid samples were determined by the FAAS technique using the external calibration method. The mixture of gases used was: air/acetylene. For quantitative determination of the elements the following analytical wavelengths [nm] were applied: Zn (214.0), Cu (325.0), Fe (248.0), Mn (280.0), Mg (285.2), Ca (422.7), K (766.5), and Na (589.0). The concentrations of the microelements (Zn, Cu, Fe, and Mn) were determined directly in the digests from the synovial fluids, whereas the levels of the macro elements (Mg, Ca, Na, and K) were assayed after appropriate dilutions of the digests (100 times).
Prior to the quantitation of Mg and Ca, to analyze the samples, 1 mL of 1% La solution was added to prevent interference. For Na and K determinations, both were assayed using the emission mode of the AAS spectrometer, and to each sample, a 1% solution of Cs was added to avoid interference during measurements. The final results for the metallic elements were calculated in milligrams per 100 mL of synovial fluid and are presented in Table 2 in the next section.
The recovery and precision of the measurements were checked as described in a previous study [12] using the certified reference material – “Seronorm” Trace Elements Serum L-2. The accuracy achieved was 71% for Mg to 102% for Ca, whereas the precision calculated as RSD was 1.2% for Na to 8.3% for Mn.
| Sample | Ca | Mg | Na | K | Fe | Zn | Cu | Mn |
|---|---|---|---|---|---|---|---|---|
| 1 | 73.87-115.75; 98.33 ± 21.81 | 143.25-148.62; 146.46 ± 2.83 | 8.12-10.62; 9.00 ± 1.41 | 30.00-34.13; 31.75 ± 2.13 | 1092.50-1456.00; 1301.00 ± 190.19 | 1108.00-1119.00; 1112.83 ± 5.62 | 70.50-80.50; 75.17 ± 5.03 | 579.00-589.00; 585.16 ± 5.39 |
| 2 | 66.50-69.25; 67.58 ± 1.46 | 181.25-267.50; 227,71 ± 43.51 | 20.25-23.75; 22.38 ± 1.86 | 17.38-20.12; 18.46 ± 1.46 | 954.50-1028.50; 994.33 ± 37.32 | 1399.00-1416.00; 1408.67 ± 8.74 | 57.50-62.50; 59.33 ± 2.75 | 976.50-979.55; 978.17 ± 1.53 |
| 3 | 54.37-64.50; 58.79 ± 5.18 | 114.87-142.50; 126.17 ± 14.48 | 18.00-25.00; 21.17 ± 3.55 | 30.25-36.62; 33.46 ± 3.19 | 887.00-894.00; 889.67 ± 3.78 | 1752.50-1757.50; 1754.83 ± 2.51 | 83.00-101.00; 92.67 ± 9.07 | 714.00-721.50; 718.20 ± 3.82 |
| 4 | 10.00-15.00; 13.21 ± 2.78 | 26.62-33.12; 28.87 ± 3.68 | 69.62-72.00; 70.83 ± 1.19 | 20.00-26.25; 22.92 ± 3.15 | 379.50-381.50; 380.67 ± 1.04 | 315.00-319.00; 317.67 ± 2.30 | 71.50-84.00; 77.50 ± 6.65 | |
| 5 | 12.25-13.50; 12.83 ± 0.63 | 23.62-29.75; 26.12 ± 3.21 | 55.50-57.38; 56.33 ± 0.95 | 13.25-20.25; 16.58 ± 3.51 | 254.50-259.50; 256.33 ± 2.75 | 298.00-300.00; 298.83 ± 1.04 | 15.00-18.50; 16.33 ± 1.89 | |
| 6 | 11.00-15.75; 13.25 ± 2.38 | 16.75-22.12; 19.04 ± 2.77 | 94.00-96.50; 95.33 ± 1.26 | 16.50-18.62; 17.71 ± 1.09 | 133.00-136.50; 135.00 ± 1.80 | 123.00-124.00; 123.50 ± 0.50 | 100.00-112.50; 105.33 ± 6.45 | |
| 7 | 33.75-36.5; 34.87 ± 1.44 | 47.25-48.75; 48.04 ± 0.75 | 62.50-63.00; 62.75 ± 0.25 | 8.50-10.00; 9.04 ± 0.83 | 149.50-161.00; 153.33 ± 6.64 | 13.00-14.50; 13.67 ± 0.76 | 70.00-81.00; 77.16 ± 6.21 | |
| 8 | 25.62-28.25; 26.83 ± 1.32 | 43.37-46.75; 45.25 ± 1.72 | 120.38-124.75; 122.37 ± 2.21 | 17.75-19.12; 18.42 ± 0.69 | 132.50-147.50; 141.17 ± 7.76 | 7.50-8.50; 8.00 ± 0.50 | 64.50-71.50; 69.00 ± 3.90 | |
| 9 | 12.25-15.00; 13.67 ± 1.38 | 19.75-26.25; 22.96 ± 3.25 | 72.00-73.62; 72.58 ± 0.90 | 5.00-5.63; 5.29 ± 0.31 | 137.50-140.50; 138.83 ± 1.53 | 22.50-25.00; 23.83 ± 1.26 | 111.00-130.50; 117.67 ± 11.12 | |
| 10 | 20.13-24.00; 22.21 ± 1.95 | 29.00-29.50; 29.21 ± 0.26 | 90.50-95.88; 93.25 ± 2.69 | 7.88-8.87; 8.33 ± 0.51 | 108.50-112.00; 110.00 ± 1.80 | 82.00-84.00; 82.83 ± 1.04 | 126.50-136.50; 132.50 ± 5.29 | |
| 11 | 12.75-17.87; 15.17 ± 2.57 | 19.12-26.00; 22.54 ± 3.44 | 75.62-76.50; 76.08 ± 0.44 | 7.25-9.87; 8.38 ± 1.35 | 108.50-110.00; 109.50 ± 0.87 | 96.50-97.00; 96.67 ± 0.29 | 146.50-157.50; 151.67 ± 5.53 | |
| 12 | 12.12-13.25; 12.87 ± 0.65 | 18.87-24.87; 21.92 ± 3.01 | 89.62-94.00; 91.33 ± 2.34 | 11.88-13.50; 12.54 ± 0.85 | 136.50-145.50; 140.83 ± 4.51 | 47.50-49.00; 48.00 ± 0.86 | 98.00-111.00; 102.67 ± 7.23 | |
| 13 | 31.37-32.15; 31.6 ± 0.40 | 38.62-40.35; 39.30 ± 0.90 | 61.12-61.50; 61.30 ± 0.20 | 7.50-8.75; 8.10 ± 0.60 | 144.50-153.50; 149.83 ± 4.73 | 60.00-61.00; 60.50 ± 0.50 | 90.00-96.50; 93.80 ± 3.40 | |
| 14 | 17.04-18.16; 17.41 ± 0.65 | 25.60-26.08; 25.84 ± 0.24 | 103.60-104.08; 103.89 ± 0.25 | 5.92-6.80; 6.29 ± 0.45 | 112.00-117.60; 114.13 ± 3.03 | 4.00-4.40; 4.27 ± 0.23 | 123.60-129.20; 126.00 ± 2.88 | |
| 15 | 11.52-14.96; 13.28 ± 1.72 | 22.16-25.52; 23.31 ± 1.92 | 56.64-58.96; 57.57 ± 1.23 | 4.80-4.88; 4.83 ± 0.05 | 100.80-105.60; 102.80 ± 2.50 | 4.40-4.80; 4.67 ± 0.23 | 123.20-145.20; 132.67 ± 11.32 | |
| 16 | 22.56-23.04; 22.83 ± 0.24 | 33.36-33.60; 33.49 ± 0.12 | 100.88-102.80; 102.03 ± 1.01 | 6.88-7.76; 7.36 ± 0.45 | 95.20-99.20; 97.73 ± 2.20 | 0.80-1.20; 1.07 ± 0.23 | 134.40-147.20; 139.87 ± 6.60 | |
| 17 | 14.88-18.24; 16.13 ± 1.83 | 28.56-34.24; 31.44 ± 2.84 | 91.60-92.40; 92.00 ± 0.40 | 13.60-14.40; 13.89 ± 0.44 | 195.60-197.20; 196.67 ± 0.92 | 112.80-114.00; 113.33 ± 0.61 | 160.80-162.80; 161.73 ± 1.07 | |
| 18 | 8.32-9.52; 8.85 ± 0.61 | 12.16-13.12; 12.72 ± 0.50 | 22.80-23.68; 23.33 ± 0.47 | 5.12-5.76; 5.39 ± 0.33 | 80.80-83.2; 82.00 ± 1.20 | 119.20-120.80; 119.87 ± 0.83 | 26.00-32.80; 30.27 ± 3.72 | |
| 19 | 8.56-9.76; 9.17 ± 0.60 | 18.64-23.52; 20.67 ± 2.54 | 76.96-77.12; 77.04 ± 0.08 | 9.12-9.44; 9.25 ± 0.16 | 141.20-145.60; 143.60 ± 2.23 | 46.40-48.40; 47.47 ± 1.01 | 105.20-106.40; 105.73 ± 0.61 | |
| 20 | 9.36-11.84; 10.96 ± 1.38 | 16.72-18.88; 17.84 ± 1.08 | 63.44-63.92; 63.65 ± 0.24 | 6.72-7.52; 7.03 ± 0.44 | 121.60-126.80; 123.73 ± 2.72 | 30.80-31.60; 31.20 ± 0.40 | 102.00-107.60; 104.53 ± 2.84 | |
| 21 | 17.92-18.72; 18.40 ± 0.42 | 26.88-29.92; 28.21 ± 1.55 | 56.00-57.04; 56.40 ± 0.56 | 4.40-5.28; 4.75 ± 0.47 | 134.00-139.60; 136.93 ± 2.81 | 28.80-30.40; 29.73 ± 0.83 | 83.20-100.00; 92.27 ± 8.48 | |
| 22 | 11.60-12.32; 12.00 ± 0.37 | 24.00-30.16; 27.17 ± 3.08 | 73.52-73.76; 73.63 ± 0.12 | 7.60-8.24; 7.84 ± 0.35 | 275.20-297.60; 284.13 ± 11.87 | 56.00-56.40; 56.13 ± 0.23 | 146.00-156.00; 149.60 ± 5.57 | |
|
Mean ± SD |
25.012 ± 22.341 |
46.558 ± 52.300 |
72.057 ± 26.707 |
12.617 ± 8.306 |
0.281 ± 0.331 |
0.262 ± 0.491 |
0.101 ± 0.038 |
0.760 ± 0.200 |
|
Median |
15.650 | 27.693 | 73.105 | 8.709 | 0.141 | 0.059 | 0.104 | 0.718 |
|
The range, the arithmetic mean ± SD are in mg/100 mL for macroelements and in µg/100 mL for microelements; LOD – limit of detection. |
||||||||
Table 2: The detailed results of determination of essential elements in synovial fluid samples.
Results and Discussion
Analyzing the results of the microelement concentrations in the synovial fluids, as observed in Table 2 showing the arithmetic mean and median values, it is possible to notice the following decreasing order among the microelements: Mn, Fe, Zn, and Cu. However, it must be stressed that in the case of manganese, this element was determined in only 3 samples of synovial fluids. They were originating from the same patient in 2018, and one sample from another person was also analyzed in the same year. By comparison of the results in terms of the arithmetic mean and median, one can see large differences between these parameters, especially for iron and zinc. This points to the massive variabilities in the levels of these particular elements within the studied samples. On the other hand, such a situation is not noticeable for copper and manganese, which show no significant differences in the synovial fluid samples under study. The last rows of Table 2 show the values of the arithmetic mean and median obtained for all analyzed samples.
Comparing the results with those obtained in previous years from synovial fluids [12],it is possible to state that for Fe, higher amounts of this element were found now (p=0.047) than in the samples analyzed in 2017. Similarly, higher levels of Mn were found for the samples analyzed within this study (p=0.000), when compared with the results for synovial fluids from patients studied in 2017. These data are shown in Table 3, which presents the results of Student’s t-test for two groups of synovial fluid samples, obtained in this study and in 2017. Analysis of these data indicates that the results for Cu are in the opposite order, which means that lower concentrations (p=0.040) of this element were found in synovial fluids now than in those analyzed previously. Only for Zn were there no statistically significant differences (p=0.457) between the levels in both groups.
|
Elements concentrations |
The mean |
The mean |
t |
p |
Difference statistically significant (α<0.05) |
|---|---|---|---|---|---|
| Fe 2017 - Fe 2020 | 178.1 | 281.0 | -2.02 | 0.047 |
Yes |
| Zn 2017 - Zn 2020 | 321.1 | 261.7 | 0.75 | 0.457 |
No |
| Cu 2017 - Cu 2020 | 169.8 | 100.7 | 2.08 | 0.040 |
Yes |
| Mn 2017 - Mn 2020 | 51.8 | 760.3 | -19.5 | 0.000 |
Yes |
| Ca 2017 - Ca 2020 | 41.4 | 25.0 | 2.76 | 0.007 |
Yes |
| Mg 2017 - Mg 2020 | 13.6 | 46.6 | -5.13 | 0.000 |
Yes |
| Na 2017 - Na 2020 | 193.2 | 72.1 | 9.35 | 0.000 |
Yes |
| K 2017 - K 2020 | 167.5 | 12.6 | 8.37 | 0.000 |
Yes |
Table 3: Results of Student-t test between the mean of elements determinations achieved at various collection periods.
The results of the macro elements in the synovial fluids, also shown in Table 2, allow for the statement that their concentrations represent the following decreasing order: Na, Mg, Ca, and K. Moreover, the values of the arithmetic mean and median for the studied macro elements do not differ significantly, as was also noticed for the microelements. This shows that the levels of macro elements in the synovial fluids are in a comparable range of concentrations in all samples under study. However, for Ca, Mg, and K, the arithmetic mean is slightly higher than the median for these elements, and only for Na are they practically the same.
Referring to the obtained results of macro- and microelements with those achieved in other studies, the Cu and Zn levels are usually found to be higher in patients suffering from rheumatic diseases [10,13,14]. Similarly, in our study in several samples of the synovial fluids, higher levels of these microelements were found. For example, samples 14-16, taken from the same patient, contained Cu at approximately 0.30 – 0.37 mg/100 mL.
To determine whether the sex of patients had an impact on the level of analyzed elements, Student’s t-test was applied. However, the results of this calculation led to the conclusion that no statistically significant differences (α<0.05) by sex were found. This is in contradiction with the results of other researchers, who have identified sex differences [3,4]. The reason for this may be the small size of our sample.
The investigated group of patients can be divided by their age. In the age interval from 20 to 49 years, only one sample was collected (22-year-old woman – sample 18). In the following age interval, from 50 to 69 years, 11 samples were analyzed, whereas the oldest age range, above 70, was represented by 10 samples (Table 1). However, excluding the data linked to patient 18, no significant differences were identified by age.
The impact of medications on the levels of the studied elements was also investigated. Statistically significant differences (α<0.05) based on the results of one-way ANOVA calculations were found for the following elements: Zn, Cu, Na, and K. In the case of Zn levels these differences were identified between the synovial fluids from patients treated with Euflexxa and Depo-Medrol. Similarly, the level of Cu was different for patients treated with Euflexxa and Depo-Medrol, as well as for patients who took Euflexxa and Diprophos. For Na, significant differences were found for 6 cases: Euflexxa and Depo-Medrol, Euflexxa and Metronidat, Euflexxa and Diprophos, Depo-Medrol and Metronidat, Diprophos and Metronidat, and between those who took Diprophos and those who took no drugs. In the case of K, statistically significant differences were noted for patients who were given Depo-Medrol and Euflexxa, Depo-Medrol and Diprophos, and Depo-Medrol and Flexus.
The results of the linear correlation between the concentrations of the particular elements are presented in Table 4. In the analysis of these data, it is possible to note that the most frequently correlated elements are Fe, Zn, K, and Mg. In particular, high correlations of approximately 0.9 were found for the following pairs of elements: Fe - Zn, Fe - Ca, and Fe - Mg. On the other hand, a negative relationship was registered for the pair: Zn - Na. Many of these correlations confirmed conclusions found in a previous study on elements and their relations in synovial fluids from patients living in northern Poland [12]. Based on this, it can be stated that in the case of rheumatic disease, several elements have a tendency to accumulate in synovial fluids, especially elements that correlated with each other, such as Fe, Zn, Mg, and Ca. This fact should be considered for clinical profiling of patients with arthritis and rheumatic disease in future studies.
The principal component analysis is a pattern recognition method and is an especially useful statistical tool for the interpretation of large experimental databases [15,16]. Based on the concentrations of 7 elements (Fe, Zn, Cu, Ca, Mg, Na, and K) in 22 samples of the synovial fluids from patients suffering from rheumatic diseases (objects) the experimental matrix was created with the dimensions of 22 x 7. Next, this matrix was standardized and 2 new matrices were calculated, called the principal component result matrix and the loading matrix. The results of the PCA calculation indicated that the first three principal components together described 92.5% of the variability among the studied data. Although the first two principal components described 82.7% of the variability, taking into consideration the eigenvalues above 1.0, it was decided to present the PCA scores in a two-dimensional plot in Figure 1.
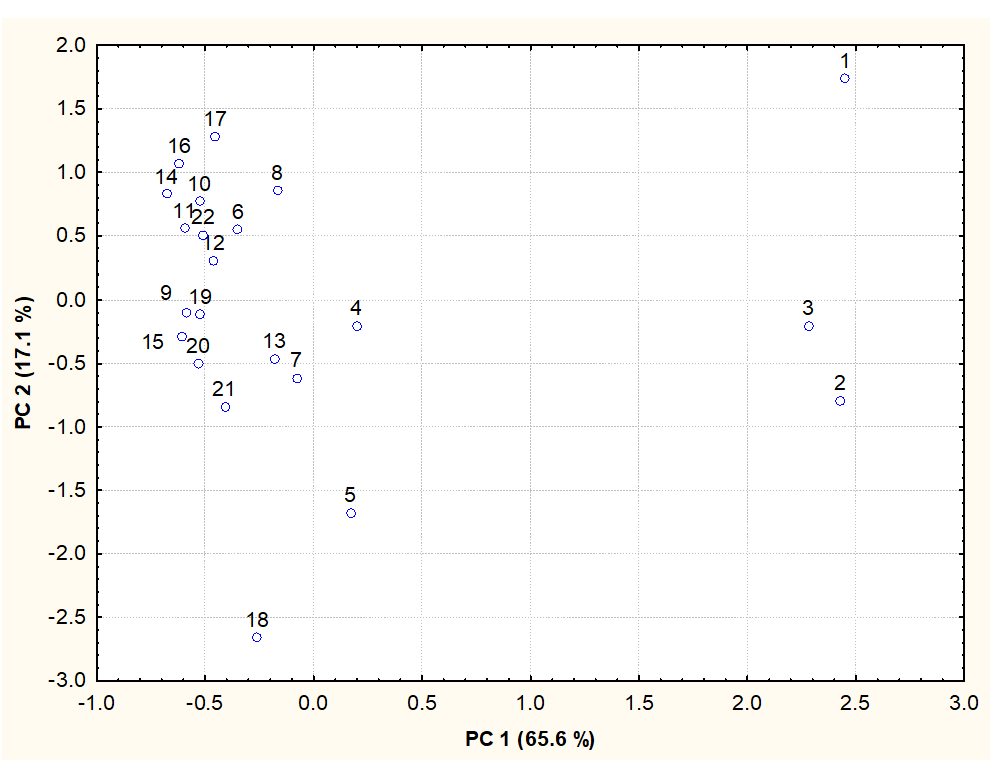
Figure 1. Scatterplot of the first two principal components obtained for synovial fluid samples.
Analyzing this score plot, three synovial fluid samples with numbers 1-3, which are located in the right area of Figure 1, are noteworthy. Samples with numbers 1 and 2 were taken from the same patient born in 1947, and they had high zinc, iron, and manganese levels in comparison with the other samples of synovial fluids. Moreover, this person suffered from arthrosis (Table 1) and was under treatment with Euflexxa preparation. Sample 3 belonged to a patient who was cured with Depo-Medrol, and he also had severe symptoms of arthrosis. In the lower left part of the plot, sample numbers 5 and 18 are notable. Sample 18 was taken from a patient who was under treatment with Diprophos preparation, whereas sample 5 was taken from a patient cured with Depo-Medrol, and both of them had ganglion. Moreover, patient 18 was the youngest person among the patients, which could be the reason for the different concentrations of elements in her synovial fluid.
It is worth noting that the samples originating from the same patient, such as the sample numbers 9, 10, and 11, as well as sample numbers 14, 15, and 16, can be found in the left upper area of the plot, which points to similar levels of the elements on a per-patient basis. For example, in samples 14-16, a characteristic high concentration of sodium was found, together with a low potassium level, when compared with other samples of synovial fluids taken from the other patients.
Figure 2 shows the loadings of the two first principal components. The first principal component (PC1) is positively correlated with microelements such as Fe and Zn, as well as with Ca and Mg, and only weakly with K. This was reflected by the distribution of the synovial fluid samples shown in Figure 1, where the samples with high concentrations of the elements listed above can be found in the right area of the plot. The second principal component (PC 2) is related to the levels of Cu and Na. This is illustrated by the distribution of the samples of synovial fluids rich in Cu and Na (Figure 1), with numbers 14-16 and sample 17. They can be located in the left upper area of the plot. On the other hand, the characteristic sample 18 is situated in the lower part of the plot, and its location was caused by a low Na level. The same can be noted for sample 5, where a low Cu concentration and a relatively low level of Na were found.
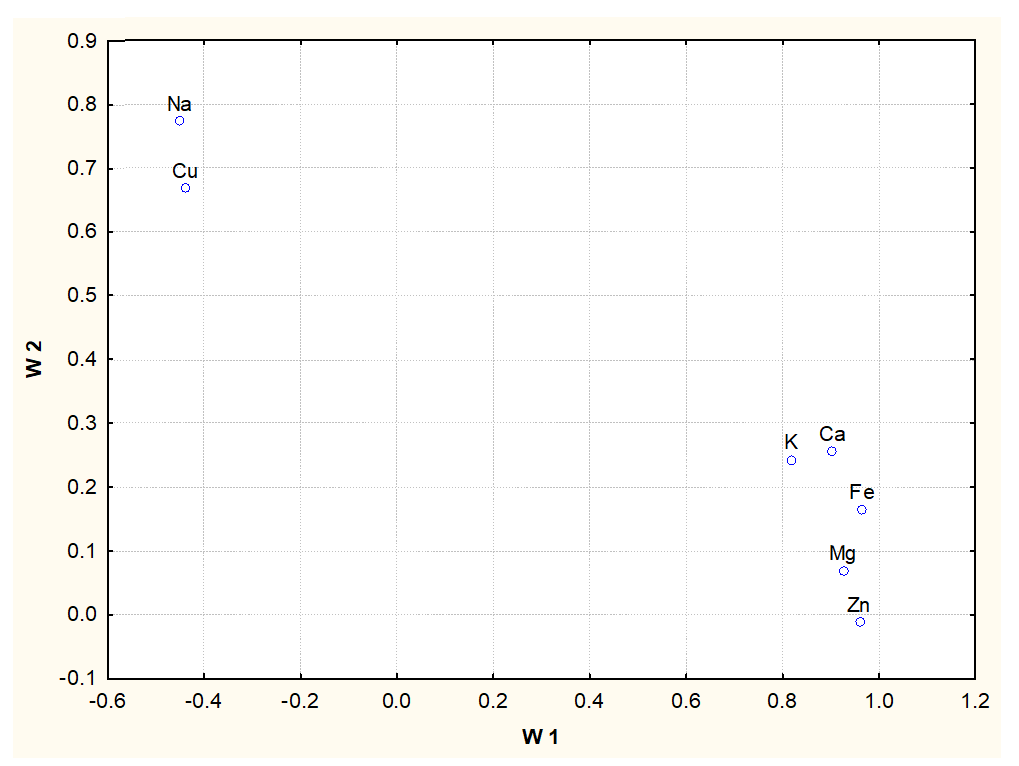
Figure 2. Loading plot of the first two principal components obtained for synovial fluid samples.
Conclusions
The results of element analysis in synovial fluids taken from patients with rheumatic diseases demonstrated the following decreasing order of concentration: Mn, Fe, Zn, and Cu for the microelements, and Na, Mg, Ca, and K for the macro elements. Moreover, it was noticed that during rheumatic disease, several elements (Fe, Zn, K, Mg, and Ca) accumulate in synovial fluids, and this could have clinical implications in future. Several statistically significant correlations were found among the studied elements, such as the positive relationships for the pairs: Fe - Zn, Fe - Ca, Fe - Mg, and the negative correlation for the pair: Zn–Na.
No significant differences in element levels due to sex or age were found. However, a drug effect was especially significant for Zn, Cu, Na and K, where differences in these element levels were noticed. The principal component analysis appeared to be a useful statistical tool, which helped to indicate that the concentrations of iron, zinc, calcium, magnesium, and potassium have the highest impact on the diversification of the analyzed biological material.
Conflict of Interest Statement
The authors declare that they have no conflicts of interest.
Author Contributions
Pawel Konieczynski – planning the experimental part, performing the measurements, calculation of statistics, writing the manuscript.
Grzegorz Szreder – planning the experimental part, selection of patients for study, medical care of patients.
Marek Wesolowski – scientific consultation during writing the manuscript.
References
2. Mašić D, Stengaard-Pedersen K, Løgstrup BB, Hørslev-Petersen K, Hetland ML, Junker P, et al. Similar lipid level changes in early rheumatoid arthritis patients following 1-year treat-to-target strategy with adalimumab plus methotrexate versus placebo plus methotrexate: secondary analyses from the randomised controlled OPERA trial. Rheumatology International. 2021 Mar;41(3):543-9.
3. Kedia AK, Ravindran V. Influence of Gender on Autoimmune Rheumatic Diseases. In: Sharma S. (eds) Women's Health in Autoimmune Diseases. Singapore: Springer. 2020; pp:17-28.
4. Tincani A, Gerardi MC, Fredi M, Andreoli L. Gender differences in rheumatology and the point of view of the Italian Society for Rheumatology (SIR). Italian Journal of Gender-Specific Medicine. 2018 Apr 1;4(2):79-82.
5. Rannou F, Pelletier JP, Martel-Pelletier J. Efficacy and safety of topical NSAIDs in the management of osteoarthritis: evidence from real-life setting trials and surveys. In: Seminars in Arthritis and Rheumatism 2016 Feb 1 (Vol. 45, No. 4, pp. S18-S21). WB Saunders.
6. Dandé Á, Nöt LG, Wiegand N, Kocsis B, Lőrinczy D. DSC analysis of human synovial fluid samples in the diagnostics of non-septic and septic arthritis. Journal of Thermal Analysis and Calorimetry. 2017 Dec;130(3):1249-52.
7. Kosinska MK, Liebisch G, Lochnit G, Wilhelm J, Klein H, Kaesser U, et al. A lipidomic study of phospholipid classes and species in human synovial fluid. Arthritis and Rheumatism. 2013 Sep;65(9):2323-33.
8. Yazar M, Sarban S, Kocyigit A, Isikan UE. Synovial fluid and plasma selenium, copper, zinc, and iron concentrations in patients with rheumatoid arthritis and osteoarthritis. Biological Trace Element Research. 2005 Aug 1;106(2):123-132.
9. Ullah Z, Ullah MI, Hussain S, Kaul H, Lone KP. Determination of serum trace elements (Zn, Cu, and Fe) in Pakistani patients with rheumatoid arthritis. Biological Trace Element Research. 2017 Jan 1;175(1):10-16.
10. Xin L, Yang X, Cai G, Fan D, Xia Q, Liu L, et al. Serum levels of copper and zinc in patients with rheumatoid arthritis: a meta-analysis. Biological Trace Element Research. 2015 Nov;168(1):1-10.
11. Afridi HI, Talpur FN, Kazi TG, Brabazon D. Estimation of toxic elements in the samples of different cigarettes and their effect on the essential elemental status in the biological samples of Irish smoker rheumatoid arthritis consumers. Environmental Monitoring and Assessment. 2015 Apr;187(4):1-6.
12. Konieczynski P, Szreder G, Tamowska E, Wesolowski M. Essential elements in synovial fluid samples obtained from patients living in Northern Poland. Journal of Trace Elements in Medicine and Biology. 2018 Jul 1;48: 20-4.
13. Lehtovirta L, Reito A, Parkkinen J, Peräniemi S, Vepsäläinen J, Eskelinen A. Association between periprosthetic tissue metal content, whole blood and synovial fluid metal ion levels and histopathological findings in patients with failed metal-on-metal hip replacement. PloS One. 2018 May 16;13(5): e0197614.
14. Ma Y, Zhang X, Fan D, Xia Q, Wang M, Pan F. Common trace metals in rheumatoid arthritis: A systematic review and meta-analysis. Journal of Trace Elements in Medicine and Biology. 2019 Dec 1;56: 81-9.
15. Otto M. Chemometrics Statistics and Computer Application in Analytical Chemistry. Weinheim, Germany: Wiley-VCH. 1999.
16. Andrade DF, Pereira-Filho ER, Konieczynski P. Comparison of ICP OES and LIBS analysis of medicinal herbs rich in flavonoids from Eastern Europe. Journal of the Brazilian Chemical Society. 2017;28: 838-47.