Abstract
Blood-based biomarkers have demonstrated strong performance for identifying cerebral amyloid pathology within individual cohorts. However, their clinical utility depends on portability across populations and assay platforms. The impact of cross-cohort deployment on clinically actionable metrics such as negative predictive value remains insufficiently characterized. We analyzed data from two independent cohorts: the Alzheimer’s Disease Neuroimaging Initiative (n = 885) and the Anti-Amyloid Treatment in Asymptomatic Alzheimer’s Disease study (n = 822). Machine learning models were developed within each cohort to predict amyloid positron emission tomography status and continuous amyloid burden. Performance was evaluated using area under the receiver operating characteristic curve, accuracy, coefficient of determination, and root mean square error. Cross-cohort portability under pairwise external validation was assessed using bidirectional transfer without retraining. Calibration, predictive values, and decision curve analysis were used to evaluate clinical utility. Within-cohort discrimination was high, with area under the curve up to 0.917–0.918 in the Alzheimer’s Disease Neuroimaging Initiative and 0.870 in the Anti-Amyloid Treatment in Asymptomatic Alzheimer’s Disease cohort. Prediction of continuous amyloid burden was moderate (coefficient of determination up to 0.628 and 0.535, respectively). Cross-cohort deployment resulted in modest attenuation of discrimination but substantially greater degradation in clinically actionable performance. Negative predictive value declined from 0.831 to 0.644 when models trained in the Alzheimer’s Disease Neuroimaging Initiative were applied to the Anti-Amyloid Treatment in Asymptomatic Alzheimer’s Disease cohort, despite preserved discrimination. Calibration analyses demonstrated systematic probability misestimation, and decision curve analysis showed reduced net clinical benefit. Biomarker distributions differed across cohorts, consistent with dataset shift. Blood-based biomarker models retain discrimination across cohorts but exhibit clinically meaningful degradation in predictive value under real-world deployment conditions. Calibration instability and population differences critically affect rule-out performance. These findings highlight the need for cross-cohort validation, calibration assessment, and assay-consistent biomarker generation prior to clinical implementation.
Keywords
Alzheimer’s disease, Plasma biomarkers, Amyloid PET, Machine learning, Pairwise external validation, Calibration, Negative predictive value
Introduction
Alzheimer’s disease (AD) is a major and growing public health concern. It is now well established that pathological changes in the brain begin 10–20 years before memory loss leading to clinical symptoms and diagnosis [1–3]. Despite tremendous advances in therapeutic development, the treatments available today have limited effectiveness in individuals with established symptomatic disease and substantial amyloid deposits and tau pathology [4–8].
Some anti-amyloid therapeutics have demonstrated the ability to reduce amyloid plaque burden and slow clinical decline in early symptomatic AD [9,10]. In parallel, ongoing prevention trials such as AHEAD 3-45 (NCT04468659) [11] are testing whether similar approaches can slow biomarker progression in asymptomatic or preclinical individuals. These developments highlight the importance of identifying individuals at the earliest stages of disease, prior to the onset of cognitive symptoms, when therapeutic interventions may be most effective.
In addition to pharmacological approaches, a growing body of evidence indicates that modifiable lifestyle and vascular risk factors contribute significantly to dementia risk. Multidomain interventions targeting diet, physical activity, cognitive engagement, and cardiovascular health have demonstrated benefits on cognitive outcomes in at-risk populations, and large-scale analyses suggest that a significant proportion of dementia cases may be attributable to modifiable factors [6,12,13]. These findings support the concept that early identification of underlying AD pathology may provide a critical window for intervention, during which both pharmacologic and nonpharmacologic strategies can be implemented to delay or mitigate disease progression.
Accordingly, early detection of amyloid and tau pathology using blood-based biomarkers in asymptomatic individuals represents a key step toward effective prevention and disease modification. Amyloid positron emission tomography (PET) and cerebrospinal fluid (CSF) biomarkers as reference markers for identification of cerebral amyloid deposition are still accepted and widely used for reference [14–17]. However, their high cost, invasive nature, and limited accessibility restrict their broader application in screening, recruitment for clinical trials, and long-term surveillance at scale [15,17,18]. Due to these constraints, there has been a growing interest in the role of plasma-based biomarkers (PBBMs) as non-invasive and scalable tools for diagnosing AD pathology [16,17,19].
Over the past decade, PBBMs such as Aβ42/40 ratio, phosphorylated tau species (mainly p-tau217), glial fibrillary acidic protein (GFAP), and neurofilament light chain (NfL) have demonstrated robust associations with amyloid PET positivity and neurodegeneration [19-23]. Among these, Aβ42/40 and p-tau217 have achieved the best discriminative performance for the prediction of amyloid PET. Plasma Aβ42/40 assays provided values of area under receiver operating characteristic curve (AUC) of about 0.88 for amyloid PET status and 0.94 when demographic and genetic characteristics such as age and APOE ε4 status were included [17,24,25]. Most recently, p-tau217 was reported to be the best PBBM that can identify asymptomatic individuals and diagnose those that have pathological underlying lesions of amyloid and tau [26,27]. Longitudinal studies have shown that plasma p-tau217 trajectories encode temporal data regarding disease course. A recently established plasma p-tau217 “clock” model derived from repetitive biomarker measurements provides a clinically meaningful estimate of the timing of symptomatic AD emergence in harmonized cohorts [28]. These results emphasize the biological potency of plasma biomarkers, notably p-tau217, as diagnostic and diagnostic staging instruments.
However, there is an important gap in translation. Most biomarker studies, and the predictive models resulting from them, are developed and tested in a single cohort under internally reproducible assay conditions [17,29–31]. Instead, real-world deployment depends on models being implemented across populations that vary in sample composition, disease prevalence, and importantly biomarker measurement platforms. A systematic shift in the distributions of biomarkers in cohorts can arise from differences in assay calibration, analytical methods, and handling prior to analysis [32–35]. Such changes may alter the relationship between biomarkers and disease outcomes if the basic biology remains invariable. This leads to a basic question: do predictive models trained on plasma biomarker, genomic, and demographic data in one cohort extrapolate to another cohort in which the assay platforms and population characteristics are different? Although machine learning (ML) methods have been adopted to combine multimodal data and attain good within-cohort performance [36–39] the cross-cohort generalization of ML is less clear. Specifically, it remains not clear how valid and robust an individual cohort's models (e.g., ADNI [40]) may be with respect to an independent cohort (e.g., A4 [41]) which has different biomarker assays and subgroups. This problem is particularly problematic for screening purposes in clinical practice. For preclinical populations with low disease prevalence and decisions being based on rule out, the negative predictive value (NPV), for instance, is an important performance factor [16,17,42]. Unlike discrimination markers such as AUC, NPV is strongly sensitive to disease prevalence and probability calibration. Even slight changes in calibration or biomarker distribution can generate significant variations in clinically actionable performance [42–45].
In the current study, we examine performance and portability of machine learning models developed based on PBBMs under defined cross-cohort target deployment settings. We utilized PBBMs, PET, and demographics data from two complementary cohorts, ADNI [40], which covers the full spectrum of AD clinical presentation, and A4 [41], which represents a relatively well asymptomatic population. We first establish within-cohort performance, and subsequently pairwise external validation through bidirectional transfer (ADNI→A4 and A4→ADNI). We focus on discrimination, calibration, predictive values, and clinical utility. The findings indicate how variations in the PBBMs assays in different cohorts with various prevalences and clinical stages of disease affect predictive performance and highlights major hurdles of translating our PBBMs into clinical practice.
Materials and Methods
Study cohorts
This study was designed as a retrospective cross-cohort validation study evaluating model portability under dataset shift conditions. We analyzed data from two independent, well-characterized cohorts: the Alzheimer’s Disease Neuroimaging Initiative (ADNI [40]) and the Anti-Amyloid Treatment in Asymptomatic Alzheimer’s Disease (A4 [41]) study. ADNI is a longitudinal observational study designed to characterize the full clinical spectrum of Alzheimer’s disease, including cognitively normal individuals, participants with mild cognitive impairment (MCI), and patients with Alzheimer’s dementia [40]. The A4 study is a large secondary prevention trial focused on clinically normal, amyloid-screened older adults, representing a preclinical population with low disease prevalence [41]. Amyloid positivity prevalence was 46.5% in ADNI and 61.8% in A4.
All analyses were restricted to participants with complete data on plasma biomarkers, relevant covariates, and amyloid PET outcomes. This yielded 885 ADNI participants and 822 A4 participants with complete amyloid PET centiloid values and binary amyloid PET status. An additional 864 ADNI participants had complete clinical diagnosis data (cognitively normal, MCI, or dementia), which were not available in A4. Only baseline measurements were used for the present analyses to reflect realistic screening deployment conditions.
Outcomes
The primary outcome was amyloid PET status, defined as amyloid positive versus negative based on established centiloid thresholds within each cohort [14]. Secondary outcomes included continuous amyloid PET burden expressed in centiloids and, in ADNI only, multiclass clinical diagnosis. These outcomes were selected to evaluate both clinically actionable classification tasks and continuous disease burden prediction.
Plasma biomarkers and covariates
Plasma biomarkers and covariates datasets were acquired from ADNI and A4. The plasma biomarker assay platforms are described in ADNI [40] and A4 [41]. Biomarkers included phosphorylated tau (p-tau217), amyloid-β 40 (Aβ40), amyloid-β 42 (Aβ42), the Aβ42/40 ratio, GFAP, and NfL. In ADNI, two p-tau217 assays were available and analyzed separately to isolate assay-specific effects. All biomarker values were log-transformed where appropriate and standardized (z-scored) within cohort prior to modeling, consistent with prior plasma biomarker ML studies [38]. For transparency, cohort means and variances for primary biomarkers are provided in Supplementary Table S1 and distributional comparisons are shown in Figure 8 and Supplementary Figures S2–S4. When reporting within-cohort standardization we mean centering and scaling by each cohort’s empirical mean and standard deviation (i.e., z = (x − μ_cohort)/σ_cohort). We preserved raw-scale summary statistics (means and SDs) so that the effect of standardization versus raw-scale differences can be explicitly examined.
Machine learning models
We evaluated a range of supervised machine learning models commonly used in biomarker-based prediction [38,39] (Table 1). Model inputs included plasma biomarkers, demographic variables, and APOEe4 status. For classification tasks (amyloid PET status and ADNI clinical diagnosis), models included logistic regression, random forest, gradient boosting (XGBoost and LightGBM), and support vector machines with radial basis function kernels. For regression tasks predicting continuous centiloid values, models included ridge regression, random forest regression, gradient boosting models (XGBoost and LightGBM), and support vector regression.
|
Task Type |
Model Class |
Specific Models |
Notes |
|
Classification |
Linear model |
Logistic regression |
Baseline interpretable model |
|
Classification |
Ensemble (tree-based) |
Random forest |
Non-linear, bagging-based |
|
Classification |
Ensemble (boosting) |
XGBoost; LightGBM |
Gradient boosting frameworks |
|
Classification |
Kernel-based |
Support vector machine (RBF kernel) |
Non-linear decision boundary |
|
Regression |
Linear model |
Ridge regression |
L2-regularized linear model |
|
Regression |
Ensemble (tree-based) |
Random forest regression |
Non-linear, variance reduction |
|
Regression |
Ensemble (boosting) |
XGBoost; LightGBM regression |
Gradient boosting regression |
|
Regression |
Kernel-based |
Support vector regression (SVR) |
RBF kernel |
Linear and kernel-based models were implemented using pipelines with feature standardization, while tree-based and boosting models were trained on standardized input features without additional scaling. All models were implemented in Python using established machine learning libraries (e.g., scikit-learn, XGBoost, and LightGBM), with fixed random seeds to ensure reproducibility. Unless otherwise specified, default hyperparameters were used, consistent with prior comparative ML evaluations in neuroimaging and biomarker research [39]. Model processing, feature scaling and evaluation procedures were constant across cohorts to ensure compatibility.
Within-cohort model development and selection
Within each cohort, models were trained and evaluated using complete-case datasets. For binary classification, discrimination was assessed using ROC AUC as the primary metric with accuracy reported as secondary metric [46]. For centiloid regression, R² was used as the primary metric with RMSE as secondary. The best-performing model for each cohort and outcome was selected based on the primary metric and carried forward as the reference model for cross-cohort validation.
Cross-cohort validation strategy
To assess model portability under pairwise external validation, we performed bidirectional cross-cohort validation (A4→ADNI and ADNI→A4) consistent with recent work on dataset shift and model robustness [47]. Models were trained on all eligible participants in the source cohort and applied without retraining to the target cohort. Separate cross-cohort models were trained for each p-tau217 assay available in ADNI to isolate assay-specific transfer effects. No hyperparameter tuning or recalibration was performed during initial cross-cohort testing unless explicitly noted.
Calibration, predictive values, and sensitivity analyses
Given the clinical importance of rule-out performance in preclinical populations, NPV was evaluated as a key secondary metric [17,47]. PPV and NPV were estimated at fixed sensitivity thresholds defined in the training cohort using Youden’s index and applied unchanged to the test cohort to simulate deployment; confidence intervals were obtained by bootstrap resampling (1,000 iterations) [48]. Calibration was assessed using Brier scores, calibration slope, and intercept statistics [43,45,49], and we considered modern ML calibration behavior and practical recalibration approaches in our supplementary analyses. Sensitivity analyses included reciprocal training–testing directions, algorithm comparisons, p-tau217 assay variants, and subgroup analyses by APOE ε4 carrier status and sex.
Statistical analysis and reproducibility
All analyses were conducted using version-controlled Python and R scripts with pre-specified analysis plans to minimize analytic bias and data leakage. The study adhered to STROBE and TRIPOD reporting recommendations where applicable [50,51]. Summary statistics are reported with appropriate confidence intervals.
Results
Study design and population
The overall study design and analytic framework are shown in Figure 1. The analysis included two complementary cohorts, ADNI and A4, with within-cohort model development and internal validation followed by bidirectional pairwise external validation (ADNI→A4 and A4→ADNI). This design enabled evaluation of both internal performance and portability across distinct clinical and prevalence contexts. The analytic strategy, including cohort composition, outcome definitions, and performance metrics, is summarized in Figure 1. Consistent with prior work highlighting the importance of dataset shift in clinical machine learning, the pairwise external validation design was intended to stress-test portability under realistic deployment conditions [49].
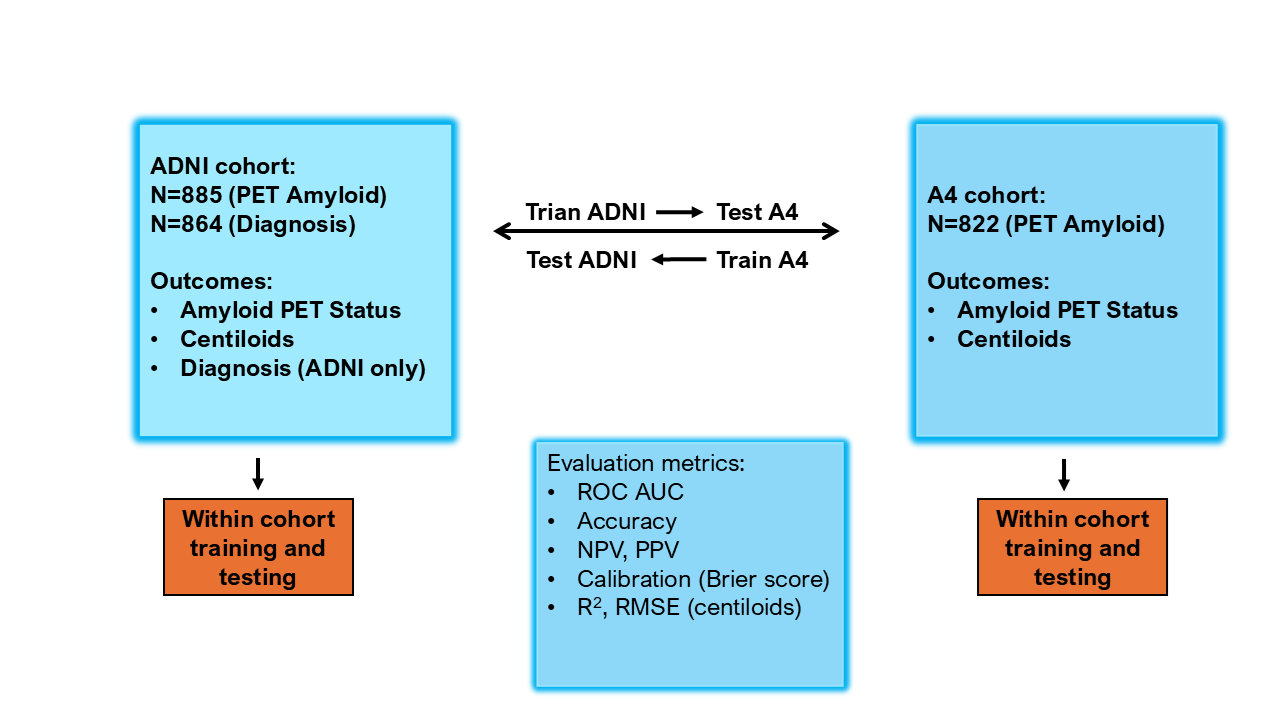
Figure 1. Study design and bidirectional pairwise external validation framework. Schematic overview of cohort composition, modeling strategy, and evaluation metrics. The ADNI cohort included N=885 participants with amyloid PET data and N=864 with clinical diagnosis; outcomes included amyloid PET status, continuous centiloid values, and diagnosis (ADNI only). The A4 cohort included N=822 participants with amyloid PET data; outcomes included amyloid PET status and centiloids. Within-cohort training and testing were performed separately in ADNI and A4. Cross-cohort portability under pairwise external validation was evaluated using bidirectional transfer (ADNI→A4 and A4→ADNI) without retraining. Model performance was assessed using discrimination metrics (ROC AUC, accuracy), predictive values (NPV, PPV), calibration (Brier score), and regression performance metrics (R² and RMSE for centiloids).
A total of 1,707 participants were included after restricting analyses to individuals with complete plasma biomarker, covariate, and amyloid PET data (ADNI, n = 885; A4, n = 822). ADNI spanned the full clinical spectrum, including cognitively normal individuals, participants with mild cognitive impairment, and patients with Alzheimer dementia [40]. In contrast, A4 comprised cognitively normal individuals enriched for amyloid negativity [41]. Amyloid positivity prevalence was 46.5% in ADNI and 61.8% in A4, establishing distinct clinical and prevalence settings for evaluating model portability [26].
Within-cohort prediction of amyloid PET status and clinical outcomes
Within-cohort supervised machine learning models demonstrated strong performance for amyloid PET classification in both cohorts (Table 2; Figure 2). In ADNI, random forest achieved the highest discrimination for amyloid status (ROC AUC = 0.918; accuracy = 0.850), with comparable performance observed across gradient boosting models and support vector machines (AUC range: 0.900–0.918). Logistic regression also performed well (ROC AUC = 0.900), indicating that linear models captured a substantial portion of the underlying biological signal. These findings are consistent with prior reports showing strong plasma p-tau217 and plasma amyloid biomarker discrimination for amyloid PET [21,26,52,53].
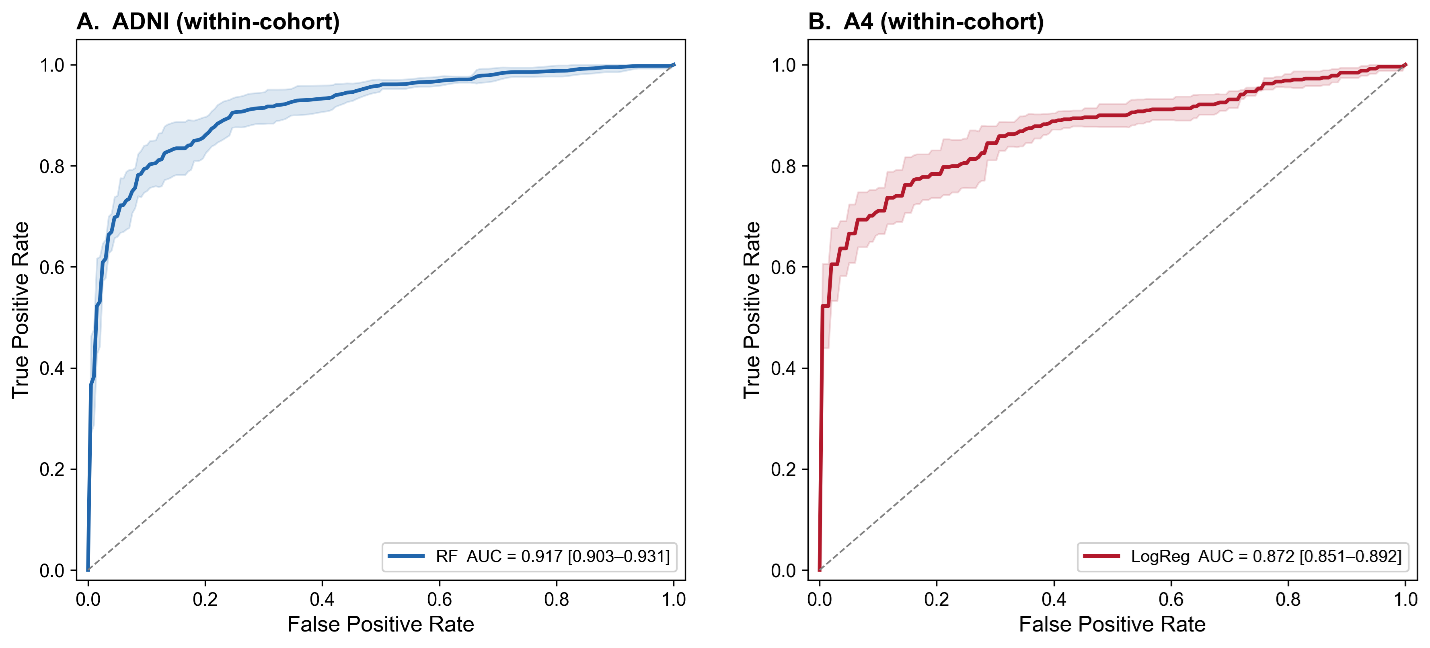
Figure 2. Receiver operating characteristic (ROC) curves for within-cohort prediction models. (A) ROC curve for the random forest (RF) model evaluated within the ADNI cohort. (B) ROC curve for the logistic regression (LogReg) model evaluated within the A4 cohort. In both panels, the solid line represents the mean model performance, and the shaded region indicates the 95% confidence interval. The diagonal dashed line denotes chance-level performance. Model discrimination was higher for the RF model in ADNI (AUC = 0.917, 95% CI: 0.903–0.931) compared to the logistic regression model in A4 (AUC = 0.872, 95% CI: 0.851–0.892).
|
Cohort |
Task |
Target |
Final Model |
Metric |
Value |
Accuracy |
N subjects (train) |
|
ADNI |
Classification |
diagnosis |
Logistic Regression |
ROC AUC OVR |
0.706 |
0.569 |
864 |
|
ADNI |
Classification |
diagnosis |
Random Forest |
ROC AUC OVR |
0.766 |
0.619 |
864 |
|
ADNI |
Classification |
diagnosis |
XGBoost |
ROC AUC OVR |
0.734 |
0.589 |
864 |
|
ADNI |
Classification |
diagnosis |
LightGBM |
ROC AUC OVR |
0.738 |
0.586 |
864 |
|
ADNI |
Classification |
diagnosis |
SVM |
ROC AUC OVR |
0.721 |
0.609 |
864 |
|
ADNI |
Classification |
amyloid_status |
Logistic Regression |
ROC AUC |
0.9 |
0.843 |
885 |
|
ADNI |
Classification |
amyloid_status |
Random Forest |
ROC AUC |
0.918 |
0.85 |
885 |
|
ADNI |
Classification |
amyloid_status |
XGBoost |
ROC AUC |
0.91 |
0.841 |
885 |
|
ADNI |
Classification |
amyloid_status |
LightGBM |
ROC AUC |
0.91 |
0.835 |
885 |
|
ADNI |
Classification |
amyloid_status |
SVM |
ROC AUC |
0.905 |
0.845 |
885 |
|
ADNI |
Regression |
centiloids |
Ridge Regression |
R² |
0.519 |
— |
885 |
|
ADNI |
Regression |
centiloids |
Random Forest |
R² |
0.628 |
— |
885 |
|
ADNI |
Regression |
centiloids |
XGBoost |
R² |
0.599 |
— |
885 |
|
ADNI |
Regression |
centiloids |
LightGBM |
R² |
0.624 |
— |
885 |
|
ADNI |
Regression |
centiloids |
SVM |
R² |
0.355 |
— |
885 |
|
A4 |
Classification |
amyloid_status |
Logistic Regression |
ROC AUC |
0.87 |
0.793 |
841 |
|
A4 |
Classification |
amyloid_status |
Random Forest |
ROC AUC |
0.867 |
0.781 |
841 |
|
A4 |
Classification |
amyloid_status |
XGBoost |
ROC AUC |
0.86 |
0.766 |
841 |
|
A4 |
Classification |
amyloid_status |
LightGBM |
ROC AUC |
0.866 |
0.784 |
841 |
|
A4 |
Classification |
amyloid_status |
SVM |
ROC AUC |
0.86 |
0.786 |
841 |
|
A4 |
Regression |
centiloids |
Ridge Regression |
R² |
0.498 |
— |
841 |
|
A4 |
Regression |
centiloids |
Random Forest |
R² |
0.535 |
— |
841 |
|
A4 |
Regression |
centiloids |
XGBoost |
R² |
0.473 |
— |
841 |
|
A4 |
Regression |
centiloids |
LightGBM |
R² |
0.506 |
— |
841 |
|
A4 |
Regression |
centiloids |
SVM |
R² |
0.341 |
— |
841 |
|
ADNI-CN |
Classification |
amyloid_status |
Logistic Regression |
ROC AUC |
0.833 |
0.807 |
436 |
|
ADNI-CN |
Classification |
amyloid_status |
Random Forest |
ROC AUC |
0.862 |
0.821 |
436 |
|
ADNI-CN |
Classification |
amyloid_status |
XGBoost |
ROC AUC |
0.87 |
0.821 |
436 |
|
ADNI-CN |
Classification |
amyloid_status |
LightGBM |
ROC AUC |
0.859 |
0.817 |
436 |
|
ADNI-CN |
Classification |
amyloid_status |
SVM |
ROC AUC |
0.839 |
0.826 |
436 |
|
ADNI-CN |
Regression |
centiloids |
Ridge Regression |
R² |
0.433 |
— |
436 |
|
ADNI-CN |
Regression |
centiloids |
Random Forest |
R² |
0.476 |
— |
436 |
|
ADNI-CN |
Regression |
centiloids |
XGBoost |
R² |
0.427 |
— |
436 |
|
ADNI-CN |
Regression |
centiloids |
LightGBM |
R² |
0.486 |
— |
436 |
|
ADNI-CN |
Regression |
centiloids |
SVM |
R² |
0.087 |
— |
436 |
In A4, logistic regression achieved the highest performance for amyloid classification (ROC AUC = 0.870; accuracy = 0.793), with tree-based and kernel-based models showing similar performance (ROC AUC range: 0.860–0.867). Discrimination was modestly lower in A4 than in ADNI, consistent with the narrower biologic dynamic range and lower clinical heterogeneity of the preclinical cohort [21,54–58].
To further evaluate the contribution of clinical heterogeneity, we performed additional within-cohort analyses restricted to cognitively normal ADNI participants only (ADNI-CN). Within this subgroup, classification performance remained strong, with XGBoost achieving the highest discrimination (ROC AUC = 0.870) and support vector machines achieving the highest accuracy (0.826). Overall performance in ADNI-CN was generally intermediate between full-spectrum ADNI and A4, reflecting the reduced clinical heterogeneity of the cognitively normal subset (Table 2). These findings suggest that plasma biomarker signal remains robust even after restricting analyses to preclinical individuals.
Within ADNI, multiclass classification of clinical diagnosis yielded lower discrimination than amyloid classification, with the best performance observed for random forest (ROC AUC OVR = 0.766). This likely reflects the more complex relationship between plasma biomarkers and clinically defined stages of cognitive impairment.
Within-cohort prediction of continuous amyloid burden
Models predicting continuous amyloid PET burden, expressed as centiloids, also performed well within cohort (Table 2). In ADNI, random forest provided the best performance (R² = 0.628), followed closely by LightGBM (R² = 0.624) and XGBoost (R² = 0.599). In A4, performance was more modest but still meaningful, with the best result achieved by random forest (R² = 0.535). These findings suggest that plasma biomarkers capture not only binary amyloid status but also a substantial portion of quantitative amyloid burden [19,31,58].
Within the cognitively normal ADNI subgroup (ADNI-CN), regression performance was reduced relative to the full ADNI cohort, with the best result achieved by LightGBM (R² = 0.486). Nevertheless, substantial predictive signal remained despite restriction to cognitively normal participants. This pattern is consistent with the reduced biologic dynamic range expected in preclinical populations and parallels the more modest performance observed in A4.
Across all cohorts, non-linear ensemble methods consistently outperformed linear regression models, indicating that the relationship between plasma biomarkers and amyloid burden is at least partly non-linear.
Model structure and feature contributions
To further characterize model structure and biological coherence, we examined standardized logistic regression coefficients (Supplementary Figure S1), feature importance rankings (Supplementary Figure S2), and SHAP-based interpretability analyses (Supplementary Figure S3). Standardized logistic regression coefficients showed that p-tau217 made the largest contribution to amyloid classification in both cohorts, with APOE ε4 allele count and the Aβ42/40 ratio also demonstrating significant effects. Feature importance rankings across random forest, XGBoost, and LightGBM models consistently identified p-tau217 as the most influential predictor, followed by APOE ε4 and Aβ42/40.
SHAP analyses further showed that higher p-tau217 values increased the predicted probability of amyloid positivity, whereas higher Aβ42/40 values decreased risk. These effects were monotonic and directionally consistent across cohorts. Together, these analyses indicate that biological signal structure was stable across modeling approaches within each cohort and that predictive performance was driven primarily by the biomarker signal rather than model architecture.
Pairwise external validation of amyloid PET classification
Building on the strong within-cohort performance observed in Table 2 and Figure 2, we next evaluated model portability under pairwise external validation (Table 3). Table 3 highlights a dissociation between preserved discrimination and attenuation of clinically actionable metrics.
|
direction |
model |
n_test |
ppv |
npv |
accuracy |
AUC |
f1 |
is_best |
|
ADNI->A4 |
LogReg |
822 |
0.930851064 |
0.643497758 |
0.774939173 |
0.870823578 |
0.790960452 |
TRUE |
|
ADNI->A4 |
RF |
822 |
0.945558739 |
0.621564482 |
0.759124088 |
0.868162217 |
0.769230769 |
FALSE |
|
ADNI->A4 |
XGB |
822 |
0.91966759 |
0.616052061 |
0.749391727 |
0.842935782 |
0.763218391 |
FALSE |
|
ADNI->A4 |
LGBM |
822 |
0.912568306 |
0.61622807 |
0.748175182 |
0.845302133 |
0.763428571 |
FALSE |
|
ADNI->A4 |
SVM |
822 |
0.941520468 |
0.610416667 |
0.748175182 |
0.864258052 |
0.756756757 |
FALSE |
|
A4->ADNI |
LogReg |
885 |
0.736082474 |
0.865 |
0.794350282 |
0.894217048 |
0.796875 |
TRUE |
|
A4->ADNI |
RF |
885 |
0.736951983 |
0.857142857 |
0.792090395 |
0.886781751 |
0.793258427 |
FALSE |
|
A4->ADNI |
XGB |
885 |
0.718940937 |
0.852791878 |
0.778531073 |
0.881723079 |
0.7827051 |
FALSE |
|
A4->ADNI |
LGBM |
885 |
0.718940937 |
0.852791878 |
0.778531073 |
0.884048374 |
0.7827051 |
FALSE |
|
A4->ADNI |
SVM |
885 |
0.695049505 |
0.842105263 |
0.75819209 |
0.873356124 |
0.766375546 |
FALSE |
|
ADNI_CN->A4 |
LogReg |
822 |
0.959501558 |
0.598802395 |
0.739659367 |
0.852564384 |
0.742168675 |
FALSE |
|
ADNI_CN->A4 |
RF |
822 |
0.971698113 |
0.603174603 |
0.745742092 |
0.863859475 |
0.747279323 |
TRUE |
|
ADNI_CN->A4 |
XGB |
822 |
0.920110193 |
0.618736383 |
0.751824818 |
0.834280083 |
0.766055046 |
FALSE |
|
ADNI_CN->A4 |
LGBM |
822 |
0.927051672 |
0.586206897 |
0.722627737 |
0.826660055 |
0.727923628 |
FALSE |
|
ADNI_CN->A4 |
SVM |
822 |
0.970909091 |
0.557586837 |
0.695863747 |
0.840265006 |
0.681122449 |
FALSE |
When models trained in A4 were applied to ADNI, discrimination remained high, with ROC AUC values ranging from approximately 0.87 to 0.89 across models. The best performance in this direction was observed for logistic regression (AUC = 0.894; accuracy = 0.794). Corresponding NPV values remained relatively high (approximately 0.84–0.87), consistent with the clinical characteristics of ADNI.
In contrast, when models trained in ADNI were applied to A4, discrimination declined only modestly, with AUC values of approximately 0.83–0.87 across models, but clinically actionable performance was substantially attenuated. In this direction, NPV declined to approximately 0.60–0.66 across models despite relatively preserved discrimination. Accuracy and F1 score also decreased modestly, with accuracy ranging from approximately 0.74 to 0.77 and F1 score from approximately 0.75 to 0.79. This pattern demonstrates that models with similar discrimination can produce markedly different classification performance depending on the target deployment setting.
Relative to internal ADNI validation (AUC = 0.917–0.918), transfer to A4 produced an absolute AUC reduction of approximately 4–7%. Although modest in magnitude, this reduction was consistent across algorithms and biomarker configurations, indicating systematic attenuation under dataset shift [49]. Importantly, predictor rankings remained stable under transfer (Supplementary Figures S2 and S3), suggesting that the decline reflects distributional and calibration differences rather than loss of the underlying biological signal.
These findings highlight a gap between internal validation and real-world deployment conditions. In particular, the direction-dependent decline in NPV underscores the sensitivity of screening-relevant metrics to cohort differences and demonstrates that discrimination alone is insufficient to evaluate clinical utility [17,47].
Prediction of continuous amyloid burden under pairwise external validation
We next evaluated plasma biomarker–based prediction of continuous amyloid PET burden under pairwise external validation (Figure 3). Overall, centiloid prediction performance was substantially attenuated relative to within-cohort analyses. Across transfer directions, externally validated models achieved R² values ranging from 0.281 to 0.427, with RMSE values ranging from 31.0 to 36.6 centiloids depending on the transfer direction, model, and biomarker configuration.
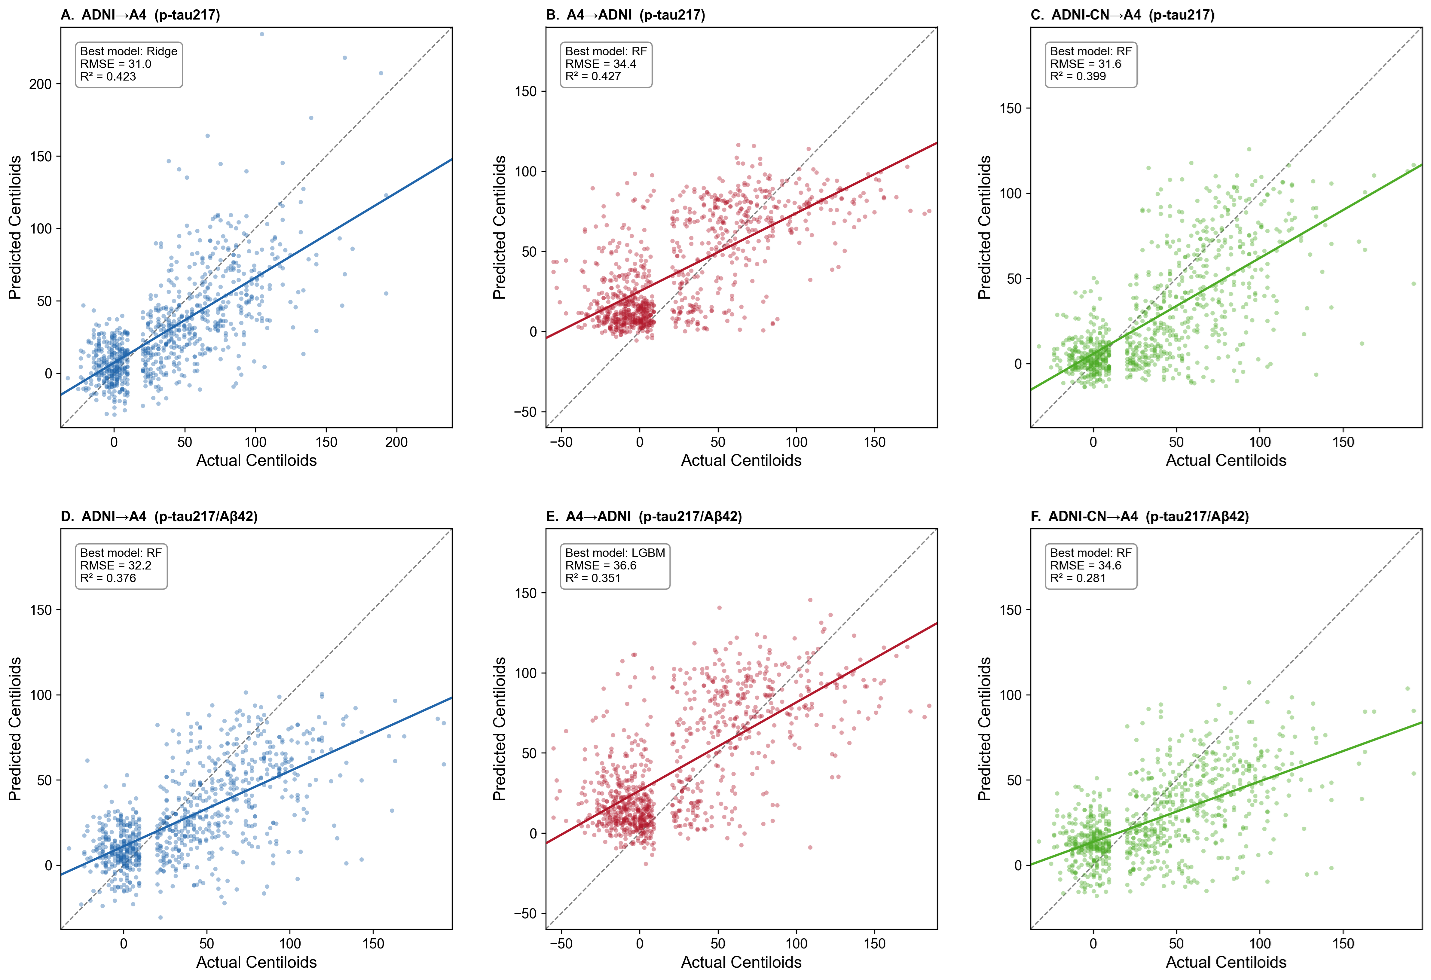
Figure 3. Prediction of continuous amyloid PET burden under pairwise external validation. Scatter plots showing predicted versus observed amyloid PET burden (centiloids) under pairwise external validation across transfer directions and biomarker configurations. Panels A–C show models trained using plasma p-tau217 alone, whereas Panels D–F show models trained using combined plasma p-tau217 and Aβ42 features. Panels A and D represent ADNI→A4 transfer, Panels B and E represent A4→ADNI transfer, and Panels C and F represent ADNI-CN→A4 transfer after restricting ADNI to cognitively normal participants only. Solid lines indicate fitted regression relationships, and dashed diagonal lines indicate the line of identity. Each panel reports the best-performing model, root mean squared error (RMSE), and coefficient of determination (R²). Across all transfer directions, prediction performance was attenuated relative to within-cohort analyses, with persistent compression of predicted values and reduced dynamic range at higher centiloid levels.
When models trained in ADNI were applied to A4 (Figure 3A and 3D), the best-performing models achieved R² = 0.423 and RMSE = 31.0 using p-tau217 alone with ridge regression, and R² = 0.376 with RMSE = 32.2 using combined p-tau217 and Aβ42 with random forest. Predicted values showed substantial dispersion around the identity line, particularly at higher centiloid values, and systematically underestimated higher levels of amyloid burden.
When models trained in A4 were applied to ADNI (Figure 3B and 3E), performance was similarly attenuated. The best results were achieved using random forest for p-tau217 alone (R² = 0.427, RMSE = 34.4) and LightGBM for combined p-tau217 and Aβ42 (R² = 0.351, RMSE = 36.6). Predictions exhibited greater variance across the full centiloid range, with both underestimation and overestimation observed at intermediate and higher amyloid levels.
To evaluate whether transfer-related attenuation was primarily driven by the broader clinical spectrum represented in ADNI, we repeated the analyses after restricting ADNI to cognitively normal participants only (ADNI-CN). Under this restriction (Figure 3C and 3F), prediction performance remained attenuated, with the best results achieved using random forest for p-tau217 alone (R² = 0.399, RMSE = 31.6) and ridge regression for combined p-tau217 and Aβ42 (R² = 0.281, RMSE = 34.6). Although performance changed modestly relative to the full ADNI-trained models, restricting ADNI to cognitively normal participants did not eliminate transfer-related attenuation.
Across all transfer directions, inclusion of additional biomarkers did not consistently improve prediction performance and in several settings resulted in lower R² values. These findings suggest that increasing model complexity does not fully mitigate transfer-related attenuation and may increase sensitivity to cohort-specific distributional differences.
Collectively, these results indicate that prediction of continuous amyloid burden is more sensitive to dataset shift than binary amyloid classification [49]. The persistence of attenuated performance following restriction to cognitively normal ADNI participants suggests that clinical heterogeneity contributes to, but does not fully explain, the observed differences across cohorts.
Clinical impact: negative predictive value under pairwise external validation and prevalence dependence
To evaluate the mechanisms underlying the NPV differences observed under pairwise external validation, we examined the prevalence-dependent behavior of negative predictive value across transfer directions (Figure 4). Simulated NPV curves were generated using sensitivity and specificity values estimated in the training cohort at Youden-optimal thresholds and evaluated across a range of hypothetical disease prevalence values.
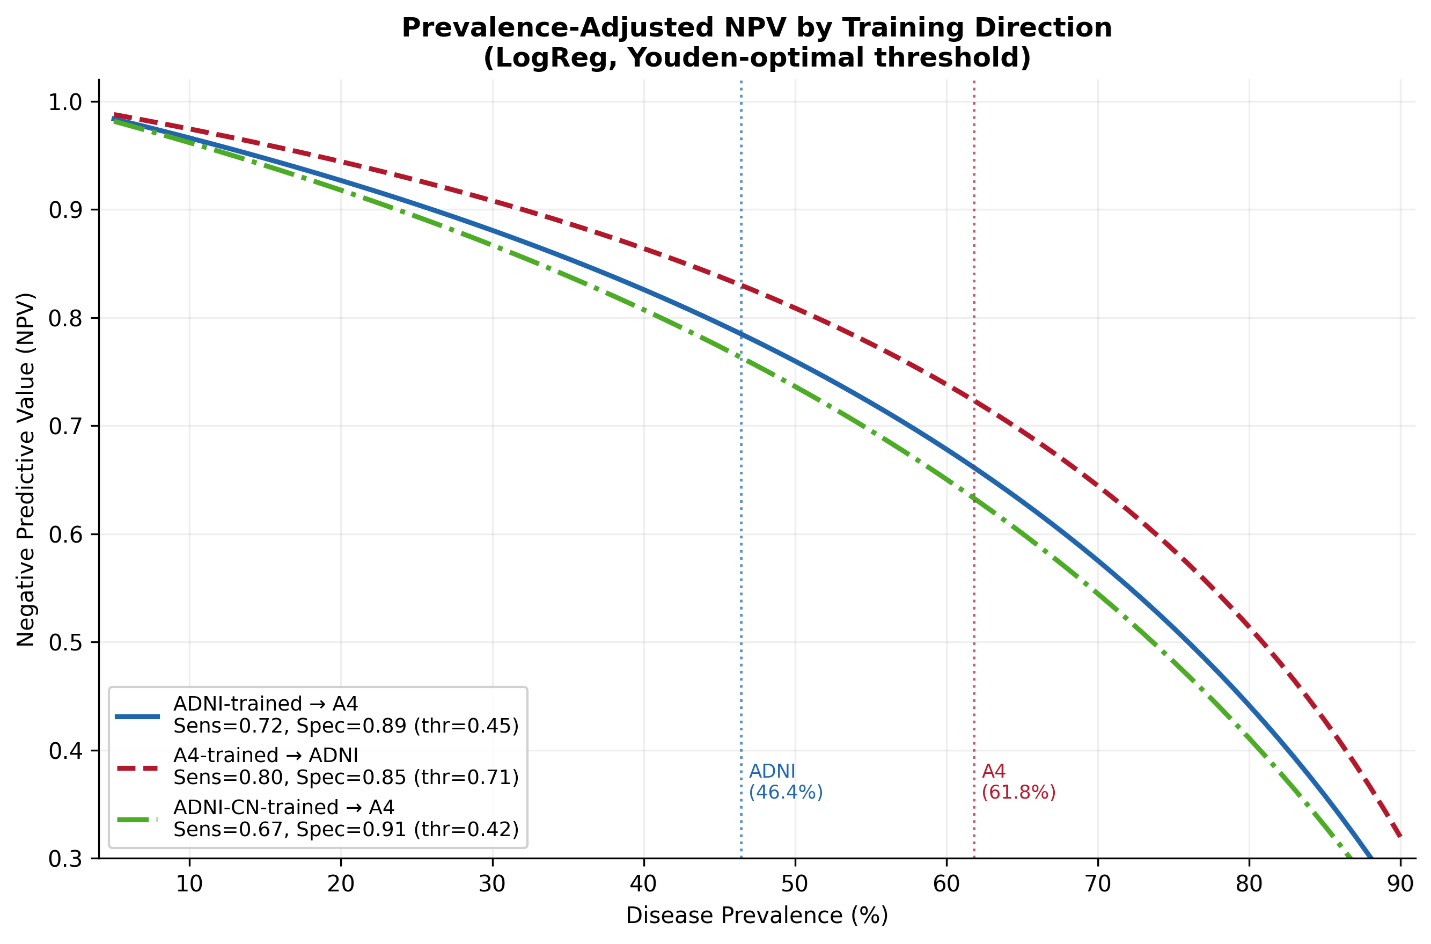
Figure 4. Prevalence-dependent behavior of negative predictive value under pairwise external validation. Simulated negative predictive value (NPV) as a function of disease prevalence for pairwise external validation settings using logistic regression models and Youden-optimal thresholds derived in the training cohort and applied unchanged to the target cohort. Curves are shown for models trained in ADNI and applied to A4 (blue), trained in A4 and applied to ADNI (red), and trained using cognitively normal ADNI participants only (ADNI-CN) and applied to A4 (green). Vertical dotted lines indicate the observed amyloid positivity prevalence in ADNI (46.4%) and A4 (61.8%). Sensitivity, specificity, and threshold values used for each transfer direction are shown in the legend. NPV declined nonlinearly with increasing prevalence across all transfer directions. Restricting ADNI to cognitively normal participants modestly altered the curves but did not eliminate attenuation under transfer, indicating that prevalence differences alone do not fully explain cross-cohort degradation in clinically actionable performance.
Across all transfer directions, NPV declined nonlinearly with increasing disease prevalence, demonstrating the strong prevalence dependence of rule-out performance. Models trained in A4 and applied to ADNI consistently produced the highest simulated NPV values across the prevalence range, whereas models trained in ADNI and applied to A4 produced lower NPV values despite relatively preserved discrimination [17,42,43,47,59].
At the observed prevalence levels for ADNI (46.4%) and A4 (61.8%), the simulated curves closely matched the empirically observed NPV values obtained from the pairwise external validation analyses (Figure 5). These findings indicate that a substantial component of the observed NPV attenuation under ADNI→A4 transfer is mathematically expected due to differences in prevalence and threshold selection rather than loss of discriminatory signal alone.
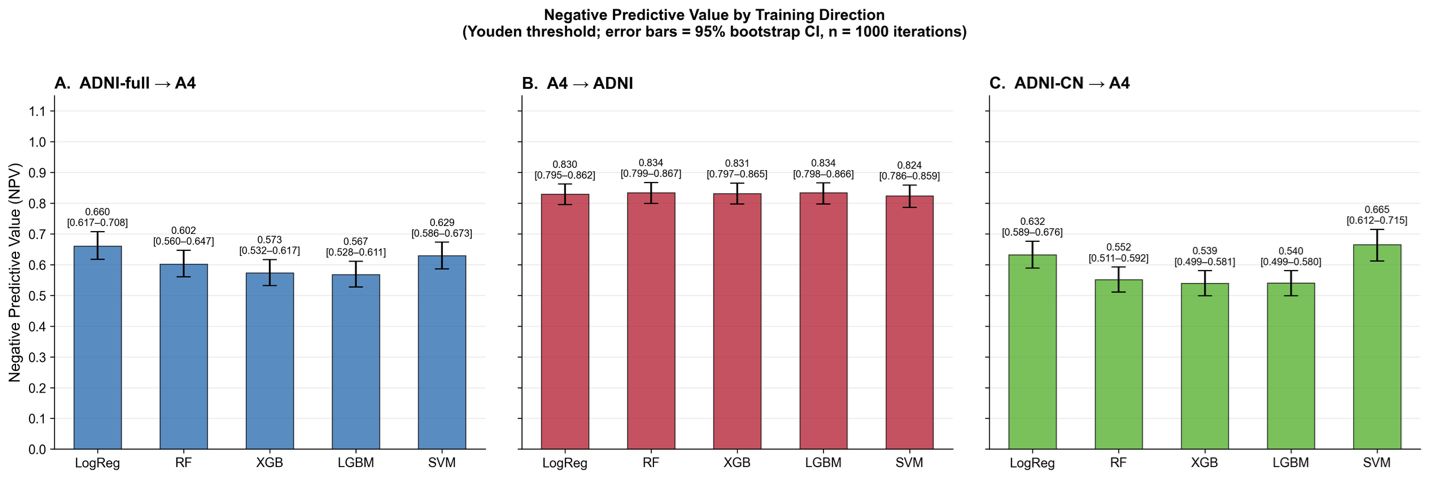
Figure 5. Negative predictive value under pairwise external validation across transfer directions. Negative predictive value (NPV) for amyloid PET classification across pairwise external validation settings using Youden-optimal thresholds derived in the training cohort and applied unchanged to the target cohort. Panel A shows models trained in the full ADNI cohort and tested in A4. Panel B shows models trained in A4 and tested in ADNI. Panel C shows models trained using cognitively normal ADNI participants only (ADNI-CN) and tested in A4. Error bars represent 95% bootstrap confidence intervals estimated from 1,000 bootstrap iterations. Models transferred from ADNI to A4 exhibited lower NPV than models transferred in the reverse direction. Restricting ADNI to cognitively normal participants modestly altered NPV but did not eliminate attenuation under transfer, indicating that clinical heterogeneity alone does not fully explain deployment-related degradation.
To evaluate whether this attenuation was primarily driven by the broader clinical spectrum represented in ADNI, we repeated the analysis after restricting ADNI to cognitively normal participants only (ADNI-CN). Under this restriction, the prevalence-adjusted NPV curve shifted only modestly relative to the full ADNI-trained model and remained substantially lower than the A4→ADNI transfer curve across clinically relevant prevalence values. Thus, although clinical heterogeneity contributes to transfer-related attenuation, it does not fully explain the attenuation in clinically actionable performance.
Supplementary Figure S4 further demonstrates the threshold dependence of classification performance under pairwise external validation. Under Youden-optimal thresholding, models generally maintained balanced sensitivity and specificity across transfer directions, although clinically actionable metrics such as NPV varied substantially. In contrast, under fixed 90% sensitivity thresholding, specificity frequently collapsed toward zero across several transfer directions and models, resulting in unstable predictive values despite relatively preserved discrimination. Similar patterns were observed for both p-tau217-only and combined p-tau217/Aβ42 biomarker configurations. These findings indicate that threshold selection strongly influences clinically actionable performance under deployment conditions and further support the conclusion that discrimination metrics alone are insufficient to characterize deployment readiness.
Supplementary Figure S5 directly compares classification performance between ADNI-full and ADNI-CN-trained models evaluated in A4. Restricting ADNI to cognitively normal participants resulted in only modest reductions in ROC AUC (ΔAUC approximately 0.004–0.024 across models) and similarly modest shifts in NPV (ΔNPV approximately −0.035 to +0.050). These findings indicate that clinical heterogeneity contributes to transfer-related attenuation but does not fully explain the observed reduction in clinically actionable performance.
Supplementary Figure S6 further demonstrates substantial variability in probability thresholds across transfer directions, machine learning models, and thresholding strategies. Under Youden-optimal thresholding, threshold values differed systematically between transfer directions, particularly for gradient boosting and support vector machine models. Under fixed 90% sensitivity thresholding, threshold values frequently collapsed toward zero across several transfer directions and models, reflecting substantial reduction in specificity under high-sensitivity operating conditions. Restricting ADNI to cognitively normal participants modestly altered threshold values but did not eliminate threshold instability under transfer. Similar patterns were observed for both p-tau217-only and combined p-tau217/Aβ42 biomarker configurations, indicating that threshold instability is a general property of pairwise external validation rather than a feature of a specific biomarker representation. These threshold instabilities likely contribute to the calibration shifts observed under pairwise external validation (Figure 6).
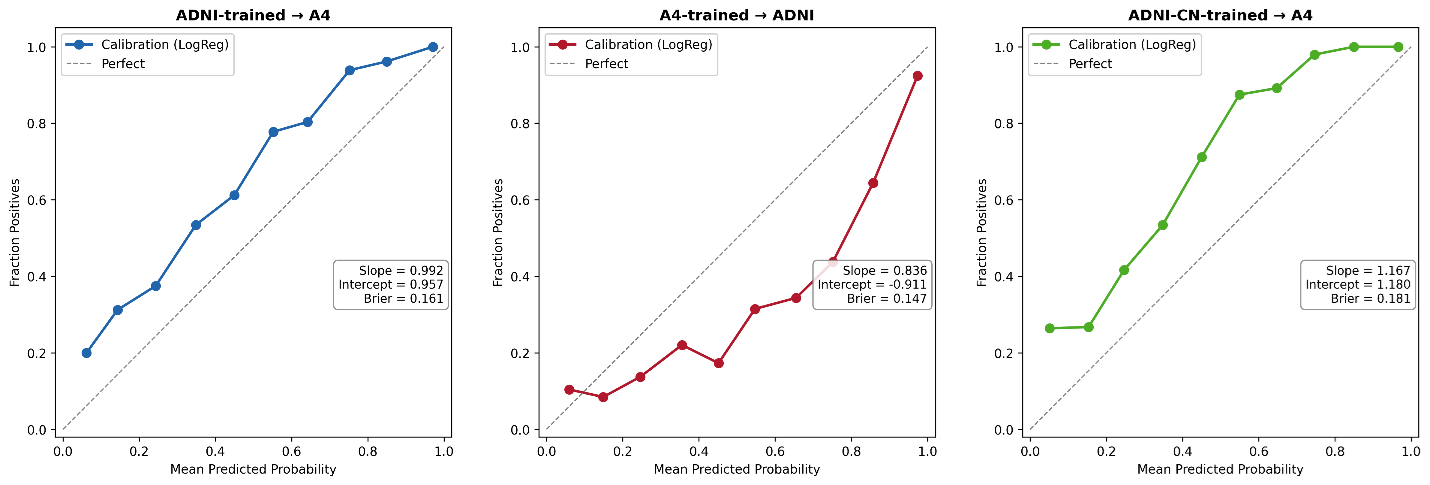
Figure 6. Calibration under pairwise external validation. Calibration curves for logistic regression models under pairwise external validation settings. Panel A shows models trained in ADNI and applied to A4. Panel B shows models trained in A4 and applied to ADNI. Panel C shows models trained using cognitively normal ADNI participants only (ADNI-CN) and applied to A4. The dashed diagonal line indicates perfect calibration. Calibration slope, calibration intercept, and Brier score are shown for each transfer direction. Cross-cohort transfer generally preserved ranking performance (slope near 1.0) but introduced systematic probability shifts reflected by calibration intercept deviations. Restricting ADNI to cognitively normal participants did not eliminate calibration instability, indicating that clinical heterogeneity alone does not fully explain cross-cohort degradation.
Together, these findings demonstrate that NPV is highly sensitive to the target deployment setting and depends jointly on prevalence, threshold selection, and calibration stability. Although discrimination remained relatively preserved across cohorts, clinically relevant rule-out performance varied substantially under pairwise external validation, indicating that discrimination metrics alone are insufficient to assess deployment readiness.
Calibration under pairwise external validation
Calibration analyses demonstrated that pairwise external validation primarily affected probability calibration rather than ranking performance (Figure 6). When ADNI-trained models were applied to A4, calibration slope remained close to the ideal value of 1.0 (slope = 0.992), indicating preservation of ranking performance. However, the calibration intercept showed a substantial positive shift (intercept = 0.957), consistent with systematic upward shift in predicted amyloid positivity probabilities. The corresponding Brier score was modestly elevated (0.161).
In contrast, models trained in A4 and applied to ADNI demonstrated lower calibration slope (0.836) and a negative calibration intercept (−0.911), indicating systematic underestimation of probabilities in the reverse transfer direction.
To evaluate whether calibration instability was primarily driven by the broader clinical spectrum represented in ADNI, additional analyses were performed after restricting ADNI to cognitively normal participants only (ADNI-CN). Although this restriction altered calibration characteristics modestly, systematic calibration deviations persisted (slope = 1.167; intercept = 1.180; Brier score = 0.181), indicating that clinical heterogeneity alone does not fully explain transfer-related calibration instability.
Together, these findings demonstrate that pairwise external validation preserves substantial discriminatory signal while introducing systematic shifts in predicted probabilities, particularly at clinically relevant operating ranges [43,45,49].
Biomarker distribution shift as a mechanistic contributor
To investigate the origin of transfer-related attenuation, we examined raw and standardized biomarker distributions across ADNI and A4 (Figure 7). For p-tau217, ADNI showed a substantially higher mean than A4 (0.363 vs 0.173; Δ = 0.189), along with a broader right-skewed tail, indicating greater variance and dynamic range. For the Aβ42/40 ratio, the difference was smaller but still consistent (0.0576 in ADNI vs 0.0929 in A4; Δ = −0.0353), and the two cohort distributions remained clearly separated.
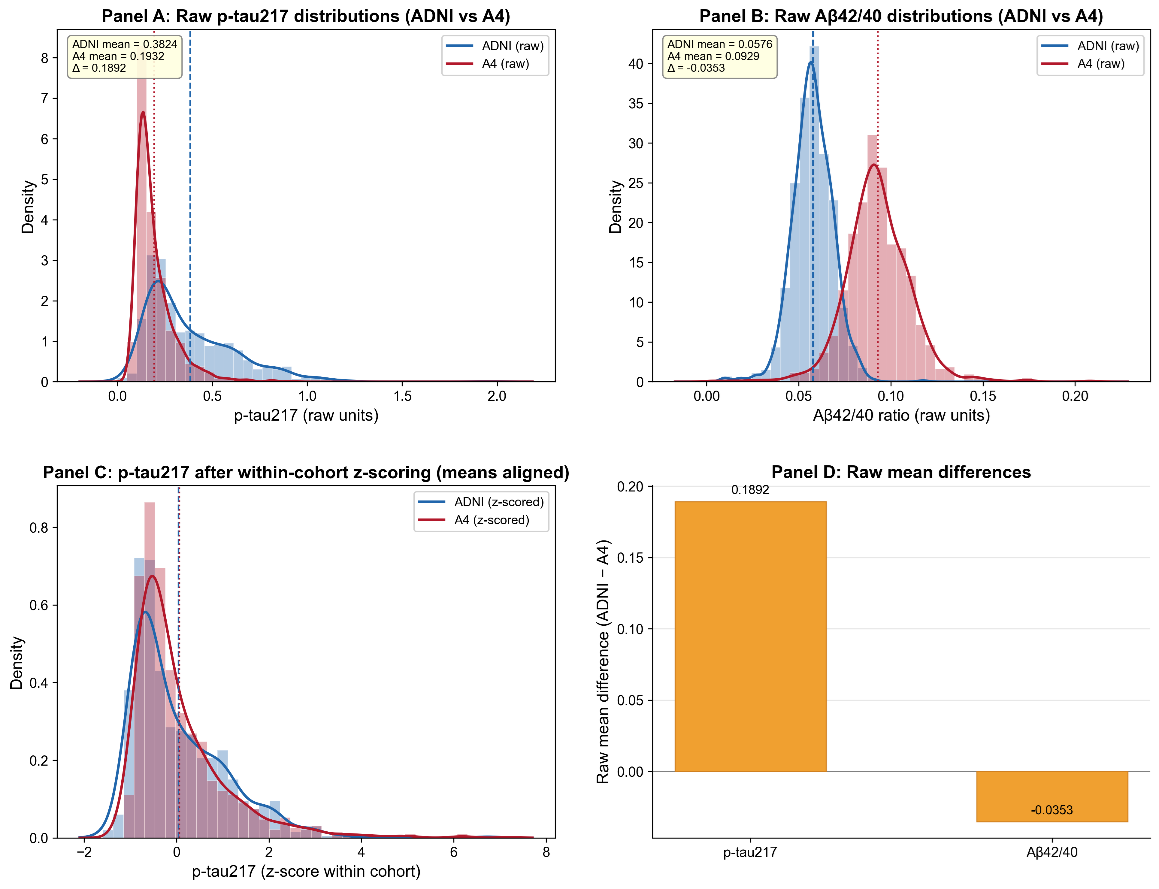
Figure 7. Biomarker distribution shift between ADNI and A4 cohorts. (A) Raw p-tau217 distributions (histogram + kernel density estimate) in ADNI (blue) and A4 (green). Vertical lines indicate cohort means; inset reports means and their difference (Δ). (B) Raw Aβ42/40 distributions (histogram + KDE) with cohort means and Δ annotated. (C) p-tau217 distributions after within-cohort z-scoring (means aligned to zero), illustrating that standardization masks cohort mean shifts while leaving distributional shape and variance differences intact. (D) Bar plot quantifying the raw mean differences (ADNI mean − A4 mean) for both biomarkers. These panels together illustrate how cohort-specific biomarker distributions can induce dataset shift that is not fully addressed by simple within-cohort standardization.
Within-cohort z-scoring aligned cohort means to zero, but differences in distribution shape, variance, and skewness persisted. In particular, the ADNI p-tau217 distribution retained a heavier right tail than A4, indicating that standardization does not fully harmonize higher-order distributional properties. Figure 7D summarizes these raw differences, highlighting a large shift for p-tau217 and a smaller but consistent shift for Aβ42/40.
These findings demonstrate that plasma biomarker distributions differ systematically across cohorts in ways that are not fully corrected by standard preprocessing. Such distributional mismatches are consistent with dataset shift and provide a mechanistic explanation for the calibration shifts observed in Figure 6. Because machine learning models learn decision boundaries based on cohort-specific feature distributions, shifts in mean, variance, and shape can distort how those boundaries apply to new data. This effect is particularly relevant for p-tau217, which was the dominant predictive feature across models. Together, these results indicate that assay-related and cohort-specific biomarker differences are an important contributor to calibration instability and of reduced NPV under pairwise external validation [17,31,45,47,49,60].
Decision curve analysis: net clinical benefit under pairwise external validation
Clinical utility was further evaluated using decision curve analysis under pairwise external validation settings (Figure 8) [17,42,47]. Across clinically relevant threshold probabilities, externally validated models generally maintained positive net benefit relative to the “treat none” strategy, although the magnitude of benefit varied across transfer directions.
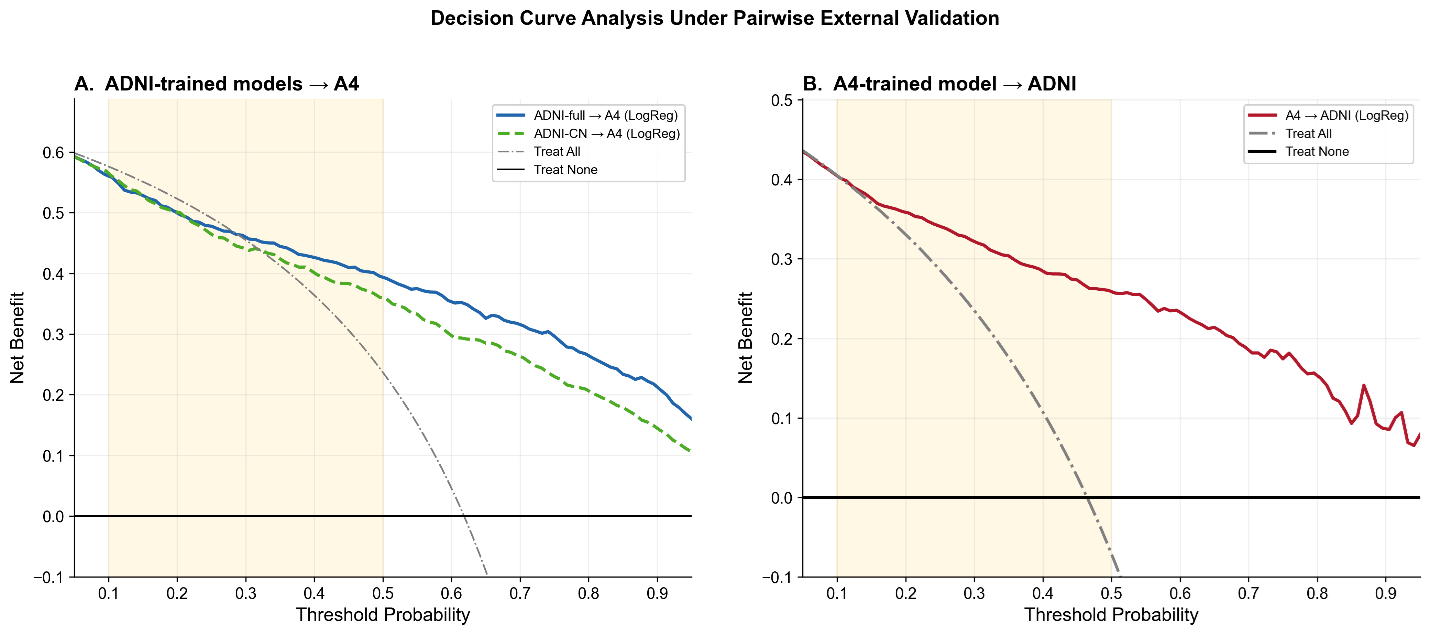
Figure 8. Decision curve analysis under pairwise external validation. Decision curve analysis comparing net clinical benefit across probability thresholds for pairwise external validation settings. Panel A shows logistic regression models trained in the full ADNI cohort and applied to A4 (blue), together with models trained using cognitively normal ADNI participants only (ADNI-CN) and applied to A4 (green dashed line). Panel B shows logistic regression models trained in A4 and applied to ADNI (red). Gray dash-dotted lines represent the “treat all” strategy, and black horizontal lines represent the “treat none” strategy. Shaded regions indicate clinically relevant threshold ranges. Cross-cohort transfer preserved positive net benefit across broad threshold ranges; however, net benefit was attenuated relative to internally validated performance. Restricting ADNI to cognitively normal participants did not eliminate the reduction in net clinical benefit under transfer, indicating that clinical heterogeneity alone does not fully explain deployment-related degradation.
When models trained in ADNI were applied to A4 (Figure 8A), net benefit remained positive across a broad threshold range and exceeded the “treat all” strategy throughout most clinically relevant decision thresholds. However, net benefit progressively declined at higher threshold probabilities. Restricting ADNI to cognitively normal participants only (ADNI-CN) produced a qualitatively similar decision curve, although net benefit was modestly lower across much of the threshold range. These findings indicate that clinical heterogeneity contributes to, but does not fully explain, transfer-related attenuation in clinical utility.
Models trained in A4 and applied to ADNI (Figure 8B) demonstrated relatively preserved net benefit across clinically relevant threshold ranges, remaining consistently above the “treat none” strategy and outperforming the “treat all” strategy across much of the highlighted decision interval. Although net benefit declined gradually at higher threshold probabilities, clinically meaningful utility was retained throughout most of the evaluated range.
Together, these findings demonstrate that clinically actionable utility is sensitive to the target deployment setting even when discrimination remains relatively preserved. The reduced net benefit observed under ADNI→A4 transfer was consistent with the prevalence-dependent NPV attenuation and calibration shifts demonstrated in Figures 4 and 6. In contrast, the comparatively preserved utility of A4→ADNI transfer suggests that prevalence, threshold selection, and calibration collectively influence downstream clinical decision performance. These results further support the conclusion that decision-analytic measures of clinical utility are more sensitive to deployment-related dataset shift than discrimination metrics alone.
Summary of key findings
Collectively, these results demonstrate that plasma biomarker–based models achieve strong within-cohort discrimination and robust centiloid prediction. Pairwise external validation produced only modest AUC attenuation but greater attenuation in regression performance. Clinically actionable metrics, particularly NPV, were substantially more sensitive to dataset transfer than discrimination. Calibration shifts and biomarker distributional differences provided mechanistic explanations for attenuation, and prevalence amplified modest sensitivity changes into clinically meaningful reductions in rule-out performance. These findings underscore the importance of pairwise external validation, explicit calibration assessment, and assay-consistent biomarker generation before real-world deployment of blood-based screening tools.
Discussion
In this study, we evaluated the performance and portability of plasma biomarker-based machine learning (ML) models for amyloid PET prediction within and across two complementary cohorts, ADNI and A4. The results support five interrelated observations regarding model performance and portability under pairwise external validation. First, plasma biomarker-based ML models demonstrate strong within-cohort performance for both binary amyloid classification and continuous centiloid prediction. Discrimination approached or exceeded AUC values of 0.90 in ADNI and 0.87 in A4, consistent with prior reports of plasma p-tau217-based prediction [20,21,26,52]. Model structure analyses further demonstrated that biological signal hierarchy is stable across cohorts and algorithms, with p-tau217 consistently emerging as the dominant predictor, followed by Aβ42/40 and APOE ε4 count. These findings reinforce the robustness of core amyloid-related plasma biomarkers and support their biological validity.
Second, pairwise external validation resulted in reproducible but modest attenuation in discrimination (absolute AUC reduction of ~4-7%) and greater attenuation in continuous centiloid prediction. Importantly, feature ranking and directionality remain stable under transfer, indicating that cross-cohort degradation is not driven by reversal of biological associations. These findings are consistent with broader observations that predictive performance can degrade under dataset shift even when underlying signal remains valid [45,49,61].
Third, and most clinically consequential, pairwise external validation attenuated clinically actionable metrics. Negative predictive value (NPV) declined by approximately 20 percentage points when ADNI-trained models were applied to the preclinical A4 population. This reduction is substantially larger than the observed AUC decline and underscores that discrimination alone does not capture deployment risk. Given current appropriate-use recommendations emphasizing high NPV for screening applications [17,47], this degradation has direct implications for clinical implementation. Additional analyses restricted to cognitively normal ADNI participants (ADNI-CN) demonstrated that transfer-related attenuation persisted even after removing individuals with mild cognitive impairment and dementia. Although modest changes in discrimination, NPV, calibration, and decision-curve performance were observed, the overall pattern remained largely unchanged. These findings suggest that clinical heterogeneity contributes to transfer-related attenuation but does not fully explain the observed differences between cohorts. Instead, multiple factors, including prevalence variation, calibration shifts, and biomarker distributional differences, appear to contribute jointly to deployment-sensitive performance.
Fourth, calibration analyses reveal systematic probability misestimation under cross-cohort transfer. Even when AUC remains acceptable, predicted probabilities deviate from observed event rates, directly affecting NPV. Threshold-dependent analyses demonstrate that this instability affects the entire operating characteristic surface rather than a single decision point, and decision curve analysis confirms reduced net clinical benefit under deployment. These findings are consistent with established literature demonstrating that models optimized for discrimination may exhibit unstable probability estimates under distributional shift [45,49].
Fifth, biomarker distributional differences and disease prevalence provide mechanistic explanations for these observations. Plasma p-tau217 and Aβ42/40 distributions differ between ADNI and A4 despite within-cohort standardization. Empirical head-to-head comparisons of plasma p-tau217 assays demonstrate that platform and calibration differences can produce measurable shifts in biomarker distributions [31,47], consistent with earlier evidence of assay variability in Alzheimer’s disease biomarker research [32]. Such distributional mismatches likely drive calibration shifts under cross-cohort transfer. In addition, prevalence-adjusted analyses demonstrate mathematically that even modest sensitivity differences, when combined with prevalence variation, can produce large NPV changes. Thus, NPV degradation under deployment is both structurally predictable and empirically observed.
Threshold-dependent analyses further demonstrated that clinically actionable performance is sensitive to operating-point selection. Under fixed high-sensitivity thresholds, specificity frequently collapsed toward zero across transfer directions, whereas Youden-optimal thresholds produced more balanced operating characteristics. Threshold probability values also varied substantially across transfer directions and biomarker configurations. Together, these findings indicate that threshold instability is an additional mechanism through which deployment-related attenuation can emerge, even when discrimination remains relatively preserved.
The stability of feature contributions across these cohorts suggests that the underlying biological signal is largely preserved under pairwise external validation. SHAP analyses (Supplementary figure 3) demonstrate monotonic and coherent predictor effects, and feature importance rankings confirm consistent predictor hierarchy across algorithms. These findings suggest that the models capture genuine pathophysiological relationships rather than cohort-specific artifacts.
However, biological robustness does not guarantee deployment robustness. Cross-cohort attenuation in AUC, although modest, becomes clinically amplified when translated into predictive values. This divergence between discrimination and predictive value highlights a key translational insight: models may maintain ranking performance while losing decision reliability. This phenomenon is well described in the broader ML literature, where dataset shift can degrade probability calibration even when discrimination remains stable [49].
Our findings suggest that calibration may represent a major source of translational fragility, even when discrimination remains relatively preserved. Models exhibited systematic probability shift / calibration shift, shifting predicted probabilities relative to observed risk. Because NPV depends directly on predicted probabilities and prevalence, even small calibration deviations propagate into substantial changes in rule-out performance.
This finding aligns with prior evidence that modern ML models frequently exhibit miscalibration under domain shift [45], and that standard recalibration approaches such as Platt scaling or isotonic regression may only partially mitigate these effects [49]. In our analyses, simple intercept recalibration improved performance modestly but did not eliminate direction-dependent degradation, suggesting that deeper distributional differences contribute to instability.
Distributional analyses reveal that plasma biomarkers, particularly p-tau217, exhibit cohort-level differences in mean, variance, and distributional shape. Although z-scoring aligns cohort means, higher-order differences persist, altering the effective operating region of learned decision boundaries.
These findings support the hypothesis that assay heterogeneity, including platform differences and calibration strategies, is a primary contributor to cross-cohort instability. Prior studies have documented inter-platform variability in AD biomarker measurement [32,34,62,63], and dataset shift theory predicts that such differences can degrade predictive performance under transfer [49]. The preservation of predictor directionality across cohorts suggests that biological relationships remain intact, whereas instability arises from measurement context rather than biological reversal.
The prevalence-adjusted analyses provide a formal explanation for observed degradation. Because NPV is inversely related to disease prevalence and directly related to sensitivity, modest reductions in sensitivity under cross-cohort transfer are amplified in moderate-to-high prevalence populations. The close agreement between simulated and empirical NPV values supports this interpretation.
These findings emphasize a key translational principle: predictive value is not an intrinsic property of a model but a function of sensitivity, specificity, and population prevalence. Consequently, deployment into populations with different base rates can materially alter rule-out performance even when discrimination remains similar.
Recent plasma p-tau217 “clock” models have demonstrated promise for staging disease progression within harmonized cohorts [28]. Our findings suggest that longitudinal models may face similar portability challenges if assay consistency and calibration stability are not maintained across target deployment settings. Thus, cross-cohort validation and harmonized measurement frameworks are likely prerequisites not only for screening classifiers but also for reliable implementation of longitudinal staging models.
Taken together, our results demonstrate that plasma biomarker-based ML models are biologically robust yet deployment-sensitive. Clinically actionable metrics such as NPV are substantially more vulnerable to dataset shift than AUC. For screening applications in asymptomatic populations, high NPV and stable calibration are essential. Accordingly, cross-cohort validation should be considered a prerequisite for deployment, as external validation is a critical but often underperformed step in clinical prediction modeling [64,65]. In addition, calibration assessment must accompany discrimination reporting, as both are required to evaluate clinical usefulness of prediction models [43,66]. Finally, assay-consistent biomarker generation may represent the most effective translational lever, as variability in data generation and model validation remains a key barrier to safe clinical implementation of AI-based prediction tools [67].
Limitations
Several limitations should be considered when interpreting these findings. First, although we evaluated pairwise external validation using two large and well-characterized datasets, both cohorts are research-based populations with specific inclusion criteria. ADNI includes participants across the clinical spectrum, whereas A4 focuses on cognitively normal individuals enriched for amyloid status. As a result, the study populations may not fully represent real-world clinical settings, and the observed performance may differ in more heterogeneous healthcare populations.
Second, differences in biomarker assay platforms and pre-analytical procedures between cohorts likely contributed to the observed distributional shifts. While these differences are central to the study’s objective, they also limit the ability to disentangle biological variability from technical variability. Although within-cohort standardization was applied, this approach does not fully harmonize higher-order distributional differences, and alternative harmonization strategies were not explored.
Third, the analysis was restricted to baseline measurements to reflect realistic screening conditions. While this design enhances clinical relevance, it does not capture longitudinal changes in biomarker trajectories or disease progression. As a result, the findings should be interpreted as reflecting cross-sectional prediction performance rather than longitudinal risk modeling.
Fourth, although the sample sizes were substantial (n = 885 and n = 822), the effective sample size for certain subgroup and cross-cohort analyses is smaller, which may affect the precision of performance estimates. Confidence intervals were provided for key metrics such as negative predictive value; however, uncertainty in these estimates should be considered, particularly when interpreting differences across cohorts.
Fifth, we focused on a predefined set of machine learning models without extensive hyperparameter optimization or model recalibration. This choice was intentional to simulate real-world deployment conditions, but it may underestimate the maximum achievable performance within each cohort. Conversely, the observed degradation under cross-cohort transfer may differ with alternative modeling or recalibration strategies.
Although the ADNI-CN analyses help isolate one source of cohort heterogeneity, the study remains limited to a single pair of research cohorts with specific inclusion criteria and biomarker measurement workflows. Accordingly, the extent to which these findings extend beyond the ADNI–A4 comparison cannot be determined from the present data alone. Additional validation in independent cohorts with harmonized biomarker measurements will be needed to determine the robustness and portability of these results. Taken together, these limitations indicate that plasma biomarker-based models show strong within-cohort performance, but their deployment should be accompanied by explicit external validation, calibration assessment, and assay harmonization.
Conclusions
Plasma biomarker-based ML models demonstrate strong within-cohort performance but exhibit reproducible, direction-dependent attenuation under pairwise external validation. While discrimination declines modestly, clinically actionable rule-out performance can decline substantially due to calibration shifts, distributional mismatch, and prevalence sensitivity. These findings underscore the importance of deployment-aware validation, calibration monitoring, and assay harmonization in translating plasma biomarkers into scalable clinical screening tools.
Conflicts of Interest
The authors declare that they have no competing interests.
Acknowledgments
Data used in the preparation of this article were obtained from the Alzheimer’s Disease Neuroimaging Initiative (ADNI) database (adni.loni.usc.edu). ADNI was launched in 2003 as a public-private partnership led by Principal Investigator Michael W. Weiner, MD. ADNI is funded by the National Institute on Aging, the National Institute of Biomedical Imaging and Bioengineering, and through contributions from industry partners. The grantee organization is the Northern California Institute for Research and Education, and the study is coordinated by the Alzheimer’s Therapeutic Research Institute at the University of Southern California. ADNI data are disseminated by the Laboratory for Neuro Imaging at the University of Southern California.
Data were also obtained from the Anti-Amyloid Treatment in Asymptomatic Alzheimer’s Disease (A4) Study. The A4 Study is funded by the National Institute on Aging, Eli Lilly and Company, the Alzheimer’s Association, and additional philanthropic contributors, and is led by investigators at Brigham and Women’s Hospital, Harvard Medical School, and the Alzheimer’s Therapeutic Research Institute at the University of Southern California.
Author’s Contributions
AK performed data processing, machine learning analyses, and figure generation, and contributed to manuscript review and editing. EZ conceived and designed the study, conducted the investigation and formal analyses, developed the machine learning models, supervised the project, and drafted the original manuscript. EZ also contributed to data interpretation, visualization, and manuscript revision. Both authors read and approved the final manuscript.
References
2. Bateman RJ, Xiong C, Benzinger TL, Fagan AM, Goate A, Fox NC, et al. Clinical and biomarker changes in dominantly inherited Alzheimer's disease. N Engl J Med. 2012;367(9):795–804.
3. Villemagne VL, Burnham S, Bourgeat P, Brown B, Ellis KA, Salvado O, et al. Amyloid beta deposition, neurodegeneration, and cognitive decline in sporadic Alzheimer's disease: a prospective cohort study. Lancet Neurol. 2013;12(4):357–67.
4. van Dyck CH, Sabbagh M, Cohen S. Lecanemab in Early Alzheimer's Disease. Reply. N Engl J Med. 2023;388(17):1631–2.
5. Sims JR, Zimmer JA, Evans CD, Lu M, Ardayfio P, Sparks J, et al. Donanemab in Early Symptomatic Alzheimer Disease: The TRAILBLAZER-ALZ 2 Randomized Clinical Trial. JAMA. 2023;330(6):512–27.
6. Livingston G, Huntley J, Liu KY, Costafreda SG, Selbaek G, Alladi S, et al. Dementia prevention, intervention, and care: 2024 report of the Lancet standing Commission. Lancet. 2024;404(10452):572–628.
7. Cummings J, Osse AML, Cammann D, Powell J, Chen J. Anti-Amyloid Monoclonal Antibodies for the Treatment of Alzheimer's Disease. BioDrugs. 2024;38(1):5–22.
8. Knopman DS, Jones DT, Greicius MD. Failure to demonstrate efficacy of aducanumab: An analysis of the EMERGE and ENGAGE trials as reported by Biogen, December 2019. Alzheimers Dement. 2021;17(4):696–701.
9. McDade E, Cummings JL, Dhadda S, Swanson CJ, Reyderman L, Kanekiyo M, et al. Lecanemab in patients with early Alzheimer's disease: detailed results on biomarker, cognitive, and clinical effects from the randomized and open-label extension of the phase 2 proof-of-concept study. Alzheimers Res Ther. 2022;14(1):191.
10. Zimmer JA, Sims JR, Evans CD, Nery ESM, Wang H, Wessels AM, et al. Donanemab in early symptomatic Alzheimer's disease: results from the TRAILBLAZER-ALZ 2 long-term extension. J Prev Alzheimers Dis. 2026;13(2):100446.
11. ClinicalTrials.gov. AHEAD 3–45 Study: Lecanemab in Preclinical Alzheimer’s Disease (NCT04468659): U.S. National Library of Medicine; 2024. Available from: https://clinicaltrials.gov/study/NCT04468659
12. Ornish D, Madison C, Kivipelto M, Kemp C, McCulloch CE, Galasko D, et al. Effects of intensive lifestyle changes on the progression of mild cognitive impairment or early dementia due to Alzheimer's disease: a randomized, controlled clinical trial. Alzheimers Res Ther. 2024;16(1):122.
13. Baker LD, Espeland MA, Whitmer RA, Snyder HM, Leng X, Lovato L, et al. Structured vs Self-Guided Multidomain Lifestyle Interventions for Global Cognitive Function: The US POINTER Randomized Clinical Trial. JAMA. 2025;334(8):681–91.
14. Klunk WE, Koeppe RA, Price JC, Benzinger TL, Devous MD, Sr., Jagust WJ, et al. The Centiloid Project: standardizing quantitative amyloid plaque estimation by PET. Alzheimers Dement. 2015;11(1):1–15 e1–4.
15. Jack CR, Jr., Bennett DA, Blennow K, Carrillo MC, Dunn B, Haeberlein SB, et al. NIA-AA Research Framework: Toward a biological definition of Alzheimer's disease. Alzheimers Dement. 2018;14(4):535–62.
16. Hansson O, Edelmayer RM, Boxer AL, Carrillo MC, Mielke MM, Rabinovici GD, et al. The Alzheimer's Association appropriate use recommendations for blood biomarkers in Alzheimer's disease. Alzheimers Dement. 2022;18(12):2669–86.
17. Teunissen CE, Verberk IMW, Thijssen EH, Vermunt L, Hansson O, Zetterberg H, et al. Blood-based biomarkers for Alzheimer's disease: towards clinical implementation. Lancet Neurol. 2022;21(1):66–77.
18. Contador J, Vargas-Martinez AM, Sanchez-Valle R, Trapero-Bertran M, Llado A. Cost-effectiveness of Alzheimer's disease CSF biomarkers and amyloid-PET in early-onset cognitive impairment diagnosis. Eur Arch Psychiatry Clin Neurosci. 2023;273(1):243–52.
19. Karikari TK, Pascoal TA, Ashton NJ, Janelidze S, Benedet AL, Rodriguez JL, et al. Blood phosphorylated tau 181 as a biomarker for Alzheimer's disease: a diagnostic performance and prediction modelling data from four cohorts. Lancet Neurol. 2020;19(5):422–33.
20. Nakamura A, Kaneko N, Villemagne VL, Kato T, Doecke J, Doré V, et al. High performance plasma amyloid-β biomarkers for Alzheimer's disease. Nature. 2018;554(7691):249–54.
21. Schindler SE, Bollinger JG, Ovod V, Mawuenyega KG, Li Y, Gordon BA, et al. High-precision plasma β-amyloid 42/40 predicts current and future brain amyloidosis. Neurology. 2019;93(17):e1647–e59.
22. Palmqvist S, Janelidze S, Stomrud E, Zetterberg H, Karl J, Zink K, et al. Performance of Fully Automated Plasma Assays as Screening Tests for Alzheimer Disease-Related beta-Amyloid Status. JAMA NEUROLOGY. 2019;76(9):1060–9.
23. Alishahi F, Beam CR, Gatz M, Schneider LS, Nation DA, Yassine HN, et al. High precision and cost-effective multiplex quantification of amyloid-beta40, amyloid-beta42, p181Tau, p217Tau, neurofilament light chain, and glial fibrillary acidic protein from plasma and serum. J Alzheimers Dis. 2025;106(2):739–55.
24. Therriault J, Janelidze S, Benedet AL, Ashton NJ, Arranz Martinez J, Gonzalez-Escalante A, et al. Diagnosis of Alzheimer's disease using plasma biomarkers adjusted to clinical probability. Nat Aging. 2024;4(11):1529–37.
25. Angioni D, Delrieu J, Hansson O, Fillit H, Aisen P, Cummings J, et al. Blood Biomarkers from Research Use to Clinical Practice: What Must Be Done? A Report from the EU/US CTAD Task Force. J Prev Alzheimers Dis. 2022;9(4):569–79.
26. Palmqvist S, Warmenhoven N, Anastasi F, Pilotto A, Janelidze S, Tideman P, et al. Plasma phospho-tau217 for Alzheimer's disease diagnosis in primary and secondary care using a fully automated platform. Nat Med. 2025;31(6):2036–43.
27. Pichet Binette A, Smith R, Salvado G, Tideman P, Glans I, van Westen D, et al. Evaluation of the Revised Criteria for Biological and Clinical Staging of Alzheimer Disease. JAMA Neurol. 2025;82(7):666–75.
28. Petersen KK, Mila-Aloma M, Li Y, Du L, Xiong C, Tosun D, et al. Predicting onset of symptomatic Alzheimer's disease with plasma p-tau217 clocks. Nat Med. 2026;32(3):1085–94.
29. Tijms BM, Gobom J, Teunissen C, Dobricic V, Tsolaki M, Verhey F, et al. CSF Proteomic Alzheimer's Disease-Predictive Subtypes in Cognitively Intact Amyloid Negative Individuals. Proteomes. 2021;9(3):36.
30. Hansson O. Biomarkers for neurodegenerative diseases. Nat Med. 2021;27(6):954–63.
31. Janelidze S, Bali D, Ashton NJ, Barthélemy NR, Vanbrabant J, Stoops E, et al. Head-to-head comparison of 10 plasma phospho-tau assays in prodromal Alzheimer's disease. Brain. 2023;146(4):1592–601.
32. Vos SJ, Visser PJ, Verhey F, Aalten P, Knol D, Ramakers I, et al. Variability of CSF Alzheimer's disease biomarkers: implications for clinical practice. PLoS One. 2014;9(6):e100784.
33. Guillen N, Contador J, Buongiorno M, Alvarez I, Culell N, Alcolea D, et al. Agreement of cerebrospinal fluid biomarkers and amyloid-PET in a multicenter study. Eur Arch Psychiatry Clin Neurosci. 2025;275(1):257–66.
34. Cullen NC, Janelidze S, Mattsson-Carlgren N, Palmqvist S, Bittner T, Suridjan I, et al. Test-retest variability of plasma biomarkers in Alzheimer's disease and its effects on clinical prediction models. Alzheimers Dement. 2023;19(3):797–806.
35. Dumurgier J, Vercruysse O, Paquet C, Bombois S, Chaulet C, Laplanche JL, et al. Intersite variability of CSF Alzheimer's disease biomarkers in clinical setting. Alzheimers Dement. 2013;9(4):406–13.
36. Beam AL, Kohane IS. Big Data and Machine Learning in Health Care. JAMA. 2018;319(13):1317–8.
37. Rajkomar A, Dean J, Kohane I. Machine Learning in Medicine. N Engl J Med. 2019;380(14):1347–58.
38. Vieira S, Pinaya WH, Mechelli A. Using deep learning to investigate the neuroimaging correlates of psychiatric and neurological disorders: Methods and applications. Neurosci Biobehav Rev. 2017;74(Pt A):58–75.
39. Arbabshirani MR, Plis S, Sui J, Calhoun VD. Single subject prediction of brain disorders in neuroimaging: Promises and pitfalls. Neuroimage. 2017;145(Pt B):137–65.
40. Weiner MW, Kanoria S, Miller MJ, Aisen PS, Beckett LA, Conti C, et al. Overview of Alzheimer's Disease Neuroimaging Initiative and future clinical trials. Alzheimers Dement. 2025;21(1):e14321.
41. Sperling RA, Rentz DM, Johnson KA, Karlawish J, Donohue M, Salmon DP, et al. The A4 study: stopping AD before symptoms begin? Sci Transl Med. 2014;6(228):228fs13.
42. Altman DG, Bland JM. Diagnostic tests 2: Predictive values. BMJ. 1994;309(6947):102.
43. Steyerberg EW, Harrell FE, Jr., Borsboom GJ, Eijkemans MJ, Vergouwe Y, Habbema JD. Internal validation of predictive models: efficiency of some procedures for logistic regression analysis. J Clin Epidemiol. 2001;54(8):774–81.
44. Steyerberg EW, Vickers AJ, Cook NR, Gerds T, Gonen M, Obuchowski N, et al. Assessing the performance of prediction models: a framework for traditional and novel measures. Epidemiology. 2010;21(1):128–38.
45. Van Calster B, McLernon DJ, van Smeden M, Wynants L, Steyerberg EW, Topic Group 'Evaluating diagnostic t, et al. Calibration: the Achilles heel of predictive analytics. BMC Med. 2019;17(1):230.
46. Linden A. Measuring diagnostic and predictive accuracy in disease management: an introduction to receiver operating characteristic (ROC) analysis. J Eval Clin Pract. 2006;12(2):132–9.
47. Warmenhoven N, Salvado G, Janelidze S, Mattsson-Carlgren N, Bali D, Orduna Dolado A, et al. A comprehensive head-to-head comparison of key plasma phosphorylated tau 217 biomarker tests. Brain. 2025;148(2):416–31.
48. Efron B, Halloran E, Holmes S. Bootstrap confidence levels for phylogenetic trees. Proc Natl Acad Sci U S A. 1996;93(14):7085–90.
49. Subbaswamy A, Saria S. From development to deployment: dataset shift, causality, and shift-stable models in health AI. Biostatistics. 2020;21(2):345–52.
50. von Elm E, Altman DG, Egger M, Pocock SJ, Gotzsche PC, Vandenbroucke JP, et al. The Strengthening the Reporting of Observational Studies in Epidemiology (STROBE) statement: guidelines for reporting observational studies. Lancet. 2007;370(9596):1453–7.
51. Collins GS, Reitsma JB, Altman DG, Moons KG. Transparent Reporting of a multivariable prediction model for Individual Prognosis Or Diagnosis (TRIPOD). Ann Intern Med. 2015;162(10):735–6.
52. Karikari TK, Benedet AL, Ashton NJ, Rodriguez JL, Snellman A, Suarez-Calvet M, et al. Diagnostic performance and prediction of clinical progression of plasma phospho-tau181 in the Alzheimer's Disease Neuroimaging Initiative. MOLECULAR PSYCHIATRY. 2021;26(2):429–42.
53. Palmqvist S, Whitson HE, Allen LA, Suarez-Calvet M, Galasko D, Karikari TK, et al. Alzheimer's Association Clinical Practice Guideline on the use of blood-based biomarkers in the diagnostic workup of suspected Alzheimer's disease within specialized care settings. Alzheimers Dement. 2025;21(7):e70535.
54. Sperling RA, Donohue MC, Rissman RA, Johnson KA, Rentz DM, Grill JD, et al. Amyloid and Tau Prediction of Cognitive and Functional Decline in Unimpaired Older Individuals: Longitudinal Data from the A4 and LEARN Studies. J Prev Alzheimers Dis. 2024;11(4):802–13.
55. Li Y, Schindler SE, Bollinger JG, Ovod V, Mawuenyega KG, Weiner MW, et al. Validation of Plasma Amyloid-beta 42/40 for Detecting Alzheimer Disease Amyloid Plaques. Neurology. 2022;98(7):e688–e99.
56. Palmqvist S, Janelidze S, Quiroz YT, Zetterberg H, Lopera F, Stomrud E, et al. Discriminative Accuracy of Plasma Phospho-tau217 for Alzheimer Disease vs Other Neurodegenerative Disorders. JAMA. 2020;324(8):772–81.
57. Jansen WJ, Janssen O, Tijms BM, Vos SJB, Ossenkoppele R, Visser PJ, et al. Prevalence Estimates of Amyloid Abnormality Across the Alzheimer Disease Clinical Spectrum. JAMA Neurol. 2022;79(3):228–43.
58. Palmqvist S, Tideman P, Cullen N, Zetterberg H, Blennow K, Dage JL, et al. Prediction of future Alzheimer's disease dementia using plasma phospho-tau combined with other accessible measures. Nat Med. 2021;27(6):1034–42.
59. Bossuyt PM, Reitsma JB, Bruns DE, Gatsonis CA, Glasziou PP, Irwig L, et al. STARD 2015: an updated list of essential items for reporting diagnostic accuracy studies. BMJ. 2015;351:h5527.
60. Tijms BM, Willemse EAJ, Zwan MD, Mulder SD, Visser PJ, van Berckel BNM, et al. Unbiased Approach to Counteract Upward Drift in Cerebrospinal Fluid Amyloid-beta 1-42 Analysis Results. Clin Chem. 2018;64(3):576–85.
61. Wynants L, Van Calster B, Collins GS, Riley RD, Heinze G, Schuit E, et al. Prediction models for diagnosis and prognosis of covid-19: systematic review and critical appraisal. BMJ. 2020;369:m1328.
62. Raffield LM, Dang H, Pratte KA, Jacobson S, Gillenwater LA, Ampleford E, et al. Comparison of Proteomic Assessment Methods in Multiple Cohort Studies. Proteomics. 2020;20(12):e1900278.
63. Hirtz C, Busto GU, Bennys K, Kindermans J, Navucet S, Tiers L, et al. Comparison of ultrasensitive and mass spectrometry quantification of blood-based amyloid biomarkers for Alzheimer's disease diagnosis in a memory clinic cohort. Alzheimers Res Ther. 2023;15(1):34.
64. Riley RD, Archer L, Snell KIE, Ensor J, Dhiman P, Martin GP, et al. Evaluation of clinical prediction models (part 2): how to undertake an external validation study. BMJ. 2024;384:e074820.
65. Arshi B, Cowley LE, Rijnhart E, Reeve K, Smits LJ, Wynants L. External validation, impact assessment and clinical utilization of clinical prediction models: a prospective cohort study. J Clin Epidemiol. 2025;186:111902.
66. Alba AC, Agoritsas T, Walsh M, Hanna S, Iorio A, Devereaux PJ, et al. Discrimination and Calibration of Clinical Prediction Models: Users' Guides to the Medical Literature. JAMA. 2017;318(14):1377–84.
67. de Hond AAH, Leeuwenberg AM, Hooft L, Kant IMJ, Nijman SWJ, van Os HJA, et al. Guidelines and quality criteria for artificial intelligence-based prediction models in healthcare: a scoping review. NPJ Digit Med. 2022;5(1):2.