Abstract
Background: Electromyography (EMG) technology has been shown to accurately measure individual muscle activation, force, and fatigue, and thus presents as an interesting aid to medical diagnosis. Surface EMG is a noninvasive alternative to traditional, intramuscular EMG. Our aim is to assess the feasibility of using surface EMG technology to measure activity of eight different shoulder muscles in healthy volunteers performing both daily living and range of motion exercises.
Methods: Nine subjects completed a series of three motions (abduction/adduction, internal/external rotation, and drinking). Eight surface EMG electrodes were used to measure muscle activity: anterior deltoid, middle deltoid, posterior deltoid, supraspinatus, infraspinatus, trapezius, teres major, and biceps brachii. Muscle activity was captured using wireless 3-dimensional Bluetooth sensors. ANOVA and principal component analysis (PCA) were used for statistical analysis to determine the pattern of shoulder muscle activation in response to upper arm’s activity of daily life.
Results: ANOVA analysis showed significantly different root mean square (RMS) values among muscles for all three exercises (p<0.001). Furthermore, for each individual muscle, there were statistically significant differences among the different motions (p<0.001). PCA displayed significant correlations between muscles for each motion and predominant muscle groupings. ANOVA analysis showed significantly different peak frequency values among muscles for all three exercises, in each phase of the exercise (p<0.001).
Conclusion: The results of this study indicate that kinematics of the muscles in the shoulder girdle and upper extremity can be accurately and effectively quantified using surface EMG. Specifically, force and fatigue can viably be measured and assessed in both superficial and deep muscles.
Introduction
Over the years, healthcare providers have used a host of physical examinations and clinical tools to assess a patient’s physical functioning and health, but many of these assessment tools lack generalizability among physicians or the specificity and sensitivity to accurately diagnose a patient. Range of motion measures are one-way physicians assess many physical deficiencies in the upper and lower extremity. These can be limited by discrepancies among testing methods or subjective interpretations of the findings, as some clinicians may have different definitions of range of motion deficits [1,2]. Further diagnostic tests may assess patient’s pain in a variety of positions and motions, which continues to be limited by inter- and intra-rater reliability as well as each test’s sensitivity and specificity [3-7]. Physicians may elect to use more specific tools, such as goniometers or dynamometers, to compare exact degrees or force output levels of muscle groups, but these measures are still limited. The information gathered from these instruments is reflective of the ability of muscle groups to perform specific motions, rather than true health of the individual musculature responsible for the motion.
Electromyography (EMG) has emerged as an interesting aid toward medical intervention due to its ability to accurately measure individual muscle activation, force, and fatigue [8-11]. More specifically surface EMG (sEMG) presents as a noninvasive, yet still effective, alternative to traditional, intramuscular EMG – an invasive technique [12,13]. Although EMG analysis has long been used in both diagnostic and rehabilitative applications, in a variety of anatomical regions, methodology for collection, analysis, and application varies drastically throughout the literature and hinders its suitability for widespread use.
The shoulder is a particularly interesting site for EMG analysis due to the intricacies of deep and superficial muscle coordination in the shoulder girdle. Intramuscular EMG was previously preferred to sEMG when deep muscles were under analysis but recently some studies have suggested that sEMG could suffice as an accurate measure of multiple-muscle activation in the shoulder girdle [10,11]. While there is a general understanding in the literature that maximum voluntary contraction (MVC) provides the most standardized and reliable method of assessing musculature [14], there is a lack of agreement regarding how to effectively measure and analyze a host of shoulder muscle EMG profiles in patients that cannot perform maximum voluntary isometric contractions. Normalization of EMG profiles has been proposed in the past by dividing mean or peak values by their baseline counterparts, thus providing a relative increase in activation, although these studies have largely used indwelling EMG on a small number of muscles or motions [15,16,17].
The purpose of this study was to assess the feasibility and validity of sEMG analysis on the upper extremity of healthy subjects in both daily living and clinical range of motion exercises. The secondary purpose of this study is to establish reference activation values and synergistic patterns for future clinical use in patients that cannot asymptomatically elicit MVC.
We hypothesize that sEMG analysis, using baseline sEMG for the normalization of EMG measurement, will accurately differentiate metrics between a host of muscles in the shoulder girdle.
Methods
Institutional review board approval from the Wayne State University (IRB# 052619MP2E) was obtained prior to data collection or analysis. From December 2018 to May 2019, nine healthy individuals, aged 23.9 ± 1.13 years, were recruited to comprise the study group and underwent normative sEMG testing of shoulder muscle activity. They were informed of the experimental procedures and written consent was obtained. All subjects claimed to have no known current or previous upper extremity injuries.
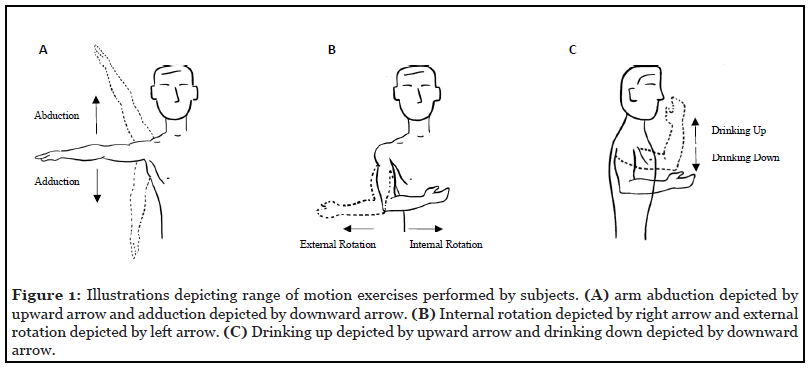
Subjects completed a series of three motions (abduction/adduction, internal/external rotation, and drinking; Figures 1A-1C), which were separately grouped into three phases: resting, outward movements, and inward movements. Eight surface EMG electrodes were used to measure muscle activity: anterior deltoid (Channel 1, Ch1), middle deltoid (Ch2), posterior deltoid (Ch3), supraspinatus (Ch4), infraspinatus (Ch5), trapezius (Ch6), teres major (Ch7), and biceps brachii (Ch8). Muscle activity was captured using wireless 3-dimensional Bluetooth sensors linked to a computerized analysis system (Model Trigno™ Avanti Platform, DELSYS Inc., Natick, MA, USA). Surface EMGs were placed on the central point of muscle belly in direction of muscle pull, after skin region was rubbed with alcohol.
In effort to standardize movements, the motions of participants were recorded via videotape and reviewed for consistency. Although any erratic movements were not included in EMG analysis, there was no reason to assume biased data as each subject completed each motion and speed three separate times. Raw EMG signals were band pass filtered using 3rd order Butterworth filter (20 – 350 Hz) and analysis was used to determine force and degree of activation (root mean square) and peak frequency of power spectral density (PSD) curves in each EMG signal using an EMG analysis software (EMG Works 4, DELSYS Inc., Natick, MA, USA). Exclusion criteria for this study was any previous indication of shoulder complication or intervention, or inability to perform any of the motions due to pain or stiffness.
Normalization of EMG measurement
In order to normalize EMG values among subjects for analysis, the proportion between the contraction phase RMS values and resting phase RMS values were calculated and assessed as percentage increases. In contrast, peak frequencies obtained from power spectral density curves were not normalized. This is due to the nature of a Fast Fourier Transformation (FFT) that provides a distribution of power as a function of frequency, which results in the analysis of the shape of the curve rather than the amplitude.
EMG data analysis
RMS values were taken from two locations: immediately preceding the motion (baseline) and during the entire length of the motion. RMS of the motion was then divided by the baseline RMS to determine percentage increase of RMS values from resting. Power spectral density (PSD) plots were created from each motions’ EMG graph and peak frequency values were noted. Specifically, this PSD calculation uses the Welch method, where the data is first divided into overlapping sections with specified window length and overlap and then by the Hanning window type. The result is then zero-padded to specified FFT length. The magnitude squared of the FFT, of each of the sections, is then averaged to determine PSD.
Statistical analysis
One-way analysis of variance (ANOVA) was used to identify any significant difference among muscle activation between movements and muscles. Least Significant Difference (LSD) post hoc test was used to determine specific differences between individual muscle activation. Principal component analysis (PCA) was utilized to uncover which factors (groups of muscles) were activated synchronously. Synergic activation of individual muscles was analyzed using PCA to determine synchronization of muscles in response to a specific arm motion. All analyses were performed using a significance level of 5%. SPSS software was used for all statistical analyses (IBM Corp. Released 2017. IBM SPSS Statistics for Windows, Version 25.0. Armonk, NY: IBM Corp.).
Results
The subject cohort included 6 men (66.7%) and 3 women (33.3%), aged 23.9 ± 1.13 years old (mean ± SD). All available data was used for analysis.
Time domain (Root mean square)
The biceps brachii showed the greatest percent increase in RMS for the drinking up motion (p<0.005), while the biceps brachii, anterior deltoid, and trapezius muscles showed the greatest percent increase for the drinking down motion (p<0.005). The infraspinatus showed the greatest percent increase in RMS for abduction (p<0.005), while the biceps brachii showed the greatest percent increase for adduction (p>0.05). The anterior deltoid showed the greatest percent increase in RMS for external rotation (p<0.005), while middle deltoid, anterior deltoid, and infraspinatus showed the greatest percent increase for internal rotation (p<0.005). Average percent increases for each muscle, during each motion, can be seen in Table 1.
| Anterior Deltoid | Middle Deltoid | Posterior Deltoid | Supraspinatus | Infraspinatus | Trapezius | Teres Major | Biceps Brachii | ANOVA | |
|---|---|---|---|---|---|---|---|---|---|
| Drink Up | 164 ± 20 | 634 ± 117 | 122 ± 15 | 234 ± 26 | 538 ± 181 | 194 ± 35 | 102 ± 10 | 1269 ± 318 | 0.000 |
| Drink Down | 125 ± 12 | 267 ± 39 | 128 ± 16 | 119 ± 11 | 228 ± 62 | 143 ± 16 | 146 ± 27 | 309 ± 49 | 0.000 |
| External Rotation | 234 ± 77 | 109 ± 15 | 181 ± 42 | 349 ± 108 | 331 ± 134 | 629 ± 178 | 312 ± 56 | 175 ± 51 | 0.009 |
| Internal Rotation | 191 ± 48 | 122 ± 18 | 122 ± 25 | 292 ± 79 | 221 ± 56 | 438 ± 174 | 200 ± 63 | 507 ± 175 | 0.048 |
| Abduction | 2854 ± 401 | 5411 ± 767 | 1128 ± 307 | 1595 ± 539 | 3084 ± 1088 | 2026 ± 676 | 284 ± 56 | 881 ± 290 | 0.000 |
| Adduction | 1817 ± 360 | 2418 ± 365 | 703 ± 100 | 743 ± 197 | 2265 ± 1065 | 1301 ± 458 | 252 ± 38 | 753 ± 303 | 0.006 |
| ANOVA | 0.000 | 0.000 | 0.000 | 0.000 | 0.001 | 0.000 | 0.004 | 0.009 |
All values are expressed as percentages (%) in the format Mean ± Standard Error.
Table 1: Analysis of root mean square percent increase by muscle sensor and motion.
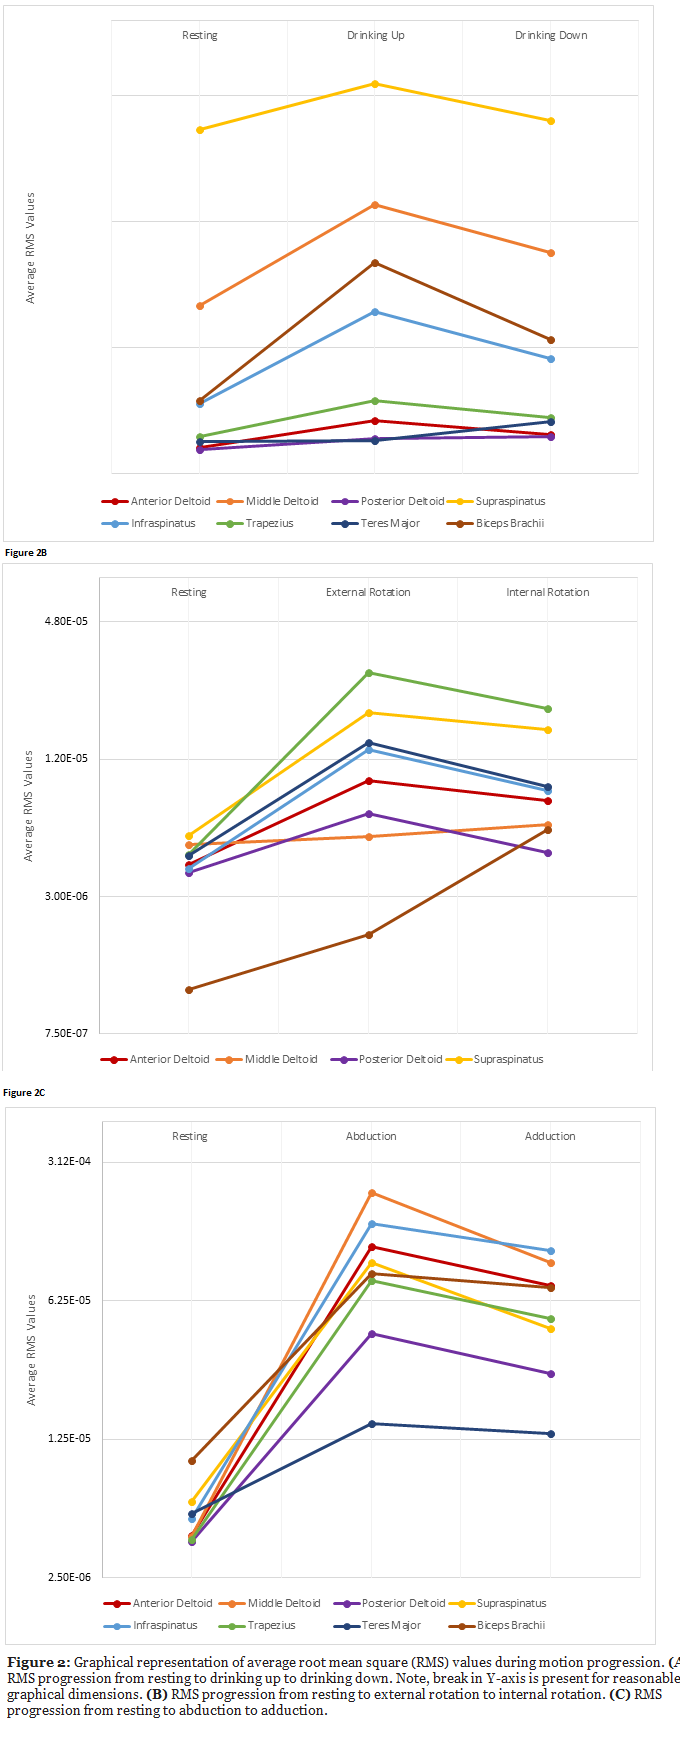
ANOVA analysis showed significantly different RMS values among muscles for all three exercises, in each phase of the exercise (resting, outward motion, inward motion) (p<0.001). Furthermore, for each individual muscle, there were statistically significant differences among the different motions (p<0.001, Table 1). Figures 2A-2C display the RMS progression of each muscle throughout the three phases of each motion.
Frequency domain (Power spectral density)
ANOVA analysis showed significantly different peak frequency values among muscles for all three exercises, in each phase of the exercise (resting, outward motion, inward motion) (p<0.001). Each deltoid muscle as well as trapezius and teres major showed statistically different peak frequency values among the varying motions (p<0.05). Average peak frequency values for each muscle, during each motion, can be seen in Table 2.
| Anterior Deltoid | Middle Deltoid | Posterior Deltoid | Supraspinatus | Infraspinatus | Trapezius | Teres Major | Biceps Brachii | ANOVA | |
|---|---|---|---|---|---|---|---|---|---|
| Drink Up | 201.5 ± 25.7 | 131.9 ± 19.6 | 193.3 ± 19.4 | 198.2 ± 53.5 | 131.4 ± 9.1 | 163.5 ± 19.2 | 196.0 ± 21.9 | 111.2 ± 4.5 | 0.049 |
| Drink Down | 240.5 ± 26.6 | 117.7 ± 12.8 | 198.2 ± 16.5 | 199.8 ± 19.5 | 140.0 ± 13.6 | 180.8 ± 20.7 | 152.0 ± 18.1 | 124.9 ± 7.1 | 0.000 |
| External Rotation | 186.2 ± 31.5 | 148.9 ± 24.7 | 135.2 ± 21.4 | 166.2 ± 28.3 | 106.1 ± 11.3 | 96.7 ± 11.9 | 92.4 ± 11.0 | 99.3 ± 13.0 | 0.005 |
| Internal Rotation | 200.5 ± 31.7 | 178.2 ± 28.2 | 122.9 ± 20.3 | 173.1 ± 30.2 | 121.2 ± 17.1 | 127.2 ± 21.3 | 105.5 ± 14.9 | 91.5 ± 9.2 | 0.006 |
| Abduction | 101.9 ± 11.5 | 106.5 ± 10.7 | 102.0 ± 10.9 | 103.7 ± 15.2 | 135.2 ± 32.0 | 91.1 ± 10.3 | 96.4 ± 10.7 | 98.1 ± 76.2 | 0.647 |
| Adduction | 105.2 ± 11.7 | 102.6 ± 10.7 | 95.5 ± 10.3 | 105.3 ± 11.7 | 101.6 ± 11.3 | 95.6 ± 11.2 | 105.1 ± 14.9 | 107.2 ± 4.1 | 0.995 |
| ANOVA | 0.000 | 0.048 | 0.000 | 0.096 | 0.505 | 0.000 | 0.000 | 0.159 |
All values are expressed as frequencies (Hz) in the format Mean ± Standard Error.
Table 2: Analysis of power spectral density peak frequency by muscle sensor and motion.
Factor analysis
Principal component analysis (PCA) revealed significant groupings of muscles that fired synchronously. Every motion displayed at least two distinct groups of synergic muscle activation, with both “Drink Down” and “Internal Rotation” displaying three distinct groupings. All muscle groupings and correlative factors can be seen in Table 3.
| Component 1 | Component 2 | Component 3 | ||||
|---|---|---|---|---|---|---|
| Muscle | R | Muscle | R | Muscle | R | |
| Drink Up | Posterior Deltoid Supraspinatus Trapezius Teres Major Biceps Brachii | 0.868 0.825 0.839 0.847 0.758 | Middle Deltoid Anterior Deltoid | 0.923 0.806 | ||
| Drink Down | Supraspinatus Trapezius Infraspinatus | 0.899 0.810 0.892 | Middle Deltoid Anterior Deltoid | 0.896 0.774 | Teres Major Biceps Brachii | 0.800 0.808 |
| External Rotation | Supraspinatus Trapezius Infraspinatus Teres Major | 0.975 0.961 0.985 0.819 | Posterior Deltoid Biceps Brachii | 0.910 0.780 | ||
| Internal Rotation | Supraspinatus Trapezius Infraspinatus | 0.783 0.939 0.959 | Teres Major Biceps Brachii | 0.714 0.947 | Middle Deltoid Posterior Deltoid | 0.947 0.863 |
| Abduction | Middle Deltoid Anterior Deltoid Posterior Deltoid Supraspinatus Infraspinatus | 0.878 0.832 0.845 0.831 0.843 | Trapezius Biceps Brachii | 0.831 0.636 | ||
| Adduction | Middle Deltoid Anterior Deltoid Posterior Deltoid Biceps Brachii | 0.954 0.910 0.777 0.807 | Supraspinatus Infraspinatus | 0.915 0.886 | ||
Table 3: Principal component analysis of root mean square per muscle and motion.
Discussion
The results of this study indicate that kinematics of the muscles in the shoulder girdle and upper extremity can be accurately and effectively quantified using surface EMG. Specifically, force and fatigue can be viably measured and assessed in both superficial and deep muscles. These assessments show feasibility in both daily living motions as well as widely-accepted range of motion exercises. Finally, we describe both reference values for healthy musculature activation and synergistic activation patterns. To our knowledge, no study to date has used normalization techniques of sEMG recordings to assess several shoulder muscles undergoing range of motion and daily living exercises.
Root mean square analysis has been investigated in a plethora of studies but has been at the center of controversy for its interpretation and application [15-20]. Many scientists believe that in order to standardize and generalize RMS measurements, we must measure them as a proportion of each individual patient’s maximal voluntary contraction, or MVC [18-20]. MVC has been widely accepted into the EMG community as an effective tool for comparing EMG measurements, but presents with issues when adapting to cohorts with traumatic injury or neurological dysfunction. For example, a patient that has recently undergone shoulder replacement, or has had a recent stroke, would reasonably not test near their actual maximal voluntary contraction. Thus, the present study extended previous efforts of EMG normalization without inclusion of MVC [15-17]. We found sEMG sensors to adequately capture EMG data, which was distinguishable by both individual muscle and motion, when normalization techniques were used. In this scenario, healthcare providers are better able to track patients progress during treatment.
Power spectral density analysis has also shown promise in the literature in its ability to demonstrate muscular fatigue over time [21,22]. Frequency shifts of spectral plots are indicators of muscular fatigue, specifically when these plots shift toward lower frequencies after muscular exertion [19]. Furthermore, some studies have shown that the percentage of area under the curve (AUC) that resides in lower frequency domains also correlates to muscular fatigue [23]. Our study demonstrates distinguishability of several muscles in the shoulder girdle when PSD analysis is considered. Both area-under-the-curve and peak frequency were unique factors in each of the eight muscles tested. Our results suggest a positive outlook for the future of sEMG use in clinical settings.
Our study does present with notable limitations in design. Primarily, we offered no comparison to accuracy with indwelling EMG or advanced imaging systems. Thus, limiting our conclusion of validity in the clinical field, although previous studies have investigated and concluded significantly similar physiological measurements between indwelling and surface EMG [24,25]. Further validity studies may include comparison of MVC to non-MVC normalization, as well as indwelling EMG comparison. While lacking comparison, our study focused on the feasibility and ease-of-use in clinic and in accordance with a cost-effective view on healthcare. Furthermore, our study only included nine young adults thereby limiting our ability to analyze the data with demographic subgroup tests and thus limiting the generalizability of our reference values. While older patients may not exhibit the same RMS-normalized values, they can still be properly tracked using baseline normalization and their synergistic activation profiles should resemble those described in the present study.
Conclusion
By demonstrating the feasibility of using sEMG to accurately measure daily living and range of motion exercises in a host of upper extremity muscles, we have provided clinicians with a valid means of assessing patient muscular health. Thus, by identifying RMS and peak frequency values, as well as isolating synchronous firing patterns, we have described a muscular profile that can be referenced as a healthy standard or replicated for future use.
References
2. Schlager A, Ahlqvist K, Rasmussen-Barr E, Bjelland EK, Pingel R, Olsson C, Nilsson-Wikmar L, Kristiansson P. Inter-and intra-rater reliability for measurement of range of motion in joints included in three hypermobility assessment methods. BMC Musculoskeletal Disorders. 2018 Dec;19(1):1-0.
3. Accounting for velocity of the pivot shift test manoeuvre decreases kinematic variability- ClinicalKey. https://www-clinicalkey-com.sladenlibrary.hfhs.org/#!/ content/playContent/1-s2.0S0968016010000736?return u r l = h t t p s : % 2 F % 2 F l i n k i n g h u b . e l s e v i e r . c o m % 2 Fretrieve%2Fpii%2FS0968016010000736%3Fshowall%3 Dtrue&referrer=. Accessed March 13, 2020.
4. Alrwaily M, Timko M, Schneider M, Kawchuk G, Bise C, Hariharan K, Stevans J, Delitto A. Treatment-based Classification System for Patients with Low Back Pain: The Movement Control Approach. Physical Therapy. 2017 Dec 1;97(12):1147-1157.
5. Meserve BB, Cleland JA, Boucher TR. A meta-analysis examining clinical test utility for assessing superior labral anterior posterior lesions. The American Journal of Sports Medicine. 2009 Nov;37(11):2252-8.
6. Oberlander MA, Shalvoy RM, Hughston JC. The accuracy of the clinical knee examination documented by arthroscopy: a prospective study. The American Journal of Sports Medicine. 1993 Nov;21(6):773-8.
7. Walton DM, Sadi J. Identifying SLAP lesions: a metaanalysis of clinical tests and exercise in clinical reasoning. Physical Therapy in Sport. 2008 Nov 1;9(4):167-76.
8. Allen TR, Brookham RL, Cudlip AC, Dickerson CR. Comparing surface and indwelling electromyographic signals of the supraspinatus and infraspinatus muscles during submaximal axial humeral rotation. Journal of Electromyography and Kinesiology. 2013 Dec 1;23(6):1343-9.
9. Ayatollahi K, Okhovatian F, Kalantari KK, Baghban AA. A comparison of scapulothoracic muscle electromyographic activity in subjects with and without subacromial impingement syndrome during a functional task. Journal of Bodywork and Movement Therapies. 2017 Jul 1;21(3):719-24.
10. Boettcher CE, Cathers I, Ginn KA. The role of shoulder muscles is task specific. Journal of Science and Medicine in Sport. 2010 Nov 1;13(6):651-6.
11. Reed D, Halaki M, Ginn K. The rotator cuff muscles are activated at low levels during shoulder adduction: an experimental study. Journal of Physiotherapy. 2010 Jan 1;56(4):259-64.
12. Cudlip AC, Kim SY, Dickerson CR. The ability of surface electromyography to represent supraspinatus anterior and posterior partition activity depends on elevation angle, hand load and plane of elevation. Journal of Biomechanics. 2020 Jan 23;99:109526.
13. Péter A, Andersson E, Hegyi A, Finni T, Tarassova O, Cronin N, et al. Comparing surface and fine-wire electromyography activity of lower leg muscles at different walking speeds. Frontiers in Physiology. 2019;10:1283.
14. Visser J, Mans E, De Visser M, Van den Berg-Vos RM, Franssen H, De Jong JM, et al. Comparison of maximal voluntary isometric contraction and handheld dynamometry in measuring muscle strength of patients with progressive lower motor neuron syndrome. Neuromuscular Disorders. 2003 Nov 1;13(9):744-50.
15. Allison GT, Marshall RN, Singer KP. EMG signal amplitude normalization technique in stretch-shortening cycle movements. Journal of Electromyography and Kinesiology. 1993 Jan 1;3(4):236-44.
16. Bolgla LA, Uhl TL. Reliability of electromyographic normalization methods for evaluating the hip musculature. Journal of Electromyography and Kinesiology. 2007 Feb 1;17(1):102-11.
17. Knutson LM, Soderberg GL, Ballantyne BT, Clarke WR. A study of various normalization procedures for within day electromyographic data. Journal of Electromyography and Kinesiology. 1994 Jan 1;4(1):47-59.
18. Arsenault AB, Winter DA, Marteniuk RG, Hayes KC. How many strides are required for the analysis of electromyographic data in gait? Journal of Rehabilitation Medicine. 1986;18(3):133-5.
19. Halaki M, Ginn K. Normalization of EMG signals: to normalize or not to normalize and what to normalize to. Computational intelligence in electromyography analysis-a perspective on current applications and future challenges. 2012 Oct 17:175-94.
20. Yang JF, Winter DA. Electromyography reliability in maximal and submaximal isometric contractions. Archives of Physical Medicine and Rehabilitation. 1983 Sep 1;64(9):417-20.
21. Hotta Y, Ito K. EMG-based detection of muscle fatigue during low-level isometric contraction: effects of electrode configuration and blood flow restriction. In2011 Annual International Conference of the IEEE Engineering in Medicine and Biology Society 2011 Sep (pp. 3877-3879). IEEE.
22. Tarata MT. Mechanomyography versus electromyography, in monitoring the muscular fatigue. Biomedical Engineering Online. 2003 Dec 1;2(1):3.
23. Madeleine P, Jørgensen L, Søgaard K, Arendt-Nielsen L, Sjøgaard G. Development of muscle fatigue as assessed by electromyography and mechanomyography during continuous and intermittent low-force contractions: effects of the feedback mode. European Journal of Applied Physiology. 2002 May 1;87(1):28-37.
24. Bogey R, Cerny K, Mohammed O. Repeatability of wire and surface electrodes in gait. American Journal of Physical Medicine & Rehabilitation. 2003 May 1;82(5):338-44.
25. Bogey RA, Perry J, Bontrager EL, Gronley JK. Comparison of across-subject EMG profiles using surface and multiple indwelling wire electrodes during gait. Journal of electromyography and kinesiology: Official Journal of the International Society of Electrophysiological Kinesiology. 2000 Aug;10(4):255.