Abstract
Obesity is a worldwide epidemic and a major risk factor for numerous diseases. The regulation of feeding behavior and body weight depends on a wide range of neuronal pathways influencing satiety and hunger. Serotonin (5-HT) is one of those players identified to have a profound effect on energy homeostasis. The effect of obesity on 5-HT metabolism in the gastrointestinal (GI) tract and its underlying mechanisms still needs to be further elaborated. The aim of the present study was to investigate the effect of diet-induced obesity (DIO) on 5-HT in the enteric nervous system, the expression of different enzymes and receptors of the 5-HT pathway in the brain and GI tract, GI transit and behavior. Zebrafish were fed either a high caloric diet during 4 weeks or a normal diet (CNTL). The proportion of serotonergic neurons in the GI tract was analyzed using immunofluorescent double staining. Quantitative PCR (qPCR) was performed on brain and GI tissue to analyze the expression of 5-HT receptors, the 5-HT precursor, tryptophan hydroxylase (tph), 5-HT transporter (SERTa/b) and monoamine oxidase (MAO). GI transit was measured by gavaging glass beads or providing fluorescently labeled food and calculating the geometric centre (GC). Swim behavior was calculated as preferential swim area, swim speed and distance. Results showed an increase in body mass index after 4 weeks. Overfeeding increased the proportion of serotonergic neurons in the proximal GI tract. qPCR revealed significantly elevated levels for tph2, but not for tph1a/b, in the brain and the intestine of DIO fish. Furthermore, a significant increase in the expression of the 5-HT4 receptor and SERTa were observed in the brain, but not in the GI tract, while 5-HT2b receptor showed to be upregulated in the GI tract, but not the brain. GC was increased after feeding with fluorescently labeled food. Also, the intestinal length in DIO fish was significantly larger, indicating higher transit rates compared to CNTL fish. No differences in behavior were observed between the two groups. This study, revealed an increase in 5-HT expression in enteric neurons probably due to an increased tph2 expression in the intestine, resulting in increased GI transit. Furthermore, DIO exhibited increased expression of the 5-HT4 receptor and SERTa in the brain, and 5-HT2b receptor in the GI tract, respectively. The present data obtained from zebrafish are in line with earlier findings in mammalian models and further validate the zebrafish as a model for GI research.
Keywords
Diet induced obesity, Serotonin, Gastrointestinal transit, Zebrafish, Enteric nervous system
Introduction
Obesity and overweight are defined as abnormal or excessive fat accumulation that may impair health. It is a worldwide epidemic: more than 39% of the people worldwide are overweight, from which more than 13% are obese [1]. Since 1980, the prevalence of obesity has doubled [2,3]. The exact cause remains unclear, but complex interactions between different factors underlie its development (e.g., genetic predisposition, high caloric intake and decreased physical activity) [2-4]. Obesity is a major public health problem associated with a number of comorbidities, including cancer, type 2 diabetes, infertility and cardiovascular diseases [5]. While the gastrointestinal (GI) tract is the major organ involved in food intake, studies assessing changes in normal GI functioning are rather scarce and have yielded conflicting results. Nevertheless, obesity has often been linked to GI symptoms such as gastro-esophageal reflux disease, abdominal pain and diarrhea, but also to dysmotility and inflammatory bowel disease [6-8]. GI motility and absorption/ secretion are involved in the interaction between food intake and its digestion, which is why the factors controlling these processes are important [9].
One of these factors that seem to control multiple aspects within the brain-gut axis is the monoamine neurotransmitter 5-hydroxytryptamine or serotonin (5-HT) (for review see, [10]). The vast majority of 5-HT (95%) is synthesized within the gut with over 90% being produced within the enterochromaffin cells and the remainder located within the enteric nervous system (ENS) [11]. Also, platelets readily take up 5-HT from the plasma or the GI tract [12]. In the central nervous system (CNS), 5-HT is mainly expressed in the raphe nuclei [13]. Upon release, 5-HT binds specific 5-HT receptor subtypes. Phylogenetic comparison revealed that these receptors are conserved between species [14,15]. The 5-HT receptor subtypes are broadly classified into 7 classes (5-HT1R to 5-HT7R) and 14 subclasses (extra 5-HT1aR, 1bR, 1pR, 2aR, 2bR, 2cR isoforms), which are all G-coupled protein receptors (GPCRs), except for the 5-HT3 receptor, which is a ligand-gated Na+/K+ ion channel [15-17]. Targeting some 5-HT receptors already offered some perspective in the treatment of obesity, but the underlying mechanisms through which these receptors reduce food intake and body weight are not fully understood [18]. 5-HT is catabolized by monoamine oxidase (MAO) and in the GI tract also by glucuronosyltransferase [19,20]. Being intracellular molecules, these enzymes do not contribute to the termination of 5-HT-mediated signaling events [21]. The action of 5-HT is predominantly terminated by uptake into the cells through the 5-HT re-uptake transporter (SERT) [21,22]. Interaction with both MAO and SERT constitutes the mode of action of some therapeutically interesting drugs. Interestingly, MAO inhibitors (MAOI) and selective serotonin re-uptake inhibitors (SSRI), mainly used as antidepressants, are correlated to changes in body weight [23,24]. However, the underlying mechanisms remain to be elucidated [23].
Because 5-HT does not cross the blood-brain barrier under normal conditions, central and peripheral 5-HT are two functionally separated entities [11,25]. The rate-limiting step in 5-HT synthesis is the hydroxylation of L-tryptophan by tryptophan hydroxylase (tph). In mammals, tph exists in two isoforms, tph1 and tph2. tph1 is primarily expressed in peripheral tissues (enterochromaffin cells, spleen, thymus, pineal gland), whereas tph2 is neuron specific (CNS and ENS) [26-28]. In the GI tract, 5-HT is an important signaling molecule in the initiation of peristalsis and secretion reflexes and in the signaling transmission from the GI tract to the CNS [21]. 5-HT is also important in satiety and numerous anti-obesity therapies have been directly or indirectly linked with the 5-HT expression pathway [29]. Furthermore, some studies indicate a link between 5-HT up- and downstream actors that are associated with weight gain and obesity [30]. Although the main source of 5-HT is the GI tract, and not the CNS, the true effect of gut-derived 5-HT on satiety and in a larger context, on obesity, has not been well studied to date [29].
Animal models have become an essential tool in the search of the underlying mechanisms of obesity and in the search for new therapies. Over the last two decades the zebrafish, Danio rerio (Class Teleostei, Family Cyprinidae), has attracted increasing interest as a vertebrate model system in a wide variety of research fields, including the field of gastroenterology and metabolic disorders [31,32]. Zebrafish are considered a valuable and alternative animal model to study diet-induced obesity (DIO) [31,33,34]. Pathophysiological pathways in adult DIO zebrafish show large homology with obese mammals [33]. Other metabolic mechanisms described in humans, such as the synthesis and transport of fatty acids, are also present in zebrafish [35]. More recently, an experimental procedure to obtain a certain state of overfeeding in zebrafish larvae has been described [36]. Genes involved in 5-HT metabolism and actions have been identified in zebrafish [37-39]. Similar to mammals, in zebrafish the excess nutrients are also stored in the form of large unilocular lipid droplets in white adipocytes [34].
The structural organization of the zebrafish intestine is similar but less complex compared to mammalian species [40]. Zebrafish lack a real stomach, and the esophagus is directly connected to the proximal intestine (PI) [40]. Instead, the PI, or intestinal bulb, is somewhat enlarged and may function as a food reservoir. Clearly identifiable retrograde mixing motility patterns are present in the PI [41]. Moreover, the PI contains numerous absorptive enterocytes, scattered mucusproducing goblet cells and enteroendocrine cells [42,43]. The mid intestine (MI) contains abundant mucin-producing goblet cells and enterocytes. The expression of solute transporters and digestive enzymes within the enterocytes of the MI, lends support to a role for the MI in nutrient absorption [43]. The distal portion of the MI contains specialized enterocytes showing characteristics analogous to the antigen-presenting M-cells and submucosal lymphoid aggregates (Peyer’s patches) in the adult mammalian intestine [43]. The short distal intestine (DI) contains abundant numbers of acidic mucin-secreting goblet cells [42]. The absence of absorptive enterocytes as well as the main architecture of the DI, suggest a role analogous to the colon in mammals [44]. Histological and immunohistochemical analysis of the intestine in adult zebrafish revealed that the anatomy of the intestinal wall bears a strong resemblance to the GI tract in mammals, although some differences are observed [43]. Zebrafish lack a lamina muscularis mucosae and a tela submucosa between the lamina propria and the outer muscle layers. The epithelium comprises a single layer of cells and is arranged into broad irregular folds rather than villi, and lacks crypts of Lieberkühn [42]. In mammals, the enteric neurons form two ganglionic plexuses. In zebrafish, only one plexus, i.e., the myenteric plexus, which contains interconnected enteric neurons, is found between the longitudinal and circular smooth muscle layers [43]. Neurochemical coding in adult zebrafish intestine revealed three broad classes of enteric neurons: nitrergic, cholinergic and serotonergic [45,46].
The aim of this study is to investigate the effect of DIO on 5-HT metabolism in the intestine, especially in the enteric neurons.
Material and Methods
Zebrafish stock and breeding
Adult zebrafish were bred and kept in the Laboratory of Human Anatomy & Embryology at the University of Antwerp (LA1100125). Maintenance and breeding were performed as previously described [47]. Briefly, the animals were kept in colonies in well-aerated fresh water at 26°C in a 14/10h light/dark cycle. The water was continuously filtered both chemically and biologically. Stock fish were fed daily with commercial aquarium fish food. All experimental procedures were approved by the ethical committee of the University of Antwerp (ECD2015-21).
DIO zebrafish
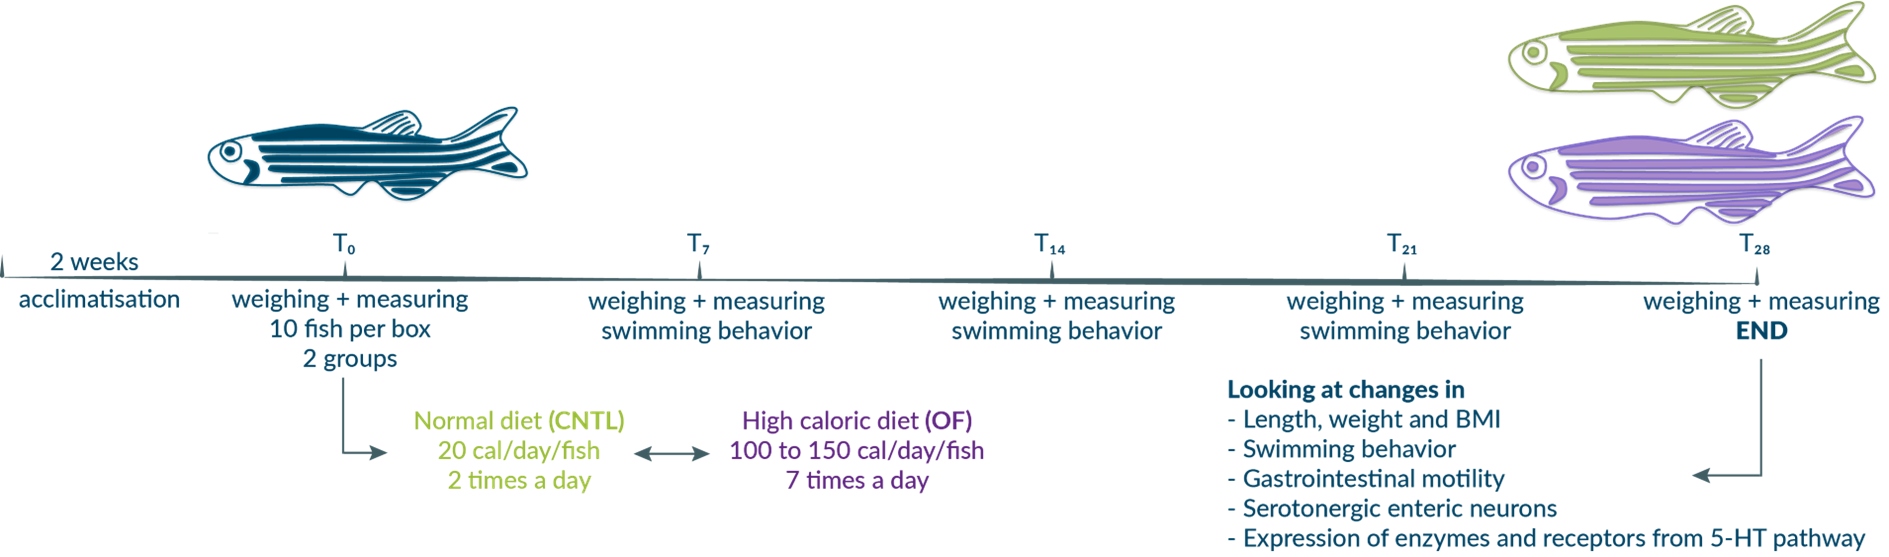
Adult, 3-month-old zebrafish were fed either a control diet (CNTL: 20 cal/fish/day) or a high caloric diet (DIO: 100 cal/fish/ day for the first two weeks and 150 cal/fish/day for the next two weeks) in a systematic way for 4 weeks [33,48]. Weight and body length were measured weekly to calculate and follow changes in BMI after light anesthesia with 4% tricaine methane sulfonate (MESAB). The body length was measured from head to the insertion of the tail fin with a digital precision caliper, and the body weight was determined on a digital balance after patting the fish dry with a cloth. The different parameters (BMI, length and weight) were analyzed with oneweek intervals (T0, T7, T14, T21 and T28) for CNTL and DIO fish in GraphPad Prism (version 5.0b) using a two-way ANOVA test, with a Sidak post-hoc test.
Immunohistochemistry
After euthanasia (in 10% MESAB), GI and brain tissue were dissected out and used for the preparation of wholemount as previously described [45]. Briefly, the intestine was opened along its mesenteric border and pinned out on a Sylgardlined Petri dish filled with 4% PFA/PBS for 2 hours at room temperature. After fixation, wholemounts were washed in PBS and further processed for immunofluorescent staining.
Immunofluorescence staining methods have been well described in adult zebrafish [45,46]. Double immunostainings allow the simultaneous detection of cell specific markers and markers of interest (Table 1).
| Primary antibodies | ||||
| Antigen | Host | Dilution | Company | |
| Huhuman neuronal protein C/D | Mouse | 1/500 | Molecular Probes Inc., Eugene, OR (A-21271) | |
| 5HT serotonin | Rabbit | 1/10 000 | Immunostar Inc., Hudson, WI (20080) | |
| Secondary antibodies | ||||
| Antigen | Fluorophore | Host | Dilution | Company (cat. number) |
| Mouse IgG | Alexa-488 | Donkey | 1/200 | Jackson ImmunoResearch Laboratories, West Grove, PA (715-545-151) |
| Rabbit IgG | CyTM3 | Donkey | 1/800 | Jackson ImmunoResearch Laboratories (771-165-152) |
For quantitative analysis of the proportional distribution of serotonergic enteric neurons, wholemount preparations of 12 CNTL and 12 DIO fish were used. The intestine was arbitrarily divided into four different regions: the proximal intestine (PI), the first and second parts of the mid intestine (MI1 and MI2) separated by the second intestinal curvature, and the distal intestine (DI). For each region, the proportion of 5-HT/Hu positive neurons was determined in ten different randomly chosen frames as previously described using a fluorescent microscope equipped with a digital camera (DFC450C, Leica Microsystems) [45]. Cells were manually counted using ImageJ (Cell Count) (NIH). The results are expressed as means ± standard deviation. For the neuronal proportions, data were first ArcSin transformed and subsequently analyzed with one-way ANOVA, followed by a Newman-Keuls multiple comparison test when appropriate using GraphPad Prism (version 5.0b).
qPCR experiments
All qPCR experiments were performed according to MIQE guidelines [49]. The brain and GI tract from 12 CNTL and 12 DIO male zebrafish were isolated using Dumont forceps, transferred to RNase free 0.5 mL eps filled with RNAlater (RNeasy Protect Mini Kit, Qiagen), incubated overnight for optimal penetration, and kept at -20°C until further use. The mRNA was extracted using bead homogenization (CK14 soft tissue homogenizing, Minilys, Precellys, Bertin) and purified using the Qiagen RNeasy spincolumn (Qiagen) following the manufacturer’s instructions. The RNA concentration was determined using spectrophotometric analysis (NanoDrop) by calculating the λ260/280 ratio. The RNA integrity number (RIN) was calculated in duplo using the Agilent 2100 Bioanalyzer (Agilent Technologies). Reverse transcription was performed using the iScriptTM cDNA synthesis kit (Bio-Rad) and Thermocycler (MJ MiniTM, Bio-Rad). qPCR was performed in triplo using SYBRTM Green incorporation in the CFX Connect Real-Time System (Bio-Rad). Specific primer pairs (Integrated DNA technologies, Leuven) were designed for selected targets using Primer-BLAST and checked for their efficiency [50] ( Table 2). For this study five candidate reference genes were selected and tested for their stability (Table 2). Targets include metabolic and catabolic enzymes (tph1a, tph1b, tph2, MOA), serotonin transporters (SERTa and SERTb) and seven 5-HT receptor genes (Table 2).
| Candidate reference genes | |||
|---|---|---|---|
| Target | Forward | Reverse | GeneID |
| B2M beta-2-microglobulin | CAAAGAGCGTTGCCTTCACC | ACGAATCCATCGCTCCATCG | BC062841 |
| EF1a elongation factor-1-alpha | CCTCTTTCTGTTACCTGGCAAA | CTTTTCCTTTCCCATGATTGA | NM_131263 |
| GAPDH glyceraldehyde-3-phosphate dehydrogenase | CTGGTATGGCCTTCCGTGTC | CTGCAGCCTTGACGACTTTC | NM_001115114 |
| RPS23 mitochondrial ribosomal protein s23 | AAAACCAAGAGGGGTCAGGC | GGACAACCATGCGCTTTCTC | NM_001003615 |
| RPL13a Ribosomal protein L13a | AGCAGACCCTGTACCTCAGC | TCCATTGCCATACACCTCAA | NM_212784 |
| Target genes | |||
| 5-HT1aaR serotonin 1aa receptor | TTCCTGGCCGCGTTAATTCT | TGGCCACATTCTGAAGCGAT | NM_001123321 |
| 5-HT1abR serotonin 1ab receptor | GTCTCAACCCAAGACTTGCATGAT | TTGCCGCTTTGAATATGCGT | NM_001145766 |
| 5-HT1bR serotonin 1b receptor | AGCGCATTTTGAAGCAGTCG | CGGGCGAATTAGTGCTCAGA | NM_001128709 |
| 5-HT2bR serotonin 2b receptor | GTGCTGGCTAAAATCGCACT | AAAGCCACCAAAGACCCGTA | NM_001044743 |
| 5-HT4R serotonin 4 receptor | ACCCATAATGCAAGGCTGGA | GCCACTACTGAGCACGTCAA | XM_009291062 |
| 5-HT6R serotonin 6 receptor | CAGTGCCTGGCTTCCCTTTT | TCGAAGAAGGAGGGTGGTACA | XM_009297078 |
| 5-HT7R serotonin 7 receptor | ATCGGTGGACGCTGGATTTT | TTGGCCATACACCAGCCATT | XM_685507 |
| tph1a tryptophan hydroxylase 1a | CACTGGGAGCATCAGACGAC | CTGCTTACAGAGCCCGAACT | NM_17830 |
| tph1b tryptophan hydroxylase 1b | ACATGCCGCGATTGTCTTCT | AGTTGCGCCGTCTCGATTTA | NM_001001834 |
| tph2 tryptphan hydroxylase 2 | ACTGGTGCAACACCTCAAAGA | ACAGTCCAAACAGTCGGTCTC | NM_001310068 |
| MAO monoamine oxidase | AGGAGGCGTTATATCCTGTGC | AGACCCTGCCAAACTGTGTC | NM_212827 |
| SERTa serotonin transporter | TGTGTGCCTTACATGGTC | CTGGAGCCTCGGGGGTAATA | NM_001039972 |
| SERTb serotonin transporter | CATCGGAGCTTCCTCCTTCA | AGCAAGCCGCTGTTTAAGAGA | NM_001177459 |
Table 2: Data on primerpairs used as a reference gene and as target gene.
Quantitative expression of the target genes in DIO fish was compared to that in CNTL fish and normalized using reference genes: EF1a and RPL13a for GI tract and EF1a and B2M for brain. Quantitative expression of the target genes was analyzed using GraphPad Prism (5.0b) and the values were compared between CNTL and DIO fish using an unpaired Student’s t-test. P-values smaller than 0.05 were considered significant.
GI motility
GI motility in adult zebrafish was determined by gavaging glass beads or feeding fluorescently labeled food. For gavaging glass beads, the zebrafish were anesthetized in 4% MESAB and placed on a wet sponge. A catheter was inserted to deliver the beads (diameter 0.4-0.5 mm) behind the esophageal sphincter at the beginning of the PI. The fish were placed back individually in small well-aerated fish tank for 3 hours. The fluorescently labeled food was made by mixing 150 μl yellow-green fluorescent microspheres (2 μm FluoSpheresTM, 505/515, Molecular Probes #F8827), 50 μl of deionized water and 100 mg Grana granules [51]. The ingredients were stirred together, left in the dark to dry at room temperature and then crushed into smaller pieces before feeding. Fish were fasted 24 hours in advance and fed fluorescent food (15 mg per box) in the morning. After 15 minutes fish were placed individually in small well-aerated fish tanks for 3 hours.
Next, the zebrafish were euthanized, the intestine was dissected out and cut open. The intestine was arbitrary divided into 7 regions and the feces: two parts in the PI, the first intestinal curvature, two parts of the MI separated by the second curvature and the DI. The relative distribution of the beads was calculated as the geometric center (GC=Σ(%beads or food present per segment x segment number)/100) [52], a measure of GI transit. As for the fluorescent labeled food, the relative distribution of the food over the different regions was determined and the GC calculated. The transit time (mm/hour) was calculated as the far most point the food had travelled within the intestine (in mm) during the 3 hours.
The data were statistically analyzed in GraphPad Prism (version 5.0b) by using an unpaired Student’s t-test. P-values smaller than 0.05 were considered significant.
Swim behavior
Zebrafish swimming behavior was tested using the ZebraCube (ZebraLab, ViewPoint Life Sciences Inc, Lyon, France). In this specific setup, different parameters of the swimming and shoaling behavior of control (N=10) and DIO (N=10) fish were measured. During the time of the experiment, the fish were tracked weekly (T0, T7, T14, T21 and T28). This was done by placing them either individually or in group in the tank using top and side mirrors to calculate 3D and 2D movements. After a pre-incubation time for 3 minutes, the fish were tracked for 7 minutes and registered every 10s. Time spent in different tank areas (low, mid and high), swim speed, swim distance and periods of activity were calculated. Statistical analysis was performed in GraphPad Prism (version 5.0b). Due to the small sample size, a non-parametric Mann-Whitney U test was used. P-values smaller than 0.05 were considered significant.
Results
Diet-induced obesity fish
At three months of age, the average BMI was 0.0550 ± 0.0089 (body length 2.70 ± 0.23cm, weight 0.42 ± 0.11g). At the end of the experiment CNTL fish only showed a small, but significant increase in body length (2.86 ± 0.23cm; 5%) over the four weeks, while the body length of the DIO fish increased more (3.13 ± 0.25cm; 15%) (Figure 1a). Comparison of both groups showed a significant larger body length from day 7 onwards (5%) in the DIO fish. At the end of the experiment, the DIO group presented a 10% larger body length than the CNTL group. In terms of body weight, the total body weight did not increase significantly for the CNTL fish (0.44 0.11g or 7%), but did so for the DIO fish (0.68 ± 0.18g or 62%) (Figure 1b). This increase in body weight for DIO fish was the most pronounced during the first week of overfeeding (+28%), while later a weekly weight gain of ± 10% was achieved. Due to this large increase in the first week, there was a significant difference between groups from day 7 on and the remaining time of the experiment. The BMI for the CNTL fish remained unchanged in time, while the BMI of the DIO fish was increased by 25% (to 0.0689 ± 0.0123g/cm3) (Figure 1c). Comparing CNTL with DIO fish, a significant difference in BMI was observed from day 7 on. At day 28, the BMI from CNTL fish and DIO fish differed by 28%.
Significant differences were observed between male and female fish for body weight and BMI in both the CNTL and DIO group at day 28 (Table 3). For body length, no difference was observed within treatment groups. This was probably due to the significant increased egg weight in the female fish (p-value=0.0026 - Unpaired t-test; N=12 per group: 0.0614g ± 0.0282 for CNTL and 0.1087g ± 0.0379). However, when comparing the relative weight of the eggs (weight eggs/body weight), no significant difference (p-value=0.5608 - Unpaired t-test, N=12 per group) between the CNTL and the DIO fish was observed (11.18 ± 3.99% for CNTL and 12.17 ± 4.01% for the DIO fish).
| Length (cm) | Weight (g) | BMI (g/cm2) | ||||
|---|---|---|---|---|---|---|
| Male | Female | Male | Female | Male | Female | |
| CNTL | 2.83 ± 0.21 | 2.87 ± 0.25 | 0.3993 ± 0.0779 | 0.4779 ± 0.1114 | 0.0488 ± 0.0046 | 0.0576 ± 0.0079 |
| DIO | 3.14 ± 0.23 | 3.11 ± 0.29 | 0.5967 ± 0.1230 | 0.7362 ± 0.1890 | 0.0624 ± 0.0077 | 0.0742 ± 0.0129 |
When comparing the mean length and width of the intestinal preparations, we found an overall significant increase between CNTL and DIO fish for both parameters (Table 4). On average, the length of the intestine in DIO fish was approximately 20% longer and wider compared to that of CNTL fish. Given that the intestine is be a triangle, surface equals (length times width)/2; the average surface increased from 52.28 mm2 in CNTL fish to 75.84 mm2 in DIO fish, corresponding to a theoretical surface increase of 31%.
| Length (mm) | Width (mm) | |
|---|---|---|
| CNTL | 23.67 ± 4.232 | 4.417 ± 1.443 |
| DIO | 28.62 ± 4.315*** | 5.3 ± 0.9487* |
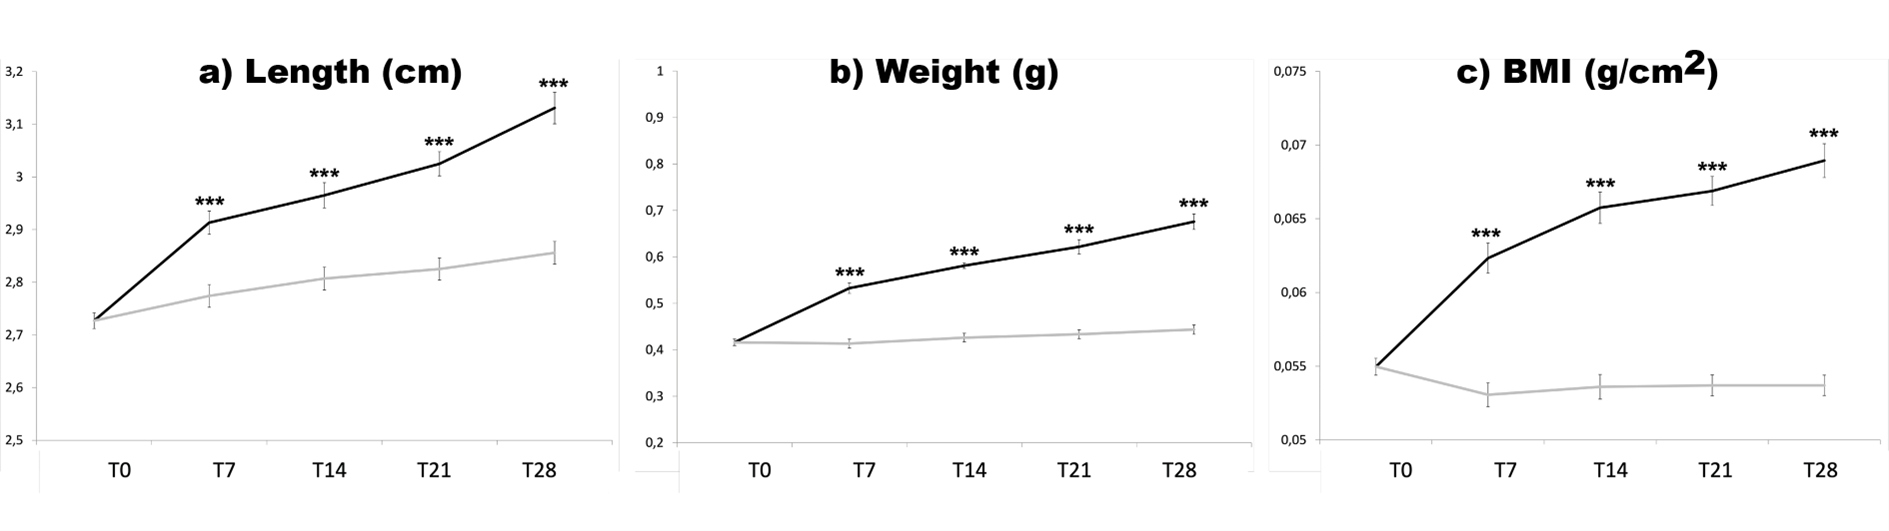
Table 4: Mean (±SD) intestinal length and width of control (CNTL) and diet-induced obese (DIO) fish. * p-value <0.05, ***p-value < 0.001.
Serotonergic neurons
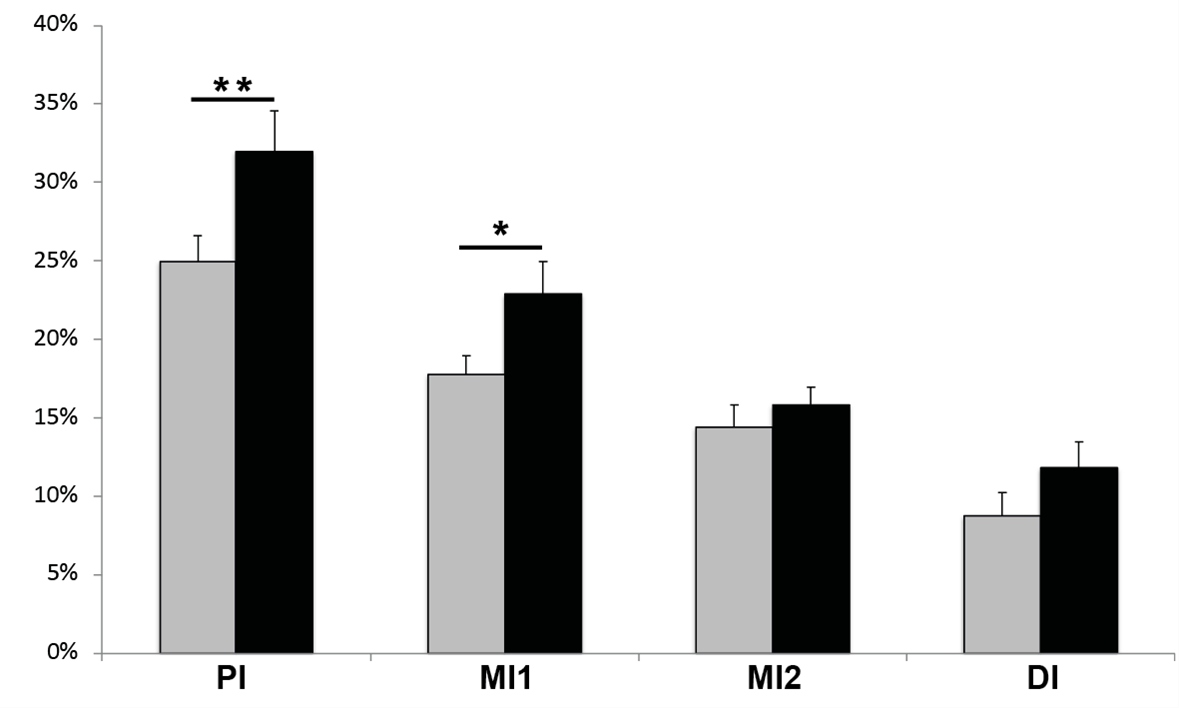
Wholemount immunolabeling of GI tissue using the simultaneous detection of Hu and 5-HT antibodies, revealed serotonergic immunoreactivity in both neuronal cell bodies and nerve fibers (Figure 2). The same trend was observed for both CNTL and DIO fish: the proportion of 5-HT/Hu neurons decreased along the length of the intestine (Table 5). Compared to the CNTL group, DIO fish displayed a significant increase in the proportion of 5-HT-neurons in the PI and MI1, but only a non-significant tendency in increase in the MI2 and the DI (Figure 3). This difference was probably due to the discrete imbalance between a decrease in the absolute numbers of Hu-positive neurons per frame counted in the PI and MI1 (but not in the MI2 or DI) and unchanged numbers of 5HT-positive neurons per frame for all intestinal regions (Table 5).
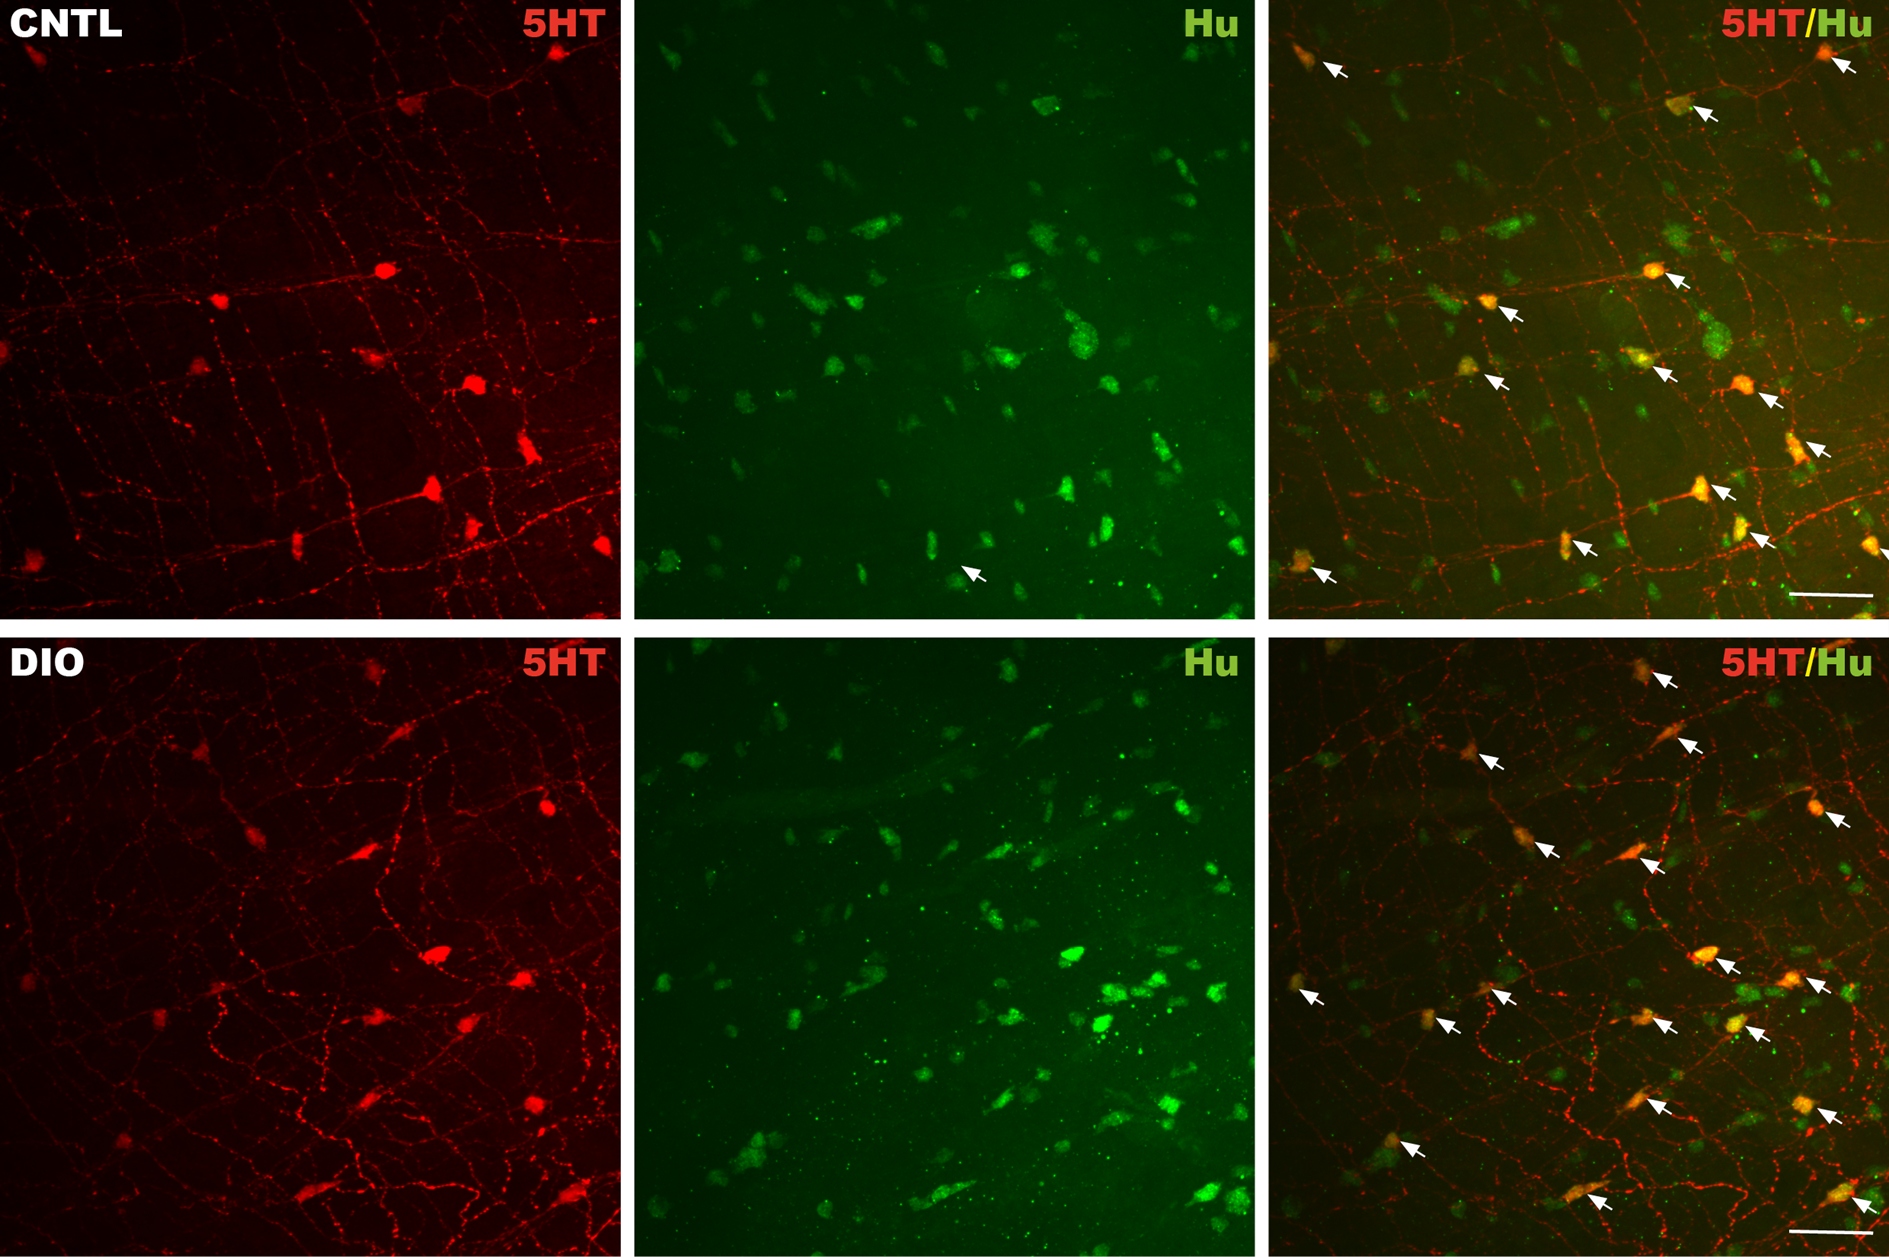
Figure 2: Confocal images showing the expression of 5-HT (red) and the neuronal marker Hu (green) in the PI of control (CNTL, upper panel) and diet-induced obese (DIO, lower panel) zebrafish intestine. 5-HT colocalizes with enteric neurons (merge, arrows) revealing the 5-HT positive neurons. Scale bar = 50 μm.
| PI | MI1 | MI2 | DI | |||||
|---|---|---|---|---|---|---|---|---|
| CNTL | DIO | CNTL | DIO | CNTL | DIO | CNTL | DIO | |
| % 5-HT/Hu | 25 ± 5 | 32 ± 9 | 18 ± 4 | 23 ± 7 | 14 ± 5 | 16 ± 4 | 9 ± 4 | 12 ± 5 |
| # 5-HT cells | 9.6 ± 2.6 | 9.9 ± 3.0 | 9.3 ± 2.5 | 8.7 ± 2.6 | 7.8 ± 2.5 | 7.6 ± 2.4 | 5.6 ± 2.9 | 8.1 ± 3.5 |
| # Hu cells | 40.6 ± 15.2 | 33.5 ± 12.0 | 56.4 ± 18.5 | 43.6 ± 12.4 | 54.7 ± 13.0 | 49.9 ± 14.2 | 63.3 ± 11.4 | 66.7 ± 14.5 |
Abbreviations: 5-HT: Serotonin; CNTL: Control; DI: Distal Intestine; DIO: Diet-Induced Obesity; MI1: Mid Intestine part 1; MI2: Mid Intestine part 2; PI: Proximal Intestine
Table 5: Serotonergic neurons. Data are means ± SD on the proportions of 5-HT/Hu positive cells and the absolute number of 5-HT cells and Hu cells counted per frame for the different intestinal regions for both control (CNTL) and diet-induced obese (DIO) zebrafish.
Expression data
qPCR data revealed that the expression levels of the nonneuronal tph1a and tph1b were different for brain and intestinal tissue. Efficiency levels and fluorescent occurrence showed normal levels of tph1a in brain and for tph1b in GI tract. However, efficiency measurements showed off-values and low expression levels for tph1a and tph1b in intestinal and brain tissue, respectively. Target expression analysis of thp1a and 1b between CNTL and DIO did not show significant differences (Figure 4). On the other hand, a significant increase in tph2 expression was observed in both brain and GI tract of DIO animals compared to CNTL fish (Figure 4).
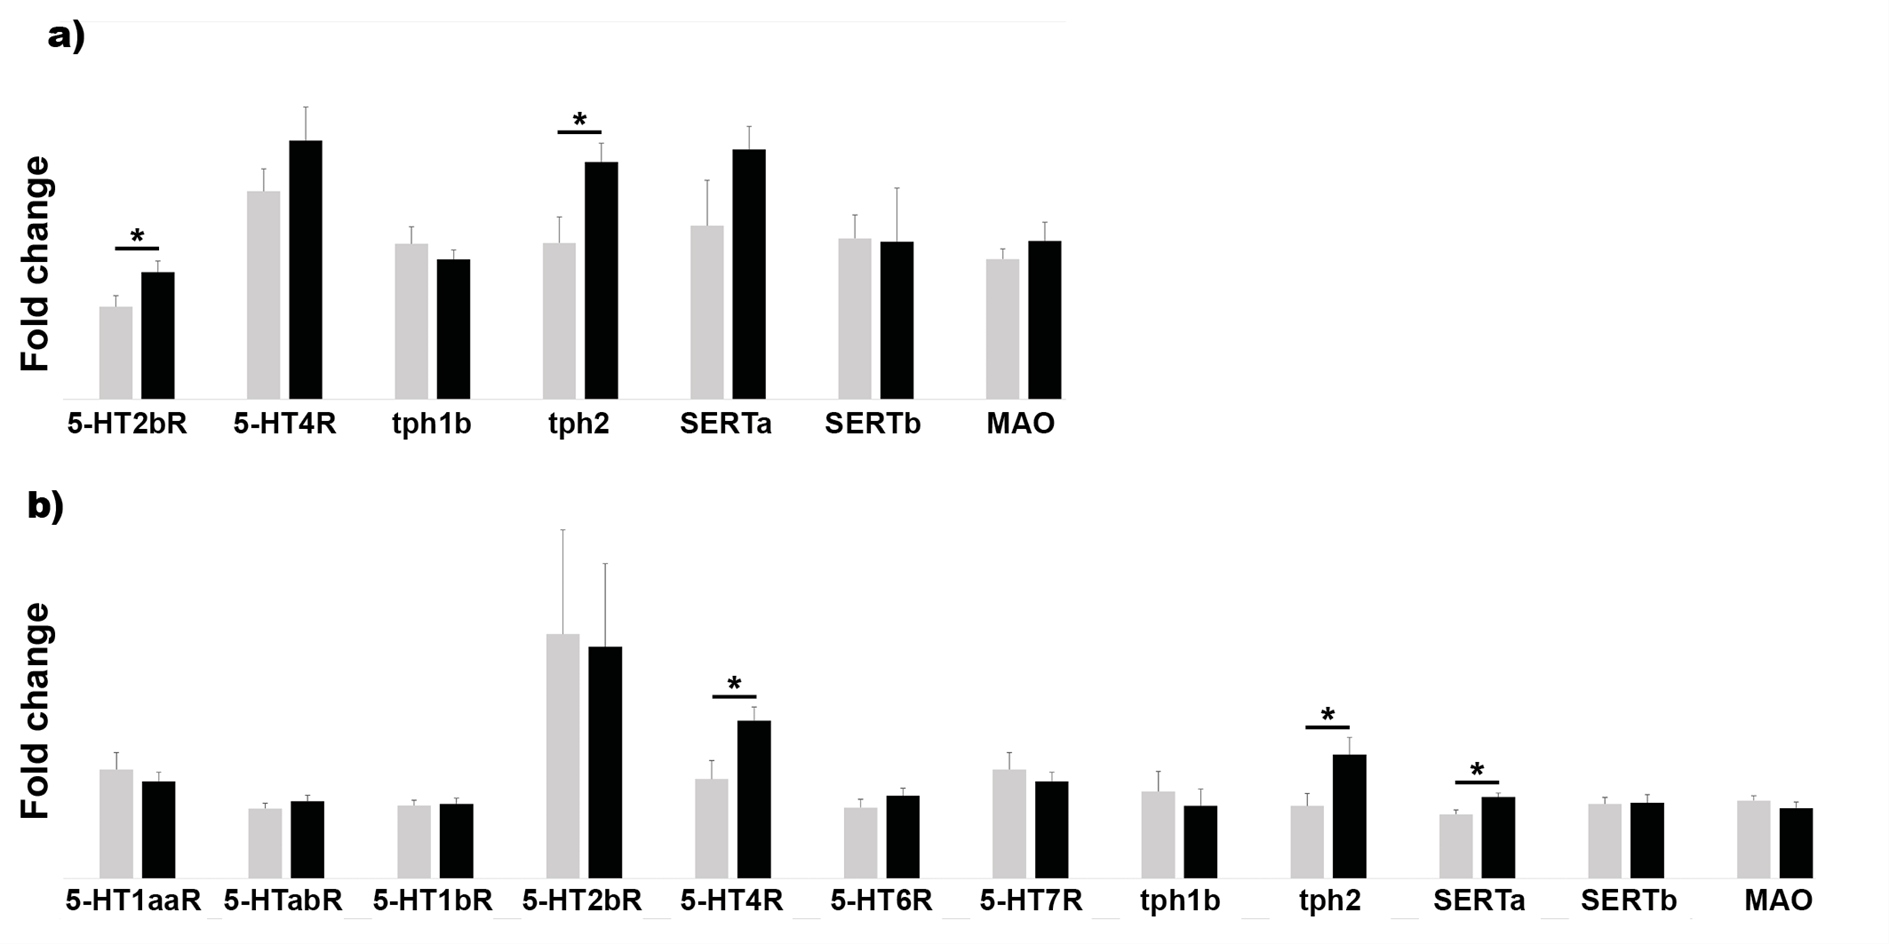
Figure 4: Mean fold change expression data after target analysis for GI tissue (a) and brain (b) in both control (CNTL, grey bars) and dietinduced obese (DIO, black bars). Data were calculated as the mean expression levels normalized to RPL13a and EF1a for GI tissue and to B2M and EF1a for brain tissue ± SEM. Targets include 5-HT receptors 1aa (5-HT1aaR), 1ab (5-HT1abR), 1b (5-HT1bR), 2b (5-HT2bR), 4 (5-HT4R), 6 (5-HT6R) and 7 (5-HTR7R), tryptophan hydroxylases isoforms 1a, 1b and 2 (tph1a, tph1b and tph2), two 5-HT transporters isoforms SERTa and b, and monoamine oxidase (MAO). * p-value<0.05.
Of all the receptors investigated in the intestine, only primers for 5-HT2bR and 5-HT4R turned out to be efficient. Furthermore, 5-HT2bR was significantly upregulated in the GI tract of the DIO group compared to the CNTL group (Figure 4a). The other targets did not show significant differences.
In the brain, a larger scale of receptors was evaluated for target analyses due to acceptable efficiency levels. Comparison between CNTL and DIO revealed elevated expression levels of 5-HT4R (Figure 4b). Also, SERTa showed an upregulation in the brain (Figure 4b). The other targets did not show any changes in expression in the brain between CNTL and DIO fish.
GI motility
While the GC did not differ for gavaging with glass beads (Figure 5a), it did after feeding fluorescent food (Figure 5b). After 3 hours the GC was significantly increased in DIO fish compared to CNTL fish (4.06 ± 1.35 vs. 3.33 ± 0.84, p=0.02). Also, the transit time was significantly higher in DIO fish than in CNTL fish (5.87mm/h ± 0.40 vs. 4.67 ± 0.29mm/h, p=0.01).
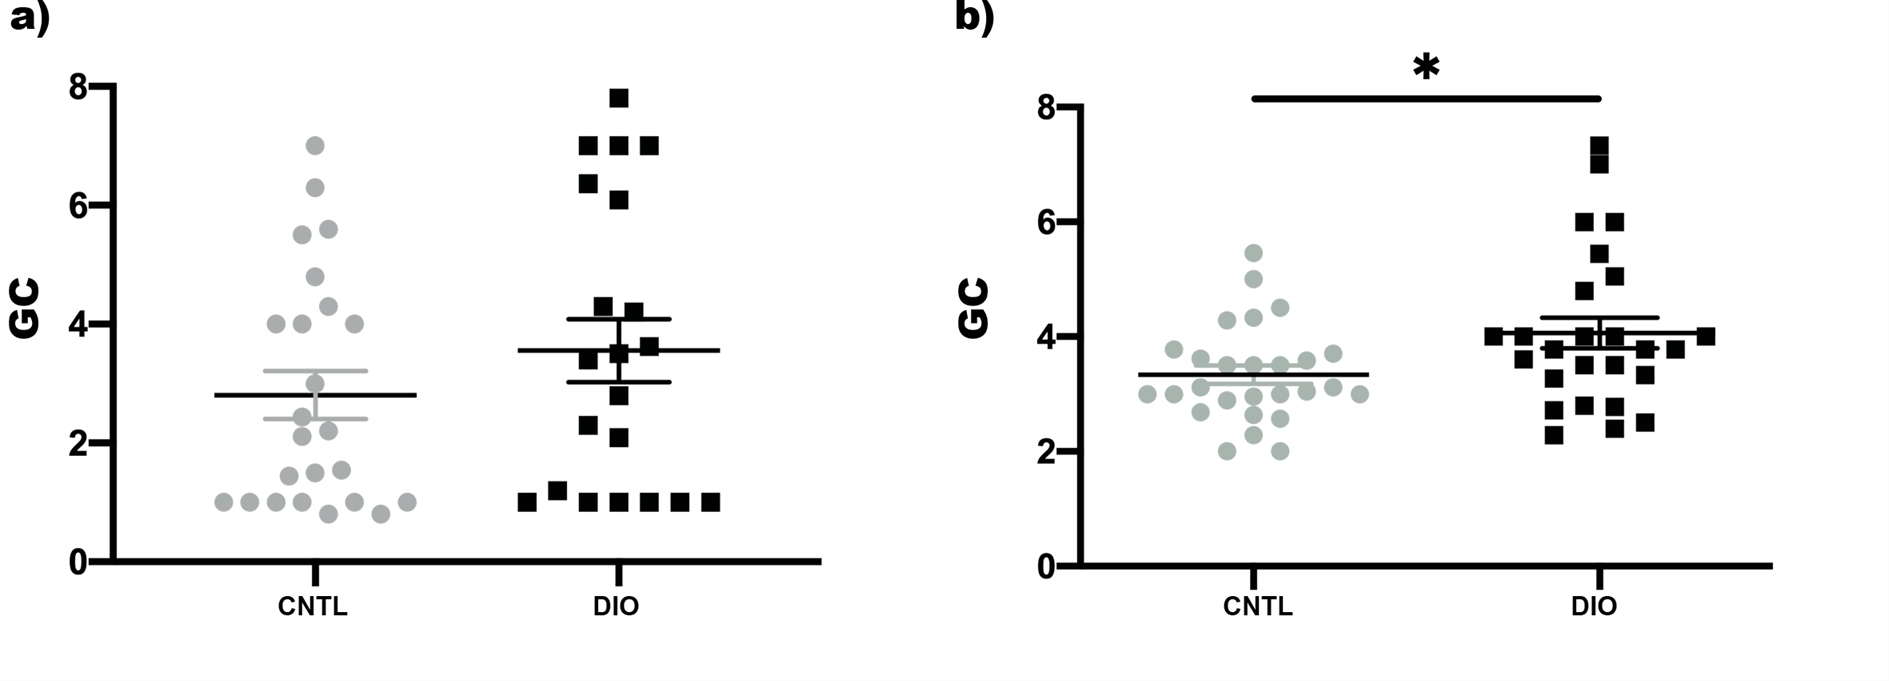
Figure 5: Scatter plots for the mean geometric centre (GC) in control (CNTL, grey) and diet induced obese fish (DIO, black) a) after gavaging glass beads and b) feeding fluorescent food. * p-value<0.05.
Swim behavior
Individual analysis of swim speed revealed a small, though not significant decrease in swim speed over time for both CNTL and DIO fish (Figure 6a). Comparison between CNTL and DIO fish did not yield significant differences. Both CNTL and DIO fish showed preference for the low swim zone. No differences in preferential area were observed (Figure 6b). Accordingly, the average shoal swim speed did not differ either in time, or between groups (Figure 6c).
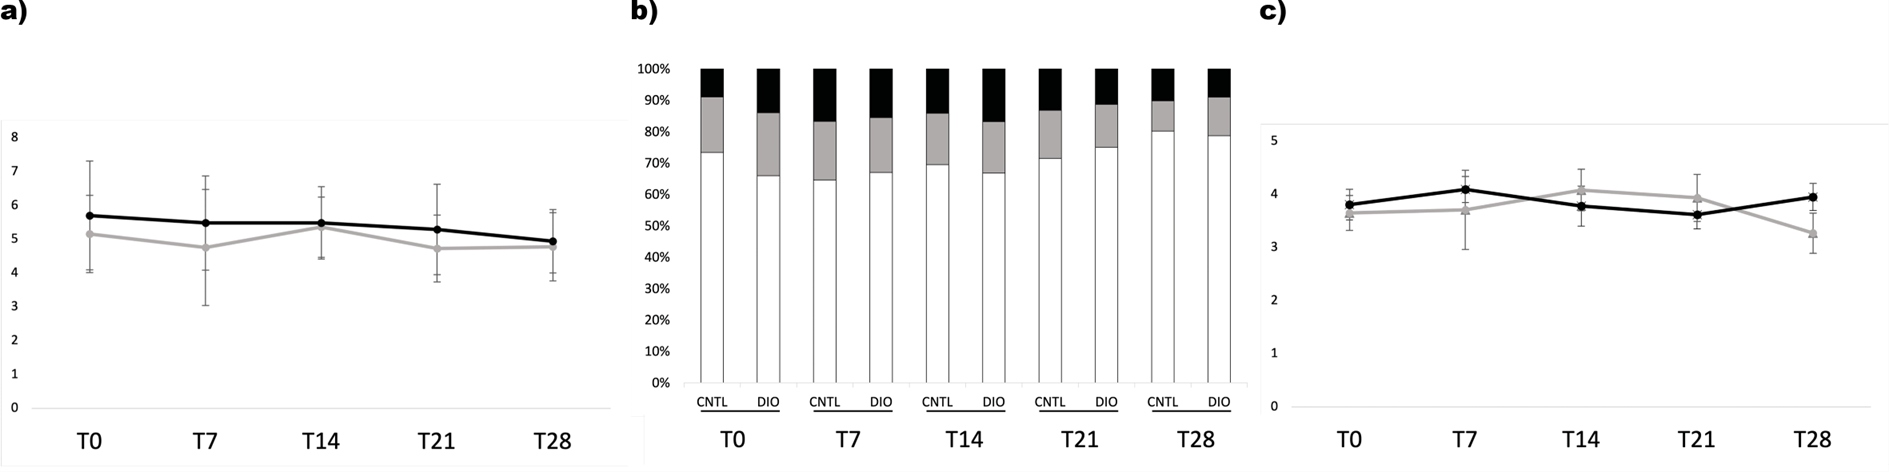
Figure 6: The different behavioral parameters investigated at the different points in time (T0 up to T28) for both control (CNTL) and overfed fish (DIO). a) Average swim speed (cm/s) for CNTL (grey line) and DIO (black line) fish. The values are calculated as mean swim speed per fish ± SD. b) Graphic overview of the mean preferential individual zone for the CNTL and DIO fish over time. The zones include low (white bars), middle (grey bars) and upper (black bars) swimming zones. Data are calculated as the average time spent in a specific zone per fish.c) Average swim speed (cm/s) in shoaling setup for control (grey line) and DIO (black line) fish. The values are calculated as mean shoaling swim speed ± SD.
Discussion
This study describes an easy, standardized method to obtain DIO zebrafish within 4 weeks, and demonstrates the effect of DIO on different key elements of 5-HT metabolism in zebrafish, more specifically in the GI tract.
Zebrafish are extensively used in obesity research (for review see [53]). The present study shows that only after 4 weeks a significant increase in body length, weight and BMI are obtained together with changes in the 5-HT availability. However, some limitations should be taken into consideration. The age of the fish is relevant; fish older than 5 months prove to be less suitable in that their growth curve is less pronounced, and they are also less prone to overeating and thus obtaining obesity-like features. As such, zebrafish have a lower translational value compared to mice and rat. On the other hand, zebrafish models for obesity also have several major advantages. First, the wide range of techniques available to obtain obese zebrafish, to image them and to manipulate their genes are key to the success of this animal model. In addition, the metabolic organs and tissues of zebrafish show to share important physiological and anatomical similarities to mammalian species [40]. Moreover, the main molecular and metabolic pathways, including the 5-HT pathway, involved in obesity are conserved in zebrafish [33,35-39].
Peripheral 5-HT has been recently linked to metabolic disorders including obesity [54-57]. Animal DIO models display increased peripheral 5-HT levels [58-60]. Also, in humans, obesity is associated with an increased capacity to produce and release 5-HT in the intestine [61]. Studies of plasma levels in obese individuals show a dysregulation of the 5-HT pathways with sometimes increased levels [62] and sometimes decreased levels [63-65].
The immunohistochemical data of our study reveal an increase in 5-HT-expressing neurons in the PI and MI of DIO zebrafish compared to CNTL fish. While enterochromaffin cells are the main peripheral source of 5-HT in mammals, in zebrafish 5-HT is predominantly produced in enteric neurons [45]. The observed decrease in the number of neurons per counting frame can be explained by the fact that the average intestinal surface increases with about 30%, and most of the 5-HT/Hu cells is seen in the PI followed by the MI1. Considering that the average intestinal surface increases with about 30%, and the gross of 5-HT/Hu cells is seen in the PI followed by the MI1, the corresponding decrease in the number of neurons per counting frame is explained. Given the fact that the serotonergic neuronal number remains nearly the same in these areas, the proportional increase of 5-HT expressing neurons is of importance.
This increase in expression is supported by an upregulation of the neuron-specific tph2 in the GI tract. In zebrafish 5-HT is presumed to be expressed in motor or secretomotor neurons [45]. A previous study in adult zebrafish demonstrated tph2 expression in the epiphysis and the raphe nuclei [66]. Data on the expression of tph2 in the peripheral (enteric) neurons are lacking to date. As far as tph1 is concerned, our data do not show any effect of DIO on the expression of tph1a (brain) or 1b (GI tract), which is in accordance with previous studies demonstrating tph1a expression predominantly in brain nuclei and tph1b expression in the oral and pharyngeal epithelium at the embryonic stage [66,67]. Target analysis did not reveal significant differences in mRNA levels for tph1a nor tph1b in brain or GI tract, respectively. The reuptake of 5-HT by SERTa and SERTb and the catabolization by MAO does not seem to be affected after DIO in the gut. Furthermore, a significant upregulation for SERTa, but not for SERTb, was observed in the brain, which is in line with the elevated expression levels and activity of SERT seen in DIO rats [68,69]. In humans, PET analysis revealed a positive correlation between BMI and SERT in the thalamus, but not in the midbrain [70]. A previous study by Norton and colleagues in zebrafish brain reported that SERTb is used for re-uptake in cells in which 5-HT is synthesized by tph1, and SERTa in cells were tph2 is synthesizing 5-HT, which may explain the elevated SERTa as shown in this study [37].
Although many more receptors are found to be involved in obesity [30,68,71-73], our data only shows increased mRNA levels for 5-HT2bR in the GI tract and for 5-HT4R in the brain. 5-HT2bR is expressed in different mammalian central and peripheral tissues including 5-HT-negative enteric neurons and interstitial cells of Cajal (ICCs) of the GI tract as well as white adipose tissue [74-77]. In zebrafish, the expression of 5-HT2bR has only been demonstrated in brain tissue to date [78]. Functionally, 5-HT2bR mediates contraction of GI smooth muscle cells [79,80]. In diabetic mice, activation of the 5-HT2bR improves colonic motility [77]. Increased expression of the 5-HT2bR has been reported in white adipose tissue of overfed mice and obese individuals [71]. Inhibition of the receptor leads to an improved outcome of obesity related metabolic dysfunctions, like insulin resistance [71].
5-HT4R is equally expressed throughout the body of mammals, including the myenteric plexus, the hippocampus and limbic system and is associated with mood and reward circuitries in these regions [81]. Expression data of this receptor in zebrafish are lacking up to now. Increased 5-HT4R levels were found in obese individuals and overfed rat [82,83]. In mice, injection of a 5-HT4R agonist in the limbic system reduced hyperphagia, while a 5-HT4R antagonist or knockdown of this receptor resulted in the opposite effect in fed mice [84], as such forming a protective mechanism towards overeating.
While the increased GI motility might be partly explained by an increased availability of peripheral 5-HT and an upregulation of the 5-HT2B receptor, the complete picture is more complex. GI dysmotility seems to be a symptom in both obese individuals and obesity animal models, showing conflicting results with either increased and decreased motility [85-94]. Our study shows increased GI motility, but only when using an adapted protocol with fluorescent labeled food. Gavaging glass beads does not reveal a difference in motility, which is probably due to the fact that anesthesia is applied in this procedure, as a result of which the glass beads themselves are alienated to the normal GI lumen [95]. Normal GI motility requires a sophisticated balance between the different GI components: e.g., enteric neurons and their content, glial cells and ICCs. Neuroplasticity due to high fat diet is one of the mechanisms underlying this altered motility. Furthermore, obesity-related inflammation might also play a role in the altered GI motility and 5-HT expression [96], as suggested by the results of a previous study in zebrafish in which neuroplasticity was demonstrated upon inflammation with increased proportions of serotonergic neurons [97]. Taken together, the effect seen in this study might be secondary to the diet, after inflammation. To get a full idea on the effect of DIO on 5-HT in the GI tract, it is necessary to further explore the expression of the different receptors using molecular techniques and immunohistochemical methods including imaging. Although our zebrafish model shows some promising results, some experimental and physical limitations should be considered as well. One should be cautious with the differential mode of 5-HT expression when extrapolating data to mammalian model organisms.
In conclusion, our study is consistent with previous studies showing 5-HT is involved in obesity. We show the effects of DIO on several key elements in the 5-HT pathway and report increased availability of 5-HT in the gut leading to increased 5-HT2bR and increased GI transit. Although an increased production of 5-HT is expected to coincide increased 5-HT4R levels in the brain, no gross swim behavioral changes were observed. Our observations are in line with the results of other studies performed in animal models of obesity, pointing to the relevance of this model for future obesity research.
Conflicts of Interest
No conflicts of interest.
Funding Statement
None.
Acknowledgements
The authors would like to thank Jan De Smedt, Dominique de Rijck, Els Goeman, Lindsay Jongman, Veerle Wijtvliet and Martine van Geel for their administrative and technical assistance.
References
2. Ng M, Fleming T, Robinson M, Thomson B, Graetz N, Margono C, et al. Global, regional, and national prevalence of overweight and obesity in children and adults during 1980–2013: a systematic analysis for the Global Burden of Disease Study 2013. The Lancet. 2014 Aug 30;384(9945):766-81.
3. Kopelman PG. Obesity as a medical problem. Nature. 2000 Apr;404(6778):635-43.
4. McAllister EJ, Dhurandhar NV, Keith SW, Aronne LJ, Barger J, Baskin M, et al. Ten putative contributors to the obesity epidemic. Critical Reviews in Food Science and Nutrition. 2009 Dec 10;49(10):868-913.
5. Guh DP, Zhang W, Bansback N, Amarsi Z, Birmingham CL Anis AH. The incidence of co-morbidities related to obesity and overweight: a systematic review and meta-analysis. BMC Public Health. 2009 Dec;9(1):1-20.
6. Al Mushref M, Srinivasan S. Effect of high fat-diet and obesity on gastrointestinal motility. Annals of Translational Medicine. 2013 Jul;1(2):p. 14.
7. Eslick GD. Gastrointestinal symptoms and obesity: a metaanalysis. Obesity Reviews. 2012 May;13(5):469-79.
8. Eslick GD, Talley NJ. Prevalence and relationship between gastrointestinal symptoms among individuals of different body mass index: a population-based study. Obesity Research & Clinical Practice. 2016 Mar 1;10(2):143-50.
9. Grudell AB, Camilleri M. The role of peptide YY in integrative gut physiology and potential role in obesity. Current Opinion in Endocrinology, Diabetes and Obesity. 2007 Feb 1;14(1):52-7.
10. Mohammad-Zadeh LF, Moses L, Gwaltney-Brant SM. Serotonin: a review. Journal of Veterinary Pharmacology and Therapeutics. 2008 Jun;31(3):187-99.
11. Gershon MD. serotonin receptors and transporters-roles in normal and abnormal gastrointestinal motility. Alimentary Pharmacology & Therapeutics. 2004 Nov;20:3-14.
12. Erspamer V, Testini A. Observations on the release and turnover rate of 5-hydroxytryptamine in the gastrointestinal tract. Journal of Pharmacy and Pharmacology. 1959 Sep;11(1):618-23.
13. Dahlström A, Fuxe K. Localization of monoamines in the lower brain stem. Experientia. 1964 Jul;20(7):398-9.
14. Peroutka SJ. Phylogenetic tree analysis of G proteincoupled 5-HT receptors: implications for receptor nomenclature. Neuropharmacology. 1992 Jul 1;31(7):609-13.
15. Saudou F, Hen R. 5-Hydroxytryptamine receptor subtypes in vertebrates and invertebrates. Neurochemistry International. 1994 Dec 1;25(6):503-32.
16. Derkach V, Surprenant A, North RA. 5-HT3 receptors are membrane ion channels. Nature. 1989 Jun;339(6227):706-9.
17. Peroutka SJ, Howell TA. The molecular evolution of G proteincoupled receptors: focus on 5-hydroxytryptamine receptors. Neuropharmacology. 1994 Mar 1;33(3-4):319-24.
18. Sargent BJ, Henderson AJ. Targeting 5-HT receptors for the treatment of obesity. Current Opinion in Pharmacology. 2011 Feb 1;11(1):52-8.
19. Gershon MD, Wade PR, Kirchgessner AL, Tamir H. 5-HT receptor subtypes outside the central nervous system. Roles in the physiology of the gut. Neuropsychopharmacology: official publication of the American College of Neuropsychopharmacology. 1990 Oct 1;3(5-6):385-95.
20. Keszthelyi D, Troost FJ, Masclee AA. Understanding the role of tryptophan and serotonin metabolism in gastrointestinal function. Neurogastroenterology & Motility. 2009 Dec;21(12):1239-49.
21. Gershon MD, Tack J. The serotonin signaling system: from basic understanding to drug development for functional GI disorders. Gastroenterology. 2007 Jan 1;132(1):397-414.
22. Wade PR, Chen J, Jaffe B, Kassem IS, Blakely RD, Gershon MD. Localization and function of a 5-HT transporter in crypt epithelia of the gastrointestinal tract. Journal of Neuroscience. 1996 Apr 1;16(7):2352-64.
23. Lee SH, Paz-Filho G, Mastronardi C, Licinio J, Wong ML. Is increased antidepressant exposure a contributory factor to the obesity pandemic?. Translational psychiatry. 2016 Mar;6(3):e759-.
24. Serretti A, Mandelli L, Laura M. Antidepressants and body weight: a comprehensive review and meta-analysis. The Journal of Clinical Psychiatry. 2010 Oct 15;71(10): p.1259-72.
25. Nakatani Y, Sato-Suzuki I, Tsujino N, Nakasato A, Seki Y, Fumoto M, et al. Augmented brain 5-HT crosses the blood–brain barrier through the 5-HT transporter in rat. European Journal of Neuroscience. 2008 May;27(9):2466-72.
26. Côté F, Thévenot E, Fligny C, Fromes Y, Darmon M, Ripoche MA, et al. Disruption of the nonneuronal tph1 gene demonstrates the importance of peripheral serotonin in cardiac function. Proceedings of the National Academy of Sciences. 2003 Nov 11;100(23):13525-30.
27. Walther DJ, Bader M. A unique central tryptophan hydroxylase isoform. Biochemical Pharmacology. 2003 Nov 1;66(9):1673-80.
28. Zhang X, Beaulieu JM, Sotnikova TD, Gainetdinov RR, Caron MG. Tryptophan hydroxylase-2 controls brain serotonin synthesis. Science. 2004 Jul 9;305(5681): p.217
29. Voigt JP, Fink H. Serotonin controlling feeding and satiety. Behavioural Brain Research. 2015 Jan 15;277:14-31.
30. Kwak SH, Park BL, Kim H, German MS, Go MJ, Jung HS, et al. Association of variations in TPH1 and HTR2B with gestational weight gain and measures of obesity. Obesity. 2012 Jan;20(1):233-8.
31. Nguyen M, Yang E, Neelkantan N, Mikhaylova A, Arnold R, Poudel MK, et al. Developing ‘integrative’zebrafish models of behavioral and metabolic disorders. Behavioural Brain Research. 2013 Nov 1;256:172-87.
32. Zhao X, Pack M. Modeling intestinal disorders using zebrafish. Methods in Cell Biology. 2017 Jan 1;138:241-70.
33. Oka T, Nishimura Y, Zang L, Hirano M, Shimada Y, Wang Z, et al. Diet-induced obesity in zebrafish shares common pathophysiological pathways with mammalian obesity. BMC Physiology. 2010 Dec;10(1):p. 21.
34. Seth A, Stemple DL, Barroso I. The emerging use of zebrafish to model metabolic disease. Disease models & Mechanisms. 2013 Sep;6(5):1080-8.
35. Schlegel A, Stainier DY. Lessons from “lower” organisms: what worms, flies, and zebrafish can teach us about human energy metabolism. PLoS Genetics. 2007 Nov;3(11):e199.
36. Progatzky F, Sangha NJ, Yoshida N, McBrien M, Cheung J, Shia A, Scott J, Marchesi JR, Lamb JR, Bugeon L, Dallman MJ. Dietary cholesterol directly induces acute inflammasome-dependent intestinal inflammation. Nature communications. 2014 Dec 23;5(1):5864.
37. Norton WH, Folchert A, Bally-Cuif L. Comparative Analysis Of Serotonin Receptor (HTR1A/HTR1B Families) And Transporter (slc6a4a/b) Gene Expression In The Zebrafish Brain. Journal Of Comparative Neurology. 2008 Dec 1;511(4):521-42.
38. Ren G, Li S, Zhong H, Lin S. Zebrafish Tyrosine Hydroxylase 2 Gene Encodes Tryptophan Hydroxylase. Journal of Biological Chemistry. 2013 Aug 2;288(31):22451-9.
39. Wang Y, Takai R, Yoshioka H, Shirabe K. Characterization And Expression of Serotonin Transporter Genes in Zebrafish. The Tohoku Journal of Experimental Medicine. 2006;208(3):267-74.
40. Wallace KN, Pack M. Unique And Conserved Aspects of Gut Development in Zebrafish. Developmental Biology. 2003 Mar 1;255(1):12-29.
41. Holmberg A, Olsson C, Hennig GW. TTX-Sensitive And TTXInsensitive Control of Spontaneous Gut Motility in The Developing Zebrafish (Danio Rerio) Larvae. Journal of Experimental Biology. 2007 Mar 15;210(6):1084-91.
42. Ng AN, de Jong-Curtain TA, Mawdsley DJ, White SJ, Shin J, Appel B, et al. Formation of The Digestive System in Zebrafish: III. Intestinal Epithelium Morphogenesis. Developmental Biology. 2005 Oct 1;286(1):114-35.
43. Wallace KN, Akhter S, Smith EM, Lorent K, Pack M. Intestinal Growth And Differentiation in Zebrafish. Mechanisms of Development. 2005 Feb 1;122(2):157-73.
44. Pack M, Solnica-Krezel L, Malicki J, Neuhauss SC, Schier AF, Stemple DL, et al. Mutations Affecting Development Of Zebrafish Digestive Organs. Development. 1996 Dec 1;123(1):321-8.
45. Uyttebroek L, Shepherd IT, Harrisson F, Hubens G, Blust R, Timmermans JP, et al. Neurochemical Coding of Enteric Neurons in Adult And Embryonic Zebrafish (Danio Rerio). Journal of Comparative Neurology. 2010 Nov 1;518(21):4419-38.
46. Uyttebroek L, Shepherd IT, Hubens G, Timmermans JP, Van Nassauw L. Expression of Neuropeptides And Anoctamin 1 in The Embryonic And Adult Zebrafish Intestine, Revealing Neuronal Subpopulations And ICC-Like Cells. Cell And Tissue Research. 2013 Nov;354(2):355-70.
47. Matthews M, Trevarrow B, Matthews J. A Virtual Tour of The Guide For Zebrafish Users. Resource. 2002 Mar;31:34-40.
48. Pannevis MC, Earle KE. Maintenance Energy Requirement of Five Popular Species of Ornamental Fish. The Journal Of Nutrition. 1994 Dec 1;124(suppl_12):2616S-8S.
49. Bustin SA, Benes V, Garson JA, Hellemans J, Huggett J, Kubista M, et al. The MIQE Guidelines: Minimum Information for Publication of Quantitative Real-Time PCR Experiments. Clin Chem, 2009. 55(4): p. 611-22.
50. Ye, J., et al., Primer-BLAST: A Tool To Design Target-Specific Primers For Polymerase Chain Reaction. BMC Bioinformatics, 2012. 13: p. 134.
51. Field HA, Kelley KA, Martell L, Goldstein AM, Serluca FC. Analysis Of Gastrointestinal Physiology Using A Novel Intestinal Transit Assay In Zebrafish. Neurogastroenterology & Motility. 2009 Mar;21(3):304-12.
52. Miller MS, Galligan JJ, Burks TF. Accurate Measurement of Intestinal Transit in The Rat. Journal of Pharmacological Methods. 1981 Nov 1;6(3):211-7.
53. Zang L, Maddison LA, Chen W. Zebrafish as a Model for Obesity And Diabetes. Frontiers In Cell And Developmental Biology. 2018:91.
54. Barra NG, Kwon YH, Morrison KM, Steinberg GR, Wade MG, Khan WI, et al. Increased Gut Serotonin Production in Response To Bisphenol a Structural Analogues May Contribute To Their Obesogenic Effects. American Journal of Physiology- Endocrinology And Metabolism. 2022 May 16.
55. Crane JD, Palanivel R, Mottillo EP, Bujak AL, Wang H, Ford RJ, et al. Inhibiting Peripheral Serotonin Synthesis Reduces Obesity And Metabolic Dysfunction by Promoting Brown Adipose Tissue Thermogenesis. Nature Medicine. 2015 Feb;21(2):166-72.
56. Choi W, Namkung J, Hwang I, Kim H, Lim A, Park HJ, et al. Serotonin Signals Through a Gut-Liver Axis to Regulate Hepatic Steatosis. Nature Communications. 2018 Nov 16; 9(1):p. 4824.
57. Kassan A, Ait-Aissa K, Kassan M. Gut Microbiota Regulates the Sympathetic Nerve Activity and Peripheral Serotonin Through Hypothalamic MicroRNA-204 in Order to Increase the Browning of White Adipose Tissue in Obesity. Cureus. 2022 Feb 4;14(2).
58. Martin AM, Jones LA, Jessup CF, Sun EW, Keating DJ. Diet Differentially Regulates Enterochromaffin Cell Serotonin Content, Density And Nutrient Sensitivity in The Mouse Small And Large Intestine. Neurogastroenterology & Motility. 2020 Aug;32(8):e13869.
59. Kim HJ, Kim JH, Noh S, Hur HJ, Sung MJ, Hwang JT, et al. Metabolomic Analysis of Livers And Serum From High-Fat Diet Induced Obese Mice. Journal of Proteome Research. 2011 Feb 4;10(2):722-31.
60. Bertrand RL, Senadheera S, Markus I, Liu L, Howitt L, Chen H, et al. A Western Diet Increases Serotonin Availability in Rat Small Intestine. Endocrinology. 2011 Jan 1;152(1):36-47.
61. Young RL, Lumsden AL, Martin AM, Schober G, Pezos N, Thazhath SS, et al. Augmented Capacity for Peripheral Serotonin Release in Human Obesity. International Journal of Obesity. 2018 Nov;42(11):1880-9.
62. Lischka J, Schanzer A, Baumgartner M, de Gier C, Greber- Platzer S, Zeyda M. Tryptophan Metabolism is Associated with BMI and Adipose Tissue Mass and Linked to Metabolic Disease in Pediatric Obesity. Nutrients. 2022 Jan;14(2):286.
63. Binetti J, Bertran L, Riesco D, Aguilar C, Martínez S, Sabench F, et al. Deregulated Serotonin Pathway in Women with Morbid Obesity and NAFLD. Life. 2020 Oct;10(10):245.
64. Ritze Y, Schollenberger A, Hamze Sinno M, Bühler N, Böhle M, Bárdos G, et al. Gastric Ghrelin, GOAT, Leptin, and LeptinR Expression As Well As Peripheral Serotonin are Dysregulated in Humans with Obesity. Neurogastroenterology & Motility. 2016 Jun;28(6):806-15.
65. Hodge S, Bunting BP, Carr E, Strain JJ, Stewart-Knox BJ. Obesity, Whole Blood Serotonin and Sex Differences in Healthy Volunteers. Obesity Facts. 2012;5(3):399-407.
66. Lillesaar C, Tannhäuser B, Stigloher C, Kremmer E, Bally-Cuif L. The Serotonergic Phenotype is Acquired by Converging Genetic Mechanisms within the Zebrafish Central Nervous System. Developmental Dynamics: An Official Publication of The American Association of Anatomists. 2007 Apr;236(4):1072-84.
67. Kapsimali M, Kaushik AL, Gibon G, Dirian L, Ernest S, Rosa FM. Fgf Signalling Controls Pharyngeal Taste Bud Formation through Mir-200 and Delta-Notch Activity. Development. 2011 Aug 15;138(16):3473-84.
68. de Andrade Silva SC, da Silva AI, Braz GR, da Silva Pedroza AA, de Lemos MD, Sellitti DF, et al. Overfeeding During Development Induces Temporally-Dependent Changes in Areas Controlling Food Intake in The Brains of Male Wistar Rats. Life Sciences. 2021 Nov 15;285:119951.
69. Hersey M, Woodruff JL, Maxwell N, Sadek AT, Bykalo MK, Bain I, et al. High-Fat Diet Induces Neuroinflammation and Reduces the Serotonergic Response to Escitalopram in the Hippocampus of Obese Rats. Brain, Behavior, and Immunity. 2021 Aug 1;96:63-72.
70. Hesse S, van de Giessen E, Zientek F, Petroff D, Winter K, Dickson JC, et al. Association of Central Serotonin Transporter Availability and Body Mass Index in Healthy Europeans. European Neuropsychopharmacology. 2014 Aug 1;24(8):1240-7.
71. Choi WG, Choi W, Oh TJ, Cha HN, Hwang I, Lee YK, et al. Inhibiting serotonin signaling through HTR2B in visceral adipose tissue improves obesity-related insulin resistance. The Journal of Clinical Investigation. 2021 Dec 1;131(23).
72. Yoo ES, Li L, Jia L, Lord CC, Lee CE, Birnbaum SG, et al. Gαi/ocoupled Htr2c in the paraventricular nucleus of the hypothalamus antagonizes the anorectic effect of serotonin agents. Cell Reports. 2021 Nov 16;37(7):109997.
73. Yu B, Battaglia DM, Foster TP, Nichols CD. Serotonin 5-HT2A receptor activity mediates adipocyte differentiation through control of adipogenic gene expression. Scientific Reports. 2021 Oct 5;11(1):19714.
74. Bonhaus DW, Bach C, DeSouza A, Salazar FR, Matsuoka BD, Zuppan P, et al. The pharmacology and distribution of human 5-hydroxytryptamine2B (5-HT2B) receptor gene products: comparison with 5-HT2A and 5-HT2C receptors. British Journal of Pharmacology. 1995 Jun;115(4):622-8.
75. Fiorica-Howells E, Maroteaux L, Gershon MD. Serotonin and the 5-HT2B receptor in the development of enteric neurons. Journal of Neuroscience. 2000 Jan 1;20(1):294-305.
76. Okamoto T, Barton MJ, Hennig GW, Birch GC, Grainger N, Corrigan RD, et al. Extensive projections of myenteric serotonergic neurons suggest they comprise the central processing unit in the colon. Neurogastroenterology & Motility. 2014 Apr;26(4):556-70.
77. Jin B, Ha SE, Wei L, Singh R, Zogg H, Clemmensen B, et al. Colonic motility is improved by the activation of 5-HT2B receptors on interstitial cells of Cajal in diabetic mice. Gastroenterology. 2021 Aug 1;161(2):608-22.
78. Theodoridi A, Tsalafouta A, Pavlidis M. Acute exposure to fluoxetine alters aggressive behavior of zebrafish and expression of genes involved in serotonergic system regulation. Frontiers in Neuroscience. 2017 Apr 25;11:223.
79. Baxter GS, Murphy OE, Blackburn TP. Further characterization of 5-hydroxytryptamine receptors (putative 5-HT2B) in rat stomach fundus longitudinal muscle. British Journal of Pharmacology. 1994 May;112(1):323-31.
80. Javid FA, Afshin-Javid S, Horn CC. Further investigation of the effects of 5-hydroxytryptamine, 8-OH-DPAT and DOI to mediate contraction and relaxation responses in the intestine and emesis in Suncus murinus. European Journal of Pharmacology. 2018 Feb 15;821:79-87.
81. Rebholz H, Friedman E, Castello J. Alterations of expression of the serotonin 5-HT4 receptor in brain disorders. International Journal of Molecular Sciences. 2018 Nov;19(11):3581.
82. Haahr ME, Rasmussen PM, Madsen K, Marner L, Ratner C, Gillings N, et al. Obesity is associated with high serotonin 4 receptor availability in the brain reward circuitry. Neuroimage. 2012 Jul 16;61(4):884-8.
83. Ratner C, Ettrup A, Bueter M, Haahr ME, Compan V, Le Roux CW, et al. Cerebral Markers of the Serotonergic System in Rat Models of Obesity and After Roux-en-Y Gastric Bypass. Obesity. 2012 Oct;20(10):2133-41.
84. Jean A, Conductier G, Manrique C, Bouras C, Berta P, Hen R, et al. Anorexia induced by activation of serotonin 5-HT4 receptors is mediated by increases in CART in the nucleus accumbens. Proceedings of the National Academy of Sciences. 2007 Oct 9;104(41):16335-40.
85. Reichardt F, Baudry C, Gruber L, Mazzuoli G, Moriez R, Scherling C, et al. Properties of myenteric neurones and mucosal functions in the distal colon of diet-induced obese mice. The Journal of Physiology. 2013 Oct 15;591(20):5125-39.
86. Reichardt F, Chassaing B, Nezami BG, Li G, Tabatabavakili S, Mwangi S, et al. Western diet induces colonic nitrergic myenteric neuropathy and dysmotility in mice via saturated fatty acidand lipopolysaccharide-induced TLR4 signalling. The Journal of Physiology. 2017 Mar 1;595(5):1831-46.
87. Anitha M, Reichardt F, Tabatabavakili S, Nezami BG, Chassaing B, Mwangi S, et al. Intestinal dysbiosis contributes to the delayed gastrointestinal transit in high-fat diet fed mice. Cellular and Molecular Gastroenterology and Hepatology. 2016 May 1;2(3):328- 39.
88. Antonioli L, D'Antongiovanni V, Pellegrini C, Fornai M, Benvenuti L, di Carlo A, et al. Colonic dysmotility associated with high-fat diet-induced obesity: role of enteric glia. The FASEB Journal. 2020 Apr;34(4):5512-24.
89. Asakawa A, Inui A, Ueno N, Makino S, Uemoto M, Fujino MA, et al. Ob/ob mice as a model of delayed gastric emptying. Journal of Diabetes and Its Complications. 2003 Jan 1;17(1):27-8.
90. Li J, Ma W, Wang S. Slower gastric emptying in high-fat diet induced obese rats is associated with attenuated plasma ghrelin and elevated plasma leptin and cholecystokinin concentrations. Regulatory Peptides. 2011 Nov 10;171(1-3):53-7.
91. Gallagher TK, Baird AW, Winter DC. Constitutive basal and stimulated human small bowel contractility is enhanced in obesity. Annals of Surgical Innovation and Research. 2009 Apr 20;3:4.
92. Nyavor Y, Brands CR, May G, Kuther S, Nicholson J, Tiger K, et al. High-fat diet–induced alterations to gut microbiota and gut-derived lipoteichoic acid contributes to the development of enteric neuropathy. Neurogastroenterology & Motility. 2020 Jul;32(7):e13838.
93. Wan X, Yin J, Chen J. Characteristics of intestinal myoelectrical and motor activities in diet-induced obese rats: obesity and motility. Digestive Diseases and Sciences. 2019 Jun;64(6):1478-85.
94. vd Baan-Slootweg OH, Liem O, Bekkali N, van Aalderen WM, Rijcken TH, Di Lorenzo C, et al. Constipation and colonic transit times in children with morbid obesity. Journal of Pediatric Gastroenterology and Nutrition. 2011 Apr 1;52(4):442-5.
95. Nimmo WS. Effect of anaesthesia on gastric motility and emptying. British Journal of Anaesthesia. 1984 Jan 1;56(1):29-36.
96. Duan Y, Zeng L, Zheng C, Song B, Li F, Kong X, et al. Inflammatory links between high fat diets and diseases. Frontiers in Immunology. 2018:2649.
97. Uyttebroek L, Pype C, Hubens G, Timmermans JP, Van Nassauw L. Effect of TNBS-induced colitis on enteric neuronal subpopulations in adult zebrafish. European Journal of Histochemistry: EJH. 2020 Jul 1;64(3).