Abstract
Background: The availability and accessibility of Prosthetics and Orthotics (P&O) services in Ghana remain largely unquantified, with anecdotal evidence suggesting significant disparities between urban and rural areas.
Methods: A quantitative, cross-sectional geospatial design was utilized in this study using Geographic Information Systems (GIS) to map P&O service distribution. Data on regional population density and P&O facility locations were integrated. Spatial analysis in ArcGIS Pro 2.4 involved generating choropleth maps for population density, overlaying facility locations, and performing spatial joins to aggregate facility counts per region. Pearson correlation and linear regression analyses were conducted in SPSS 26.0 to assess the relationship between population density and P&O facility distribution.
Findings: The analysis revealed a concentrated distribution of P&O facilities in Ghana, predominantly in the southern and central regions, aligning with areas of higher population density. A strong, statistically significant positive correlation was found between regional population density and the distribution of P&O facilities (r = 0.74, p < 0.001). The linear regression model indicated that population density significantly predicts facility distribution, though it only explains 54% of the variability. This suggests that non-density factors, such as urban bias and historical economic investment, could play a substantial role in shaping the observed disparities.
Conclusion: This study provides evidence of the uneven geographic distribution of P&O services in Ghana, with a marked clustering in high-density southern regions and significant gaps in northern and less urbanized areas.
Keywords
Prosthetics and orthotics, Geographic Information Systems (GIS), Healthcare accessibility, Ghana, Spatial distribution
Introduction
Prosthetics and Orthotics (P&O) represent critical rehabilitative services that significantly enhance the mobility, functional independence, and overall quality of life for individuals living with physical disabilities [1]. Prosthetics involve the design, fabrication, and fitting of artificial limbs to replace missing body parts, while orthotics focus on the provision of external devices that support, align, prevent, or correct musculoskeletal deformities and improve the function of movable parts of the body [2,3]. In low- and middle–income countries (LMICs), the demand for these essential services is disproportionately high, driven by a complex interplay of factors including the prevalence of road traffic accidents, complications from non-communicable diseases such as diabetes leading to amputations, congenital anomalies, and, in some contexts, the lingering effects of conflict [4,5]. Despite this substantial and often escalating need, the provision of P&O services in these regions frequently remains inadequate, characterized by systemic barriers to availability and accessibility, particularly for populations residing in rural and underserved areas [6,7].
In Ghana, a West African nation with a population exceeding 30 million, the need for robust P&O services is underscored by a growing burden of disability attributed to factors such as the high incidence of road traffic accidents, the rising prevalence of diabetes-related amputations, and the ongoing challenge of congenital conditions requiring early intervention [8–10]. Despite this pressing national need, the precise geographical distribution and actual availability of P&O services across the country remain largely unquantified. Literature evidences have consistently suggested profound disparities in service availability, with urban centres seemingly better resourced and accessible compared to vast rural hinterlands [9,11]. However, a comprehensive, national–level spatial analysis to substantiate these observations and pinpoint specific gaps has been conspicuously absent from the scientific literature.
Geographic Information Systems (GIS) offer an exceptionally powerful and robust analytical framework for visualizing, analyzing, and interpreting spatial patterns in healthcare service distribution [12]. GIS, if adapted properly can enable researchers to precisely identify underserved areas and critically inform evidence-based strategies for improving service delivery by systematically mapping the precise locations of available P&O facilities and assessing crucial accessibility factors such as travel time and distance from population centres [13,14]. This methodology is particularly pertinent in contexts like Ghana, where resource allocation must be optimized to achieve equitable health outcomes.
Despite the transformative potential of geospatial mapping for healthcare planning, a critical gap exists in the comprehensive understanding of P&O service distribution and availability in Ghana. Previous research efforts in the country have largely focused on broader aspects of healthcare accessibility, availability or confined their scope to specific regions, without specifically addressing the specialized and distinct domain of P&O services at a national scale [15–18]. To the best of our knowledge, this study represents the inaugural comprehensive geospatial mapping and availability assessment of prosthetics and orthotics services across all the 16 administrative regions of Ghana. This pioneering study addresses a significant knowledge gap by systematically mapping the geographic distribution of P&O facilities across Ghana and analyzing their alignment with regional population densities. The primary objective is to identify underserved regions and highlight disparities in service availability, thereby informing targeted recommendations for more equitable access and national planning of P&O services.
Methodology
Study design
This study employed a quantitative, cross-sectional geospatial design using Geographic Information Systems (GIS) to map the distribution of Prosthetics and Orthotics (P&O) services across Ghana. It was conceptually designed to assess the alignment between service availability and regional population distribution, with the goal of identifying spatial disparities in service provision.
Study area
The study was conducted across all 16 administrative regions of Ghana. Ghana, a West African nation, covers a total land area of approximately 238,533 square kilometers and exhibits diverse geographical features and varying levels of urbanization and population distribution.
Data sources and collection
Multiple geospatial and statistical datasets were utilized. Regional population density data for Ghana were obtained from the Ghana Statistical Service (GSS), primarily based on the 2021 Population and Housing Census. This dataset provided detailed population counts aggregated at the regional level, which were then used to calculate population density (persons/km2) for each administrative region.
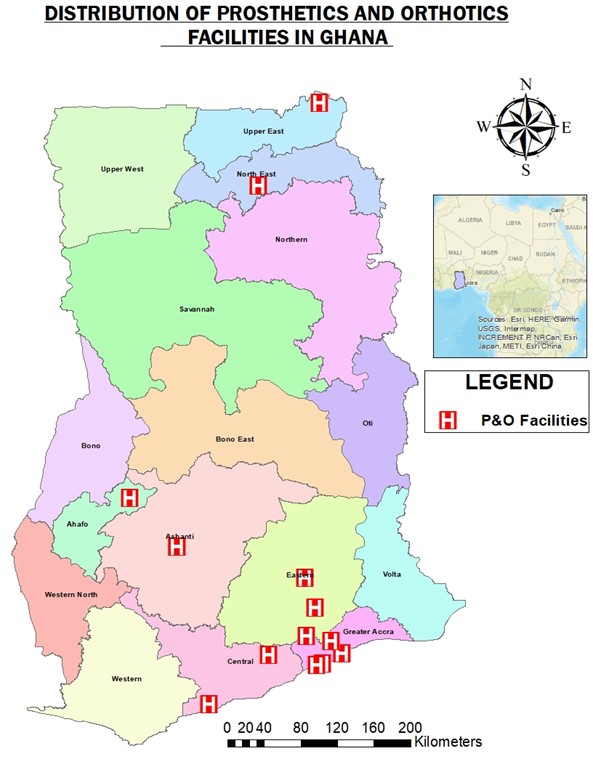
Locations of P&O facilities in Ghana were compiled through a multi-pronged approach. A master list of licensed facilities was obtained from the Ghana Association of Prosthetics and Orthotics (GhAPO) and the Allied Health Professions Council (AHPC). This list was cross-validated through institutional consultations with officials of GhAPO and AHPC, which maintain national oversight of licensed P&O facilities. A total of 14 licensed P&O facilities were identified nationwide as of June 2025. These facilities were distributed across 7 of Ghana’s 16 administrative regions. The regional distribution of identified licensed P&O facilities across Ghana is presented in Table 1. Geospatial coordinates (longitude and latitude) for each facility were captured using the Ghana Post GPS app (version 3.0). To ensure accuracy, the app’s coordinates were validated against those from a Trimble Geo 7X Handheld GNSS System, using known control points across diverse settings. The Ghana Post GPS app was confirmed to be sufficiently accurate for geospatial analysis in this context. The geographic coordinates (latitude and longitude) and facility count for all identified P&O service locations were collected between 15th April 2025 and 15th June 2025. Administrative boundary shapefiles were sourced from the Survey and Mapping Division of Ghana. These boundaries defined the regional units for geospatial mapping and analysis.
|
Region |
Number of Facilities |
|
Greater Accra |
4 |
|
Eastern |
3 |
|
Central |
2 |
|
Ashanti |
2 |
|
Ahafo |
1 |
|
Upper East |
1 |
|
North East |
1 |
|
Other 9 Regions |
0 |
Data processing and analysis
All spatial analyses were conducted in ArcGIS Pro 2.4 (Esri Inc., Redlands, CA, USA). Data layers, including administrative boundaries, population density, road networks, and P&O facility locations, were projected to a common coordinate system (WGS 1984 UTM Zone 30N) to ensure consistency and spatial alignment.
To visualize population distribution, choropleth maps were generated based on regional population densities derived from the 2021 Population and Housing Census. Regional population densities were classified using a quantile classification method in Esri ArcGIS Pro 2.4, which groups regions into classes containing an equal number of observations. Five quantile classes were generated to represent relative population density gradients across the country, ranging from very low to very high density. This approach was selected to facilitate comparative visualization across regions and to highlight relative disparities rather than absolute thresholds. The resulting classes were symbolized using a sequential color gradient, with lighter shades representing lower densities and progressively darker shades indicating higher densities. The spatial distribution of P&O facilities was then mapped by overlaying geocoded facility point data onto the regional administrative map. This allowed for visual identification of service clusters and underserved regions.
A spatial join was performed to aggregate the number of P&O facilities within each administrative region. This enabled a direct comparison between the number of facilities and the corresponding regional population densities. To statistically assess this relationship, Pearson correlation and linear regression analyses were conducted in SPSS (version 26.0, IBM Corp.), using regional population density and the total number of P&O facilities per region as the two variables. These tests evaluated the strength and significance of the association between demographic concentration and service availability.
Ethical considerations
This study used exclusively secondary and publicly available or anonymized data. No human subjects were involved; therefore, formal ethical review board approval was not required. Nonetheless, all data handling followed scientific standards of data protection and ethical integrity.
Results
This section presents the findings from the geospatial analysis, detailing the distribution patterns of population density and Prosthetics and Orthotics (P&O) service facilities across Ghana's regions, and examining their spatial relationship.
Population density distribution
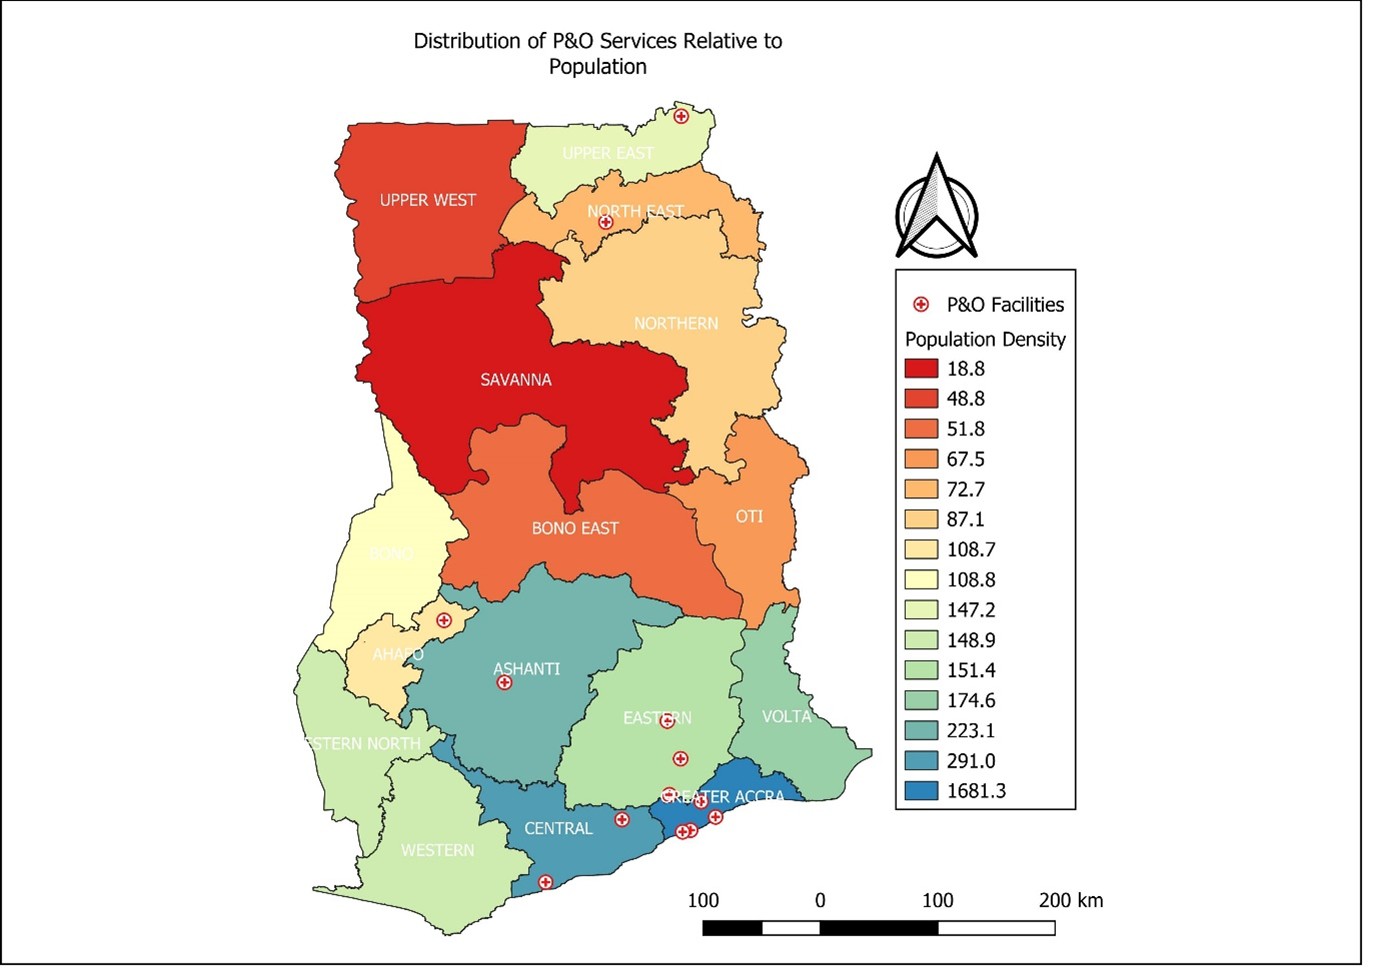
The analysis of population density across Ghana's regions reveals distinct patterns. Regions such as Savannah (18.78 persons/km²), and Bono East (51.76 persons per/km²), exhibited relatively low densities, while Greater Accra stood out with 1,681 persons/km². Upper West shows a density of approximately 48.79 persons per km². These areas are characterized by vast land areas and comparatively dispersed populations. Intermediate densities are found in regions like North East (72.65 persons/km²), Oti (67.53 persons/km²), Northern (87.13 persons/km²), Western North (87.4 persons/km²), Ahafo (108.7 persons/km²), and Bono (108.8 persons/km²), bridging the gap between sparsely populated and denser regions. In contrast, southern regions such as Eastern (151.4 persons/km²), Volta (174.6 persons/km²), Central (291 persons/km²), Ashanti (223.1 persons/km²), and Western (148.9 persons/km²), show notably higher population densities. The Greater Accra Region stands as a significant outlier, demonstrating an exceptionally high population density, approximating 1681 persons/km², which reflects its status as the most urbanized and densely populated area in the country.
Distribution of prosthetics and orthotics services
The spatial mapping of P&O facilities across Ghana revealed a concentrated distribution. A total number of 14 P&O facilities exist in Ghana as at June 2025. Out of the 16 administrative regions in Ghana, only 7 regions have P&O centers. A significant presence (n=12) of these facilities is predominantly observed in the southern and central parts of Ghana, specifically in Greater Accra (4 facilities), Eastern (3 facilities), Central (2 facilities), Ashanti (2 facilities), and Ahafo (1 facility). This concentration aligns with areas of higher general healthcare infrastructure and economic activity. Only two facilities are located in the northern section of Ghana (Upper East and North East), each with a single P&O facility. The geographic distribution of P&O facilities across Ghana is visually represented in Figure 1. As shown in Figure 1, P&O services cluster visibly in southern Ghana, leaving wide service gaps in the north. Consistent with its high population density and urban development, Greater Accra hosts the highest number of P&O facilities, serving as a major hub for these specialized services. Conversely, the regions (n=9), including Bono (0 facilities), Bono East (0 facilities), Northern (0 facilities), Oti (0 facilities), Savannah (0 facilities), Upper West (0 facilities), Volta (0 facilities), Western (0 facilities), and Western North (0 facilities), demonstrate a notable scarcity or complete absence of P&O facilities. This stark disparity is observed despite some of these regions having moderate population densities.
Spatial relationship between population density and P&O services
A notable spatial mismatch was observed across most regions of Ghana between population density and the availability of P&O services, further elucidated by quantitative analyses and visual representations (Figure 2).
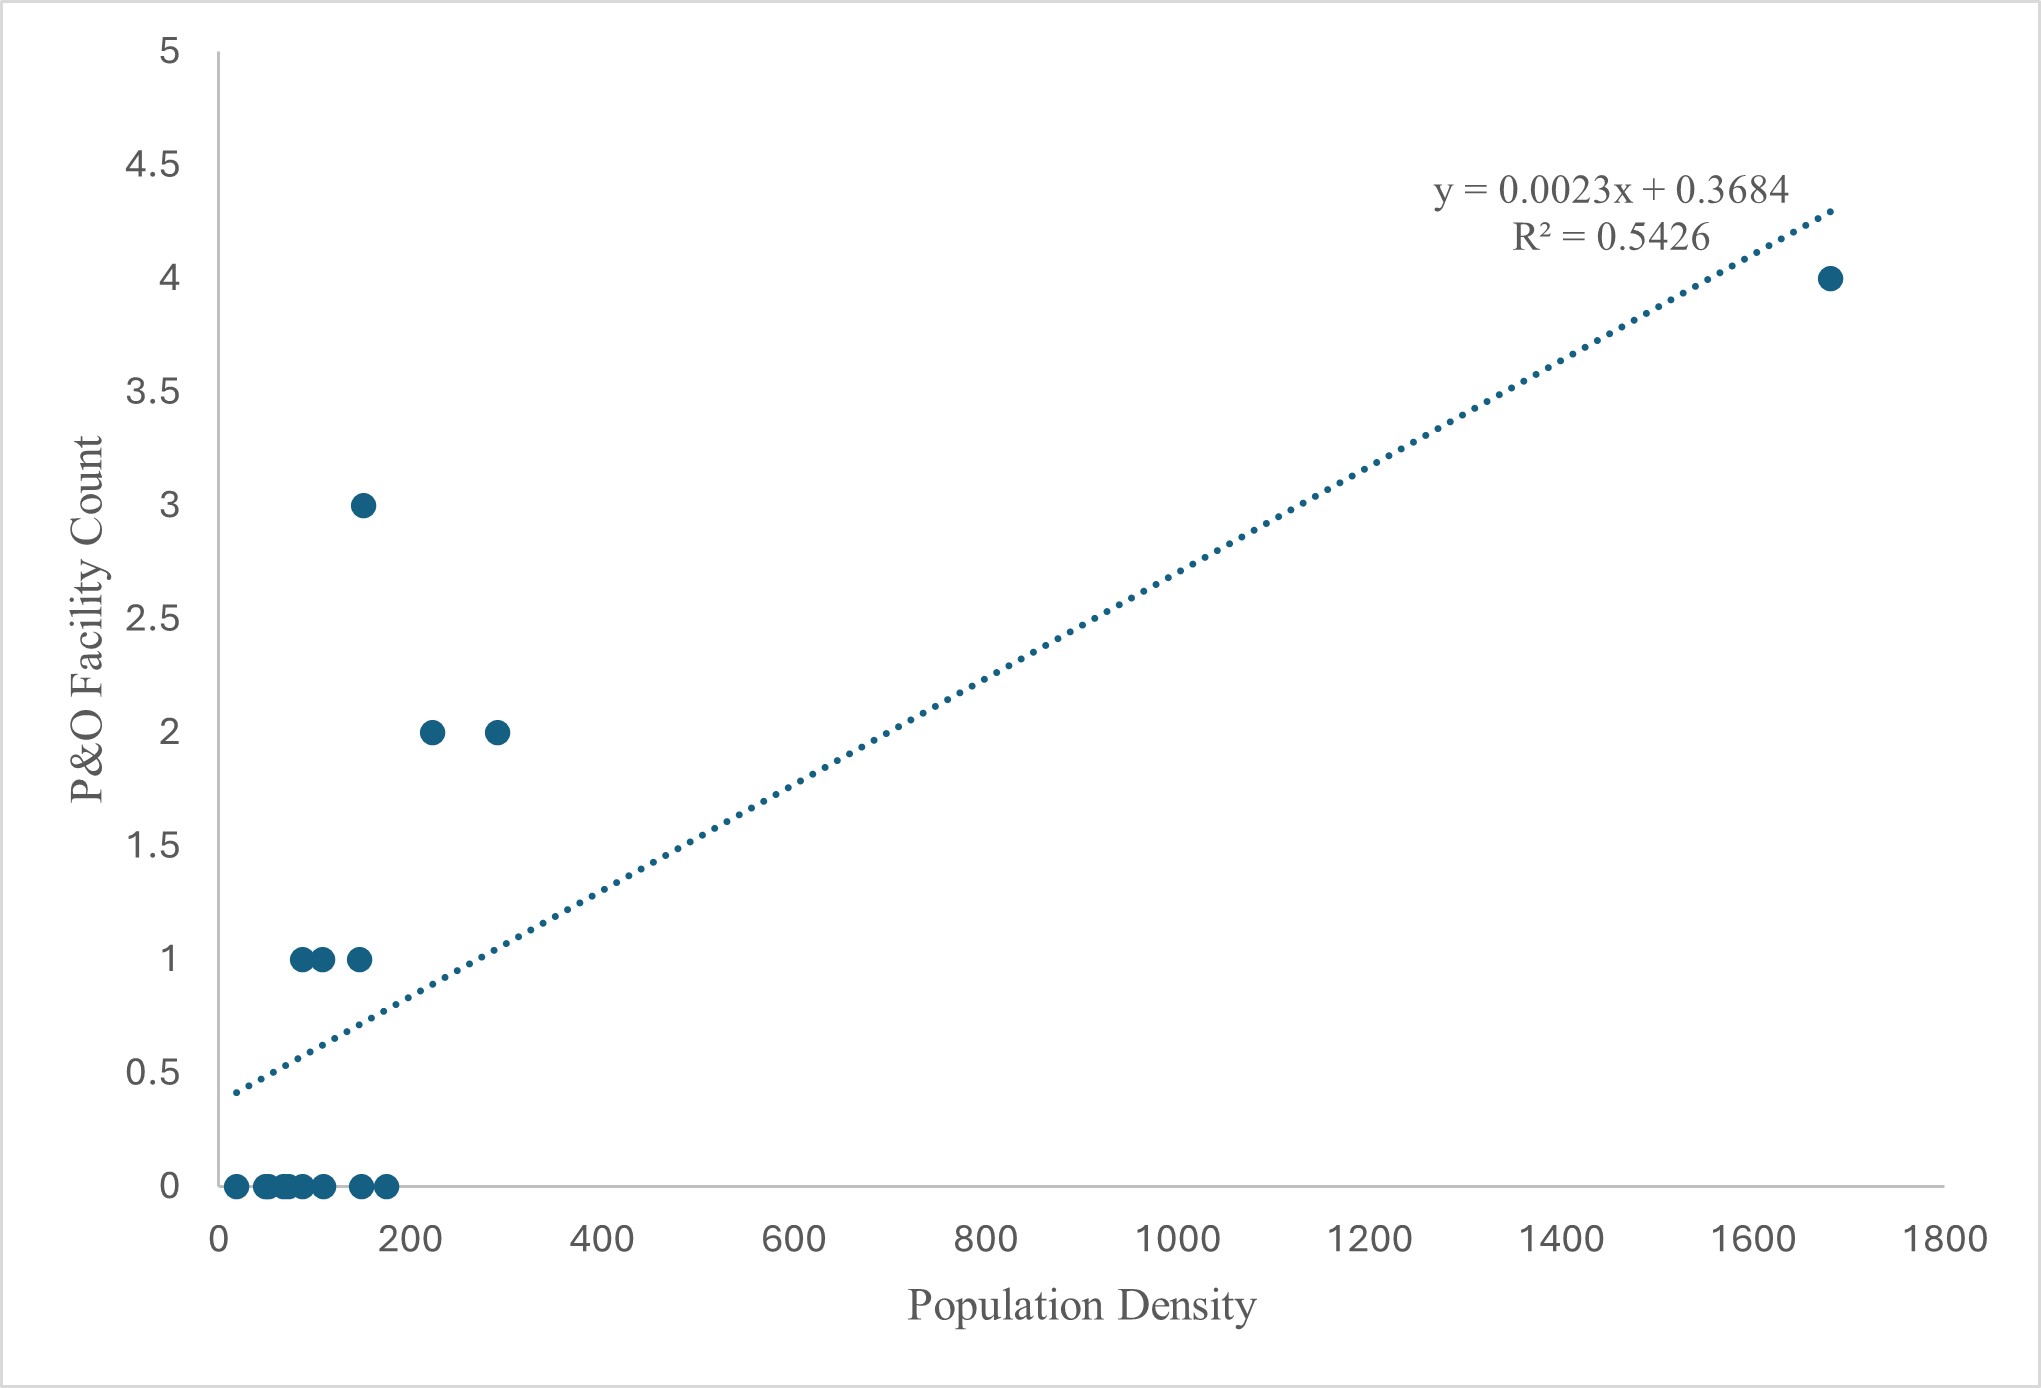
A Pearson correlation analysis revealed a strong, statistically significant positive relationship between regional population density and the distribution of P&O facilities (*r* = 0.74, *p*<0.001). This suggests that, broadly, more densely populated regions in Ghana tend to have greater a higher availability of prosthetics and orthotics services (Table 2).
|
Variable |
*r* |
*p*-value |
|
Population Density vs. Facilities |
0.74 |
0.001 |
A linear regression model further explored this relationship, revealing that population density significantly predicts P&O facility distribution (y=0.0023x+0.3684, R² = 0.54). This model indicates that for every 100 persons/km2 increase in density, the number of facilities increases by approximately 0.23 (Figure 3). However, the R² value of 0.54 demonstrates that population density alone explains only 54% of the variability in P&O facility distribution. This highlights that a substantial portion of the distribution pattern is influenced by non-density factors, such as urban bias, historical economic investment, and the uneven development of healthcare infrastructure.
Statistically, no regions met formal outlier thresholds in the regression analysis, suggesting a consistent underlying trend. Nevertheless, the qualitative spatial analysis revealed critical instances of systemic exclusion. Specifically, regions such as Upper West, Bono East, and Savannah, despite having population densities ranging from 18.78 to 51.76 persons/km2, lacked any P&O facilities. This stark absence signals a profound inequity in availability. While Greater Accra's provision of four facilities aligned with its exceptionally high population density, a closer examination of per-capita access indicated that even in this well–served region, the rate remained low at 2.38 facilities per 100,000 persons. These finding highlights not only regional disparity but also a national shortfall in P&O service coverage, underscoring the need for both horizontal equity (across regions) and vertical equity (relative to need). The findings collectively point to a complex interplay of demographic and socioeconomic factors dictating the current geographical distribution of P&O services, with significant disparities in availability for populations residing in less urbanized or underserved regions.
Discussion
This study provides the first geospatial analysis of Prosthetics and Orthotics (P&O) service distribution across all 16 administrative regions of Ghana. The results revealed that P&O facilities are disproportionately concentrated in the southern part of the country, particularly in regions with higher population densities such as Greater Accra and Ashanti. A strong positive correlation (r = 0.74) was observed between regional population density and the number of P&O facilities, highlighting that service distribution is heavily skewed toward high-density areas, often at the expense of rural populations with comparable rehabilitation needs. Even in the most well-served regions, per capita availability remained low, for example, Greater Accra had just 2.38 facilities per 100,000 people, indicating a broader national shortfall.
The linear regression model further confirmed population density as a statistically significant predictor of P&O facility distribution. However, the moderate coefficient of determination (R² = 0.54) underscores that population density alone does not fully explain the spatial disparities observed. Some regions deviate notably from this trend. For instance, Upper West, despite relatively high population density, has no recorded P&O facilities. Such deviations point to systemic inequities beyond demographic drivers, which may include historical underinvestment, geographic marginalization, and workforce maldistribution [19–21]. These findings suggest that policy approaches relying solely on population metrics for resource allocation are insufficient and must be supplemented by targeted equity-based planning.
The clustering of services in denser urban regions is consistent with broader healthcare distribution patterns, where infrastructure, professional staffing, and economic viability attract providers to metropolitan areas [22,23]. The strong positive correlation between regional population density and the availability of P&O facilities (r=0.74, p<0.001), with Greater Accra being a significant outlier is consistent with Nsiah et al. (2024) [20], who, while focusing on a rural district, similarly found that approximately 40% of health facilities were located in the district capital, leading to substantial disparities in primary and secondary healthcare accessibility based on settlement characteristics and proximity to facilities. Similarly, Farhan et al. (2025) [24], in their analysis of neonatal mortality, reported that rural areas faced critical access barriers, with over 60% requiring more than 60 minutes to reach hospitals. This further supports the notion that population density and urbanization are key drivers of healthcare facility placement in Ghana, which is often to the detriment of less populated or geographically isolated areas [25,26]. While this may support operational efficiency, it worsens access challenges in less urbanized regions, violating the principle of vertical equity, which calls for greater support in areas with fewer resources or heightened vulnerability [27].
The challenges highlighted in this study, particularly the "stark absence" of P&O facilities in regions like Upper West, Bono East, and Savannah despite moderate population densities, resonate deeply with the broader issues of health equity and resource allocation discussed by other scholars. Dumedah et al. (2023) [23] emphasize that health equity is fundamental to improving the health of disadvantaged populations and that spatial access to health services is a vital characteristic of health disparity. Their study across four Ghanaian urban areas similarly found low and inequitable spatial access to health services, with economically disadvantaged populations enduring longer travel distances [23]. This aligns with this study’s observation that even in Greater Accra, per-capita access to P&O services remains low, highlighting a national shortfall beyond just regional disparities. Furthermore, Tansley et al. (2017) [28] found that poverty and poor spatial access to surgical care co-localize in the northwest of Ghana, reinforcing the multifaceted nature of access barriers beyond just population density, encompassing socioeconomic factors and historical investment patterns.
The implications of these disparities are profound and extend across various specialized healthcare services. Our findings regarding the concentration of P&O services in the south and central parts of Ghana, leaving wide service gaps in the north, are consistent with the broader picture of specialized care access. Scott et al. (2022) [29], for instance, revealed major national deficits and significant geographic disparities in radiotherapy capacity, with the greatest benefit from new facilities seen in the northern half of Ghana, an area underserved by specialized care. Ashiagbor et al. (2020) [17] also demonstrated that while general primary healthcare access in the Ashanti region was relatively high (81.4%), accessibility to secondary and tertiary care was significantly lower (61.4% and 14.3%, respectively), particularly in rural districts. This underscores a systemic issue where specialized services, whether P&O, radiotherapy, or higher-level general or special care, are concentrated in urban centres, creating significant barriers for those in rural and less-developed regions. The potential for eHealth strategies and telemedicine, as explored by Lo et al. (2020) [30] for burn care, offers a promising avenue to bridge these gaps, suggesting that a multi-pronged approach is necessary to address the persistent inequities in healthcare accessibility across Ghana. This implore that consideration of hybrid models such as tele-rehabilitation or community-based outreach can be beneficial as interim strategies in areas where P&O permanent facilities may not yet be feasible.
Limitations, recommendations, and policy implications
This study provides the first national geospatial assessment of P&O service distribution in Ghana, but certain limitations must be acknowledged. The analysis relied on official lists of licensed facilities, which may exclude informal and unregistered P&O service providers in Ghana. The analysis focused on fixed, licensed P&O facilities. At present, Ghana does not have established mobile P&O outreach services that extend care to rural or remote communities. Therefore, the geographic disparities identified in this study are unlikely to be offset by mobile outreach services. In addition, the number and type of professionals (prosthetists versus orthotists) available at each facility were not examined. Variations in workforce composition may influence service capacity and specialization, and the absence of this information may affect conclusions regarding the adequacy and equity of service distribution. Population density data from the 2021 census served as a proxy for service demand but did not capture the true population in need of P&O services. The study also did not include network-based measures such as travel time or distance, limiting its ability to fully characterize accessibility.
As a cross-sectional analysis, it presents a static view that does not reflect temporal changes in service coverage or population movement. Furthermore, facility presence alone does not indicate service quality or capacity.
These findings highlight the need for targeted policy action. Efforts to expand P&O infrastructure in northern Ghana are critical to addressing geographic inequities. Future planning should incorporate more nuanced indicators of need, including disability prevalence and transport access. Integrating service quality and operational capacity into future assessments will also be essential for ensuring equitable, effective rehabilitation care across the country.
Conclusion
This study provides critical evidence on the geographic distribution and population alignment of Prosthetics and Orthotics (P&O) services in Ghana. The findings reveal a disproportionate clustering of facilities in high-density southern regions, with marked service gaps in the northern and less urbanized areas. While population density emerged as a significant predictor of facility distribution, the moderate explanatory power of the regression model suggests that systemic and structural factors could also play a substantial role in shaping access. These disparities point to the urgent need for policy frameworks that go beyond population-based allocation to incorporate principles of equity, need, and regional inclusion. Targeted expansion of P&O infrastructure in northern Ghana is critical to address geographic inequities in service availability and to ensure more balanced service coverage nationwide. Geospatial analysis, as demonstrated in this study, offers a powerful tool to guide targeted planning and equitable expansion of rehabilitation services, supporting Ghana’s broader goals of health equity and inclusive development.
Credit Authorship Contribution Statement
Daniel Opoku-Gyamfi: Conceptualization, Formal analysis, Methodology, Software, Writing – original draft. Akouetevi Aduayom-Ahego: Supervision, Writing – review & editing. Prince Oduro: Data curation, Investigation, Writing – review & editing. Benjamin Acheampong: Formal analysis, Methodology, Software, Visualization. Joseph Pitoor Bikala: Data curation, Investigation, Writing – review & editing. Cecil Owusu Bempah: Data curation, Investigation, Writing – review & editing. Christian Kwaku Agbewoavi: Writing – review & editing.
Conflict of Interest
Nothing to be declared.
Acknowledgements
We extend our appreciation to the Ghana Association of Prosthetics and Orthotics (GhAPO) and the Allied Health Professions Council (AHPC) for providing essential master lists of licensed P&O facilities, which were foundational for our data collection. We are grateful to the practicing P&O professionals who served as key informants, offering invaluable insights and cross-validating facility information. Finally, we acknowledge the general support from our respective institutions that facilitated the conduct of this research.
Ethical Statement
No human participants were directly involved in this research. The study exclusively utilized publicly available or aggregated, anonymized secondary data sources related to geospatial information, demographic statistics, and service distribution. All data collection and analysis were performed with due consideration for privacy, data security, and responsible research practices.
Funding
This research did not receive any specific grant from funding agencies in the public, commercial, or not-for-profit sectors.
Declaration of Competing Interest
The authors declare that they have no known competing financial interests or personal relationships that could have influenced the work reported in this paper.
Data Availability Statement
Data are available upon reasonable request.
References
2. Mohaddis M, Maqsood SA, Ago E, et al. Enhancing Functional Rehabilitation Through Orthotic Interventions for Foot and Ankle Conditions: A Narrative Review. Cureus 2023;15:e49103. https://doi.org/10.7759/cureus.49103.
3. Bates TJ, Fergason JR, Pierrie SN. Technological Advances in Prosthesis Design and Rehabilitation Following Upper Extremity Limb Loss. Curr Rev Musculoskelet Med. 2020 Aug;13(4):485–93.
4. McDonald CL, Westcott-McCoy S, Weaver MR, Haagsma J, Kartin D. Global prevalence of traumatic non-fatal limb amputation. Prosthet Orthot Int. 2021 Apr 1;45(2):105–14.
5. Gailey R, McFarland LV, Cooper RA, Czerniecki J, Gambel JM, Hubbard S, et al. Unilateral lower-limb loss: prosthetic device use and functional outcomes in servicemembers from Vietnam war and OIF/OEF conflicts. J Rehabil Res Dev. 2010;47(4):317–31.
6. Htwe O, Yuliawiratman BS, Tannor AY, Nor Asikin MZ, Soh E, et al. Barriers and facilitators for increased accessibility to quality rehabilitation services in low- and middle-income countries: a systematic review. Eur J Phys Rehabil Med. 2024 Jun;60(3):514–22.
7. Mulindwa B, Nalwoga RP, Nakandi BT, Mwaka ES, Kenney LPJ, Ackers L, et al. Evaluation of the current status of prosthetic rehabilitation services for major limb loss: a descriptive study in Ugandan Referral hospitals. Disabil Rehabil. 2023 Mar 24:1–10.
8. Boateng D, Ayellah BB, Adjei DN, Agyemang C. Contribution of diabetes to amputations in sub-Sahara Africa: A systematic review and meta-analysis. Prim Care Diabetes. 2022 Jun;16(3):341–49.
9. Dordunu R, Adjei CA, Kyei JM, Ani-Amponsah M. Experiences of persons with lower limb amputation after prosthetic rehabilitation in Ghana: A qualitative inquiry. Prosthet Orthot Int. 2024 Jun 1;48(3):329–36.
10. Boahen EA, Frimpong Y, Owusu I, Dadzie–Dennis A. Factors that influence the usage of prostheses among persons with lower limb amputation in the Kumasi metropolis. EPRA Int J Multidiscip Res Rev. 2022;8:137–50.
11. Moibi AS. Household Cost of Using Prosthetics and Orthotics Devices in Managing Physical Deformities for Patients Attending the Orthopedic Training Center, Nsawam. Doctoral dissertation, University of Ghana; 2018.
12. Chandran A, Roy P. Applications of geographical information system and spatial analysis in Indian health research: a systematic review. BMC Health Serv Res. 2024 Nov 21;24(1):1448.
13. Mohammed RN, Khawari A, Shaguy JA, Abouzied A. A GIS-based approach to identifying communities underserved by primary health care services-An Afghanistan case study. Front Public Health. 2023 Sep 21;11:1209986.
14. Chan DV, Mann A, Gopal S. Applying Environmental Context to Rehabilitation Research Using Geographic Information Systems and Global Positioning Systems Geospatial Technologies. Rehabil Res Policy Educ. 2021;35(1):33–50.
15. Agbenyo F, Nunbogu AM, Dongzagla A. Accessibility mapping of health facilities in rural Ghana. Jou of Trans & Health. 2017 Sep 1;6:73–83.
16. Kenu E, Ganu V, Calys-Tagoe BN, Yiran GA, Lartey M, Adanu R. Application of geographical information system (GIS) technology in the control of Buruli ulcer in Ghana. BMC Public Health. 2014 Jul 16;14:724.
17. Ashiagbor G, Ofori-Asenso R, Forkuo EK, Agyei-Frimpong S. Measures of geographic accessibility to health care in the Ashanti Region of Ghana. Sci African 2020;9:e00453.
18. Tampah-Naah AM, Osman A, Kumi-Kyereme A. Geospatial analysis of childhood morbidity in Ghana. PLoS One. 2019 Aug 30;14(8):e0221324.
19. Dery LG. Ghana's Health Policy: Human Resources and Health Outcomes Inequality in Northern and Southern Ghana (Doctoral dissertation, Keele University).
20. Nsiah RB, Larbi-Debrah P, Avagu R, Yeboah AK, Anum-Doku S, Zakaria SAR, et al. Mapping health disparities: spatial accessibility to healthcare facilities in a rural district of Ghana using geographic information systems techniques. Am J Heal Res 2024;12:110–23.
21. Owusu-Ansah JK, Akanig-ba JA. Access to healthcare services by the mobility impaired: Structural obstacles and experiences in Tamale, Northern Ghana. Jrl of Sci and Tech. 2021;39(1, 2):56–71.
22. Korah PI, Nunbogu AM, Ahmed A. Measuring access to health facilities in Ghana: Implications for implementation of health interventions and the Sustainable Development Goal 3. Applied Geography. 2023 Sep 1;158:103026.
23. Dumedah G, Iddrisu S, Asare C, Adu-Prah S, English S. Inequities in spatial access to health services in Ghanaian cities. Health Policy Plan. 2023 Nov 28;38(10):1166–80.
24. Abubakr AF, Kubio C. Unveiling neonatal mortality inequities in Ghana: A geospatial and temporal analysis of regional disparities, healthcare accessibility, and institutional gaps to drive targeted interventions. Pediatr Neonatol. 2026 Mar;67(2):150–8.
25. Tay DA, Ocansey RTA. Impact of Urbanization on Health and Well-Being in Ghana. Status of Research, Intervention Strategies and Future Directions: A Rapid Review. Front Public Health. 2022 Jun 28;10:877920.
26. Boye BO, Pokhrel S, Cheung KL, Anokye N. Drivers and barriers to rural and urban healthcare placement in Ghana: a Delphi study. Front Public Health. 2025 May 29;13:1436098.
27. Domapielle MK, Akurugu CA, Derbile EK. Vertical equity in access to health insurance services: an exploration of perceptions and enrolment in the Jirapa Municipality, north-western Ghana. Jrl of Planning and Land Manag. 2021 Apr 15;2(1):1–12.
28. Tansley G, Stewart BT, Gyedu A, Boakye G, Lewis D, Hoogerboord M, et al. The Correlation Between Poverty and Access to Essential Surgical Care in Ghana: A Geospatial Analysis. World J Surg. 2017 Mar;41(3):639–43.
29. Scott AA, Polo A, Zubizarreta E, Akoto-Aidoo C, Edusa C, Osei-Bonsu E, et al. Geographic Accessibility and Availability of Radiotherapy in Ghana. JAMA Netw Open. 2022 Aug 1;5(8):e2226319.
30. Lo S, Ampomah O, Ankrah L, Darko K, Bertozzi-Villa A. Quantifying Inequitable Access to Rapid Burn and Reconstructive Care through Geospatial Mapping. Plast Reconstr Surg Glob Open. 2020 Aug 25;8(8):e3069.