Introduction
Type 2 diabetes mellitus (T2DM) is a metabolic dysfunction characterized by elevated levels of blood glucose as well as impaired lipid and protein metabolism [1,2]. The mobilization of fatty acids is augmented in insulin resistance due to the failure of lipolysis inhibition by the hormone that further augments the increase in plasma NEFA levels. This in turn, results in inflammation as well as further insulin resistance [3]. The complementation of insulin resistance with dysfunction of pancreatic islet β-cells leads to hyperglycemia. Insulin resistance may persist unnoticed for several years prior to onset of T2DM. Insulin inhibits lipolysis of stored fat in adipose tissue and gluconeogenesis in liver. It also increases the synthesis of proteins needed for the optimal cellular function, repair, growth, and stimulates the translocation of the GLUT-4 protein leading to increased transport of glucose into the muscle cells [4]. Insulin resistance is a metabolic dysfunction that is often mediated by increased inflammation.
Current Knowledge in the Association of NEFA in T2DM
Various dietary fatty acids, especially omega-6 and saturated fatty acids (particularly arachidonic acid and palmitic acid) can be pro-inflammatory molecules that play a pivotal role in diet-induced inflammation. Omega-3 fatty acids (especially eicosapentaenoic acid and docosahexaenoic acid) on the other hand, can be anti-inflammatory molecules [5]. Several studies have postulated that high-fat diet causes insulin resistance and consumption of saturated fatty acids induces hyperlipidemia and obesity, leading to progression of diabetic complications. It is also stated that polyunsaturated fatty acids improve the diabetic complications [6,7]. Moreover, several studies have suggested that the composition and concentration of plasma free fatty acids (FFAs) are associated with insulin sensitivity [8]. Adipose tissue not only store and release FFAs but also secrete a number of inflammatory markers [9]. The mechanism of insulin resistance due to FFAs is not very clear, though it may include FFA facilitated generation of reactive oxygen species (ROS) and activation of the Toll-like receptor 4 (TLR-4) pathway [10] or endoplasmic reticulum stress [11].
In this commentary, we have reviewed the plasma FFA levels in human subjects at different glycation levels and investigated their relationship in T2DM patients. A few studies are available on the distribution/mobilization of plasma fatty acids in T2DM patients. These have been summarized in Table 1. The most common pattern jointly observed in T2DM patients in all the studies is the elevation in saturated FFAs, particularly palmitic acid and stearic acid. The evidence related to other saturated FFAs are not conclusive. Saturated fatty acids not only serve as the main energy source as nutrient, but also act as signaling molecules in various cellular processes. The chronic increase in levels of these fatty acids in plasma is the major contributor for lipotoxicity leading to complications in T2DM patients [12,13]. Most of the studies have shown that the level of oleic acid (C18:1) is increased in T2DM patients. Our group has analyzed the plasma fatty acids levels at different levels of glycations (Groups HbA1c <6%, 6-7%, 7.1-9%, 9.1-12% and >12%). In contrary, in our study, the levels of oleic acid were significantly decreased in patients with increased levels of glycation (HbA1c 6-15%) [14]. Further, no uniformity in the pattern of ω6 fatty acids (linoleic acid) level in T2DM patients was observed.
| S.no | Type of study/ Method of fatty acid measurement | Sample size | Levels of FFA measured in blood in T2DM patients as compared to control group | Reference |
| 1 | Case control study /GC-MS |
Obese diabetic subjects (n=6, control group) T2DM patients (n=6, test group) |
Plasma saturated FFA (Palmitic acid (C16:0), and stearic acid) ↑ MUFA (Oleic acid (C18:1n-9) ↑ PUFA = |
[15] |
| 2 | Case control study/ GC-MS | Healthy control (n=45) T2DM (n=78) |
Plasma saturated FFA (myristic acid (C14:0), Palmitic acid (C16:0), stearic acid, , lignoceric acid (C24:0) ↑ MUFA, oleic acid (C18:1n-9), palmitoleic acid (C16:1n-7) ↑ PUFA C18:2n-6, linoleic acid ↑ |
[16] |
| 3 | Case control study/ GC-MS | Healthy control (n=53) T2DM (n=52) |
Plasma saturated FFA (myristic acid (C14:0), Palmitic acid (C16:0) and stearic acid) ↑ MUFA (C18:1n-9, oleic acid) ↑ PUFA C18:2n-6, linoleic acid ↑ |
[17] |
| 4 | Case control study/ GC-MS | Non-diabetic healthy control (n=6) T2DM (n=22) |
Plasma saturated FFA (myristic acid (C14:0), Palmitic acid (C16:0) and stearic acid) ↑ MUFA (C18:1n-9, oleic acid) ↑ PUFA (linoleic acid, C18:2n-6) ↑ |
[18] |
| 5 | Case control study/ GC-MS | Non-diabetic healthy control (n=100) T2DM (n=100) |
Plasma saturated FFA (Palmitic acid (C16:0) and stearic acid) ↑ PUFA linoleic acid (C18:2n-6) ↑ |
[19] |
| 6 | Cross-sectional study/ GC-MS | Different levels of glycation (HbA1c 4.9-15.0%) and further categorized in 5 groups [group 1 (HbA1c <6%), group 2 (HbA1c 6-7%), group 3 (HbA1c 7.1- 9%), group 4 (HbA1c (9.1- 12%) and group 5 (HbA1c >12%)] with 10 subjects in each group. |
The levels of lauric acid (C12:0) and stearic acid (C18:0) were significantly raised at an advanced stage of glycation (HbA1c 9.1-15%). Long-chain fatty acids, pentadecanoic acid (C15:0) and palmitic acid (C16:0) levels were elevated in hyperglycaemia as compared to normoglycemic subjects (HbA1c <6%). Moreover, levels of mono and polyunsaturated fatty acids, oleic acid (C18:1) and linoleic acid (C18:2, w6) were significantly decreased in patients with increased levels of glycation (HbA1c 6-15%) | [14] |
| 7 | Case control study/ HPLC | Obese women aged 25–35 years and has insulin resistance (n=50) and healthy normal weight women as control group (n=50) | Oleic acids, linoleic acid, and arachidonic acid ↑ alpha-linolenic acid in insulin resistance woman ↓ |
[20] |
Oleic acid and palmitic acid are the most abundant dietary as well as plasma fatty acids and represent 31% and 27%, respectively, of total plasma non-esterified fatty acids [21].
Mechanism of Palmitic Acid (C16:0)- induced Insulin Resistance
A preclinical study showed that increased level of plasma palmitic acid induced the inflammation and also the insulin resistance. The studies on plasma fatty acids (summarized in Table 1), have revealed that the level of palmitic acid is significantly elevated in T2DM patients. Three main mechanisms have been postulated to explain palmitic acid-mediated insulin resistance (Figure 1): i) Increased synthesis of deleterious complex lipids (DAG/ ceramide); ii) Impaired function of cellular organelles, and iii) Receptor-mediated inflammation. Increased internalization of palmitic acid exceeds oxidative requirements and spills over into harmful nonoxidative metabolic pathways resulting in increased levels of diacylglycerol (DAG) and ceramide. Elevated levels of DAG activate protein kinase C (PKC), which down regulates the insulin signaling pathway. Besides, it phosphorylates insulin receptor substrate (IRS)-1 at serine residues and also stimulates the inhibitor of nuclear factor (NF)-kB (IkB) kinase (IKK)b–NF-kB pathway, thus further aggravating the impairment of insulin signaling and inciting inflammation [22]. The increased level of ceramide, on the other hand, triggers the nod like receptor containing a pyrin domain (NLRP3) inflammasome that facilitates the release of interleukin (IL)-1β. It also leads to the activation of protein phosphatase 2A (PP2A) and PKC, which both attenuate the insulin signaling pathway [23]. The increased level of palmitic acid impairs the function of the endoplasmic reticulum (ER) and mitochondria, which leads to the ER stress that in turn promotes inflammation. The impairment of mitochondrial function may also reduce fatty acid oxidation and increase ROS generation [24]. Moreover, palmitic acid can also stimulate TLR- 4 through fetuin-A and lipopolysaccharides (LPS) leading to an increase in the activity of the IKKb–NF-kB pathway [25]. However, the study reported that oleic acid supplementation improved insulin sensitivity in human subjects and reduced the effect of palmitic acid [26].
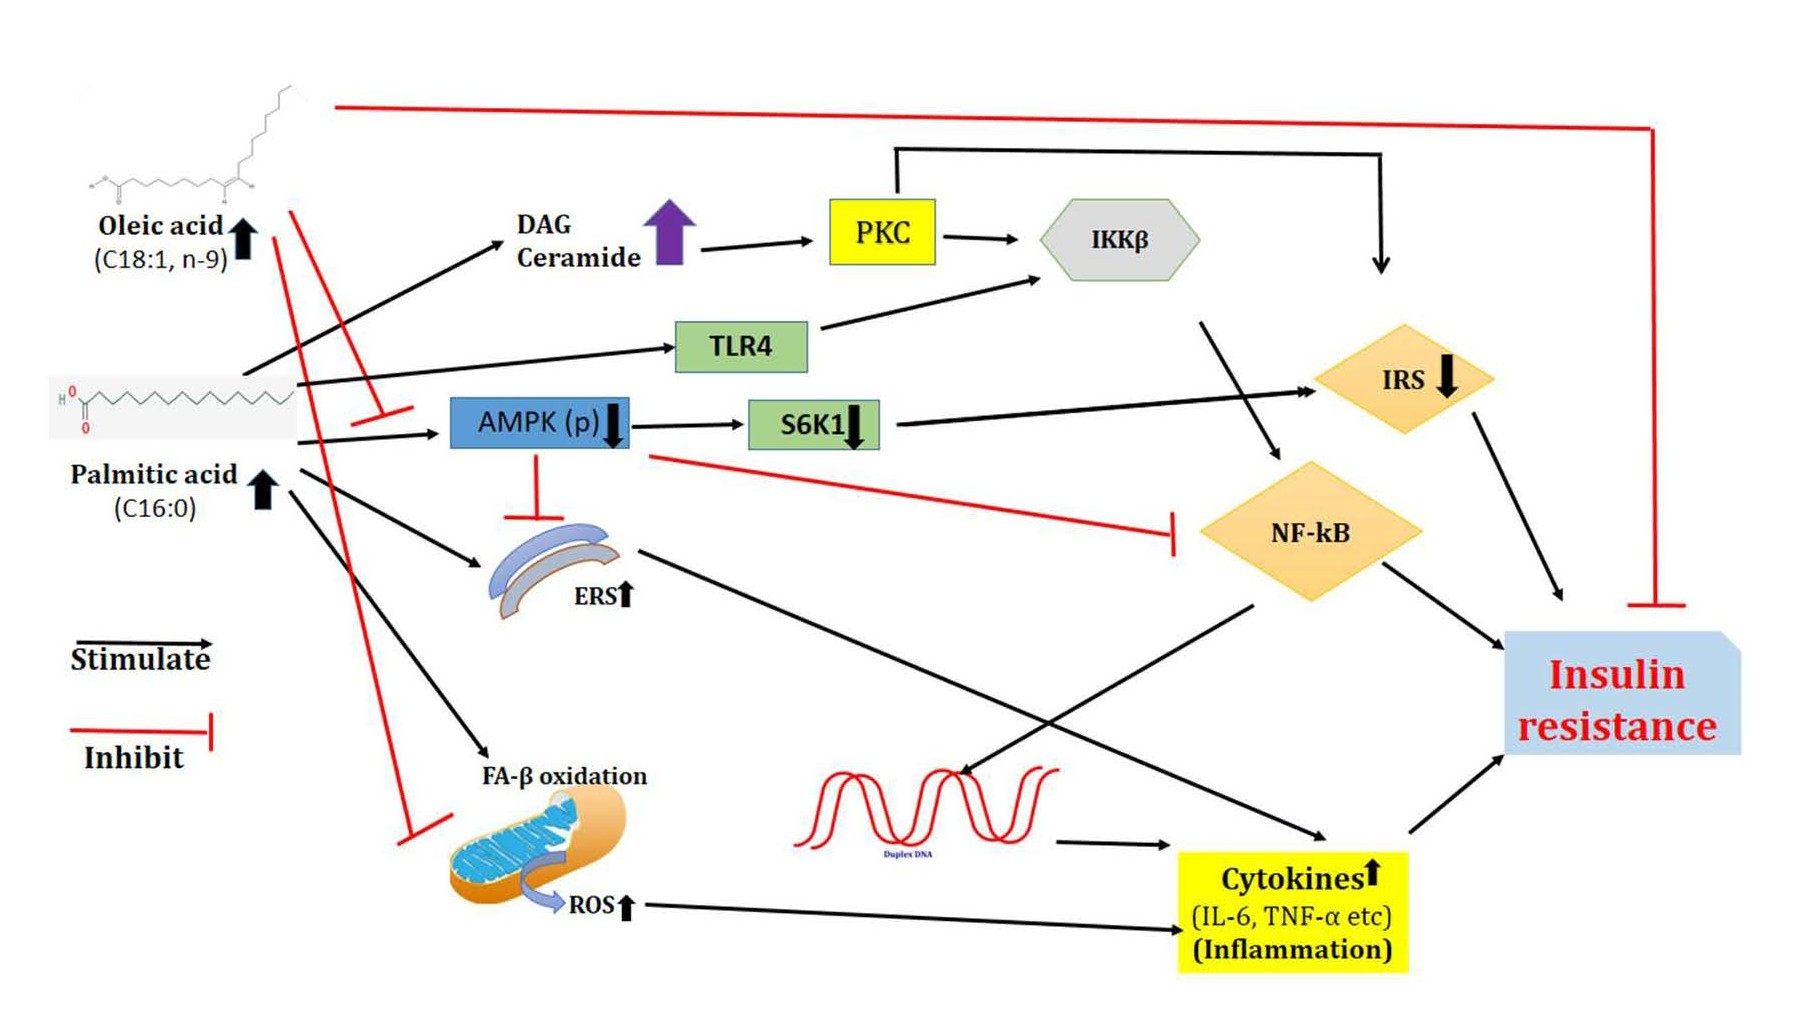
Figure 1. Mechanism of palmitic acid induced insulin resistance and effect of oleic acid on the prevention of palmitic acid induced insulin resistance (ERS: Endoplasmic Reticulum Stress; ROS: Reactive Oxygen Species; DAG: Diacyl-glycerol).
Oleic Acid (C18:1)-mediated Mechanisms that Prevent Palmitic Acid-induced Insulin Resistance and Inflammation
The beneficial effect of oleic acid on palmitic acidinduced insulin resistance is dependent on the AMPactivated protein kinase (AMPK), a metabolic sensor that also modulates inflammation and has been implicated as one of the therapeutic targets for diabetes [27]. Oleic acid prevents the harmful effects of palmitic acid by increasing the mitochondrial oxidation of saturated fatty acids and stimulating their accumulation in form of triacylglycerol, thus reducing the synthesis of diacylglycerol (DAG) and ceramide. The surge in fatty acid oxidation triggered by oleic acid is mediated by the restoration of AMPK activity. Oleic acid prevents the reduction in AMPK activity caused by palmitic acid and eventually inhibits endoplasmic reticulum stress and inflammation [28]. Endoplasmic reticulum stress is possibly a novel mechanism involved in inter-relation between saturated NEFA induced inflammation and insulin resistance. Palmitic acid induces the synthesis of the ER stress-induced pseudokinase, Tribbles 3 (TRB3). It is a pseudokinase, which contains a kinase domain without the enzymatic activity and is responsible for entirely different metabolic functions. However, oleic acid prevents the increase in the levels of TRB3 pseudokinase. Besides, oleic acid also reduces ROS generation and protects mitochondria from palmitic acid-induced oxidative stress. The number of studies (summarized in Table 1) have shown that the oleic acid level is significantly increased in T2DM patients, hence the data need to be further validated.
Diagnostic Perspective of Plasma FFAs Analysis in T2DM
The mobilization of fatty acids plays a key role in insulin resistance and lifestyle disorders. Hence, accurate and robust analytical methods are essential for explicating the mechanism of fatty acid mediated pathophysiology in disease conditions. There is a need for establishing the plasma fatty acid reference range of healthy subjects so that the changes in fatty acids in disease condition(s) could be determined. An interesting study conducted in Canadian population showed that the reference range of palmitic acid, stearic acid, oleic acid, linoleic acid, α-linolenic acid and docosahexaenoic acid in healthy subjects is 0.3 to 4.1 mmol/L, 0.1 to 1.0 mmol/L, 0.03 to 3.2 mmol/L, 0.2 to 5.0 mmol/L, 12.0 to 186.9 μmol/L, and 7.2 to 237.5 μmol/L, respectively [29]. In Indian population, no such study has been reported. Gas Chromatography—Mass Spectrometry (GC-MS) is the widely used method for the fatty acid measurements in plasma. However, it requires sophisticated GC-MS equipment for the analysis that limits its use in clinics. Further, in GC-MS analysis, a lot of noise is also present. This necessitates to have larger sample size for the analysis of fatty acids and their validation by using different levels of quality control. It will be a great achievement for scientific community to validate clinically or therapeutically, one or two specific fatty acid(s) in pathophysiology of T2DM.
The present commentary provides the existing status of evidence on T2DM related changes in plasma fatty acids and their possible mechanism for causing harmful effects.
Further research is necessary using large sample size and detail deliberation on several confounding factors that influence the plasma fatty acid levels.
Declaration of Competing Interest
No potential conflicts of interest were disclosed.
References
2. Chandra K, Singh P, Dwivedi S, Jain SK. Diabetes Mellitus and Oxidative Stress: A Co-relative and Therapeutic Approach. Journal of Clinical & Diagnostic Research. 2019 May 1;13(5).
3. Mandal S, Causevic A, Dzudzevic-Cancar H, Semiz S. Free fatty acid profile in Type 2 diabetic subjects with different control of glycemia. InCMBEBIH 2017 2017 (pp. 781-786). Springer, Singapore.
4. Wilcox G. Insulin and insulin resistance. Clinical Biochemist Reviews. 2005 May;26(2):19.
5. Sears B, Perry M. The role of fatty acids in insulin resistance. Lipids in Health and Disease. 2015 Dec;14(1):1- 9.
6. Kusunoki M, Tsutsumi K, Nakayama M, Kurokawa T, Nakamura T, Ogawa H, et al. Relationship between serum concentrations of saturated fatty acids and unsaturated fatty acids and the homeostasis model insulin resistance index in Japanese patients with type 2 diabetes mellitus. The Journal of Medical Investigation. 2007;54(3, 4):243- 7.
7. Yin W, Tsutsumi K. Lipoprotein Lipase Activator NO- 1886. Cardiovascular Drug Reviews. 2003 Jun;21(2):133- 42.
8. Vessby B, Aro A, Skarfors E, Berglund L, Salminen I, Lithell H. The risk to develop NIDDM is related to the fatty acid composition of the serum cholesterol esters. Diabetes. 1994 Nov 1;43(11):1353-7.
9. Kershaw EE, Flier JS. Adipose tissue as an endocrine organ. The Journal of Clinical Endocrinology & Metabolism. 2004 Jun 1;89(6):2548-56.
10. Shi H, Kokoeva MV, Inouye K, Tzameli I, Yin H, Flier JS. TLR4 links innate immunity and fatty acid�induced insulin resistance. The Journal of Clinical Investigation. 2006 Nov 1;116(11):3015-25.
11. Hotamisligil GS. Role of endoplasmic reticulum stress and c-Jun NH2-terminal kinase pathways in inflammation and origin of obesity and diabetes. Diabetes. 2005 Dec 1;54(suppl 2):S73-8.
12. Yi LZ, He J, Liang YZ, Yuan DL, Chau FT. Plasma fatty acid metabolic profiling and biomarkers of type 2 diabetes mellitus based on GC/MS and PLS-LDA. FEBS Letters. 2006 Dec 22;580(30):6837-45.
13. Balyan K, Sharma P, Chandra K, Agarwal S, Jain SK. Oxidative stress is independent factor for end-stage renal disease in type 2 diabetes mellitus patients. Annals of the National Academy of Medical Sciences (India). 2018 Jul;54(03):147-52.
14. Chandra K, Jain V, Azhar M, Khan W, Alam O, Ahmad S, Jain SK. Effect of augmented glycation in mobilization of plasma free fatty acids in type 2 diabetes mellitus. Diabetes & Metabolic Syndrome: Clinical Research & Reviews. 2020 Sep 1;14(5):1385-9.
15. Clore JN, Allred J, White D, Li J, Stillman J. The role of plasma fatty acid composition in endogenous glucose production in patients with type 2 diabetes mellitus. Metabolism-Clinical and Experimental. 2002 Nov 1;51(11):1471-7.
16. Yi L, He J, Liang Y, Yuan D, Gao H, Zhou H. Simultaneously quantitative measurement of comprehensive profiles of esterified and non-esterified fatty acid in plasma of type 2 diabetic patients. Chemistry and Physics of Lipids. 2007 Dec 1;150(2):204-16.
17. Liu L, Li Y, Guan C, Li K, Wang C, Feng R, Sun C. Free fatty acid metabolic profile and biomarkers of isolated post-challenge diabetes and type 2 diabetes mellitus based on GC–MS and multivariate statistical analysis. Journal of Chromatography B. 2010 Oct 15;878(28):2817-25.
18. Grapov D, Adams SH, Pedersen TL, Garvey WT, Newman JW. Type 2 diabetes associated changes in the plasma non-esterified fatty acids, oxylipins and endocannabinoids. PLoS One 2012;7.
19. Lu Y, Wang Y, Ong CN, Subramaniam T, Choi HW, Yuan JM, Koh WP, Pan A. Metabolic signatures and risk of type 2 diabetes in a Chinese population: an untargeted metabolomics study using both LC-MS and GC-MS. Diabetologia. 2016 Nov;59(11):2349-59.
20. Zaki M, Hussein J, Ibrahim AM, Youness ER. Circulating Plasma Free Fatty Acids, Insulin Resistance and Metabolic Markers in Obese Women. Biomedical and Pharmacology Journal. 2020 Dec 30;13(4):1595-600.
21. Vessby B, Uusitupa M, Hermansen K, Riccardi G, Rivellese AA, Tapsell LC, et al. Substituting dietary saturated for monounsaturated fat impairs insulin sensitivity in healthy men and women: The KANWU Study. Diabetologia. 2001 Mar;44(3):312-9.
22. Tumova J, Andel M, Trnka J. Excess of free fatty acids as a cause of metabolic dysfunction in skeletal muscle. Physiological Research. 2016 Mar 1;65(2):193.
23. Chaurasia B, Summers SA. Ceramides–lipotoxic inducers of metabolic disorders. Trends in Endocrinology & Metabolism. 2015 Oct 1;26(10):538-50.
24. Gonzalez-Franquesa A, Patti ME. Insulin resistance and mitochondrial dysfunction. Mitochondrial Dynamics in Cardiovascular Medicine. 2017:465-520.
25. Velloso LA, Folli F, Saad MJ. TLR4 at the crossroads of nutrients, gut microbiota, and metabolic inflammation. Endocrine Reviews. 2015 Jun 1;36(3):245-71.
26. Palomer X, Pizarro-Delgado J, Barroso E, Vázquez- Carrera M. Palmitic and oleic acid: the yin and yang of fatty acids in type 2 diabetes mellitus. Trends in Endocrinology & Metabolism. 2018 Mar 1;29(3):178-90.
27. Salvado L, Coll T, Gomez-Foix AM, Salmeron E, Barroso E, Palomer X, Vazquez-Carrera M. Oleate prevents saturated-fatty-acid-induced ER stress, inflammation and insulin resistance in skeletal muscle cells through an AMPK-dependent mechanism. Diabetologia. 2013 Jun;56(6):1372-82.
28. Kwon B, Querfurth HW. Palmitate activates mTOR/p70S6K through AMPK inhibition and hypophosphorylation of raptor in skeletal muscle cells: Reversal by oleate is similar to metformin. Biochimie. 2015 Nov 1;118:141-50.
29. Abdelmagid SA, Clarke SE, Nielsen DE, Badawi A, El- Sohemy A, Mutch DM, Ma DW. Comprehensive profiling of plasma fatty acid concentrations in young healthy Canadian adults. PloS One. 2015 Feb 12;10(2):e0116195.