Abstract
Diffuse large B-cell lymphoma (DLBCL) is the most common non-Hodgkin lymphoma (NHL), making up to about 30%-40% of NHL in the U.S. PET-CT scan is recommended as the most accurate imaging technique in DLBCL for staging and response assessment. Pretreatment assessment of PET-CT scan derived metrics such as total metabolic tumor volume (TMTV) has been shown to correlate with progression-free survival (PFS) and overall survival (OS) in DLBCL. In our study, we evaluated the prognostic significance of pretreatment TMTV on event-free survival (EFS) at 24-months. We also evaluated the correlation between pretreatment TMTV, total lesion glycolysis (TLG) and cell of origin (COO). TMTV was calculated using a threshold of 41% of the max pixel value (based on prior studies) to draw the volume of interest (VOI) for a lesion. A pooled t-test was performed to compare TMTV, TLG and COO with EFS at 24 months. Chi-Square test compared TMTV with COO. The median age was 58 years, with a median duration of follow up of 26 months. The mean pretreatment TMTV and pretreatment TLG was 295 cm3 and 4519 units, respectively. Amongst all patients, 19.2% had an event within 24 months. When TMTV was compared to EFS at 24 months, the mean TMTV was 304 cm3 for those who had an event versus 294 cm3 without (p=0.95). TLG, compared to EFS at 24 months showed a mean TLG of 3391 for those who had an event versus 4914 without (P=0.40). COO, when compared with TLG, had means of 4365 and 4933 for germinal center (GCB) and non-germinal center (non-GCB) subtypes, respectively with a p=0.79. This study demonstrates a lack of prognostic significance of pretreatment PET scan on EFS at 24 months in DLBCL and lack of correlation between pretreatment TMTV, TLG, COO and EFS at 24. Higher TMTV correlated with inferior PFS and retains its prognostic significance as determined by prior studies. Larger sample size is required to determine the validity of our findings.
Keywords
Diffuse Large B-cell Lymphoma, Positron-Emission Tomography scan, Tumor Burden, Total Metabolic Tumor Volume, Total Lesional Glycolysis, Prognosis, Event-free survival, Cell of Origin
Introduction
Diffuse large B-cell lymphoma (DLBCL) is a heterogeneous disease with variable outcomes. The majority of patients benefit from chemo-immunotherapy; however, 30 to 40% relapse after first-line treatment, and 10% are refractory to first-line treatment. This variability in outcome has led to the identification of prognostic factors to stratify patients based on their risk of relapse. The five-factor international prognostic index (IPI) was formulated for such risk stratification more than 20 years ago, based on clinical information obtained from patients with aggressive lymphomas treated with cyclophosphamide, doxorubicin, vincristine, and prednisone (CHOP)-like chemotherapy [1]. The addition of rituximab to CHOP chemotherapy led to improved outcomes, diminishing the discriminatory capacity of IPI amongst risk groups [2]. Efforts to enhance the prognostic model by adding or defining new factors have only led to minor improvements without the ability to identify patients at risk of an inferior outcome [3].
A significant component of all prognostic scoring systems’ is the assessment of tumor bulk by Ann Arbor staging. Positron emission tomography (PET) visualizes tumor metabolic activity, allows functional characterization of the disease, and currently represents the preferred imaging modality for disease staging and assessment of response to treatment. Scoring criteria for assessment of response, have been developed and validated using visual and quantitative methods [4]. Similarly, after treatment, the achievement of event-free survival (EFS) at 24 months is a robust surrogate endpoint for overall survival (OS) in DLBCL treated with chemo-immunotherapy [5]. Total metabolic tumor volume (TMTV) is an alternative method for assessment of tumor disease burden, which has the potential advantage of combining volumetric and functional assessment of disease as provided by 18-Fluorodeoxyglucose positron emission tomography (18-FDG PET/CT). The total metabolic tumor volume (TMTV) is calculated using a fixed SUVmax threshold of 41%. Total lesion glycolysis (TLG) is a measure of the level of glucose accumulation within all regions of interest on a PET scan. Retrospective studies that utilized TMTV for assessing tumor bulk have shown to predict progressionfree survival (PFS) and OS in DLBCL [6,7]. Based on these prior studies, the primary objective of our study was to determine the prognostic significance of the pretreatment total metabolic tumor volume (TMTV) on EFS at 24 months after treatment. A secondary objective of our study was to determine the correlation of TLG and cell of origin (COO) subtypes on EFS at 24 months.
Materials and Methods
Study population
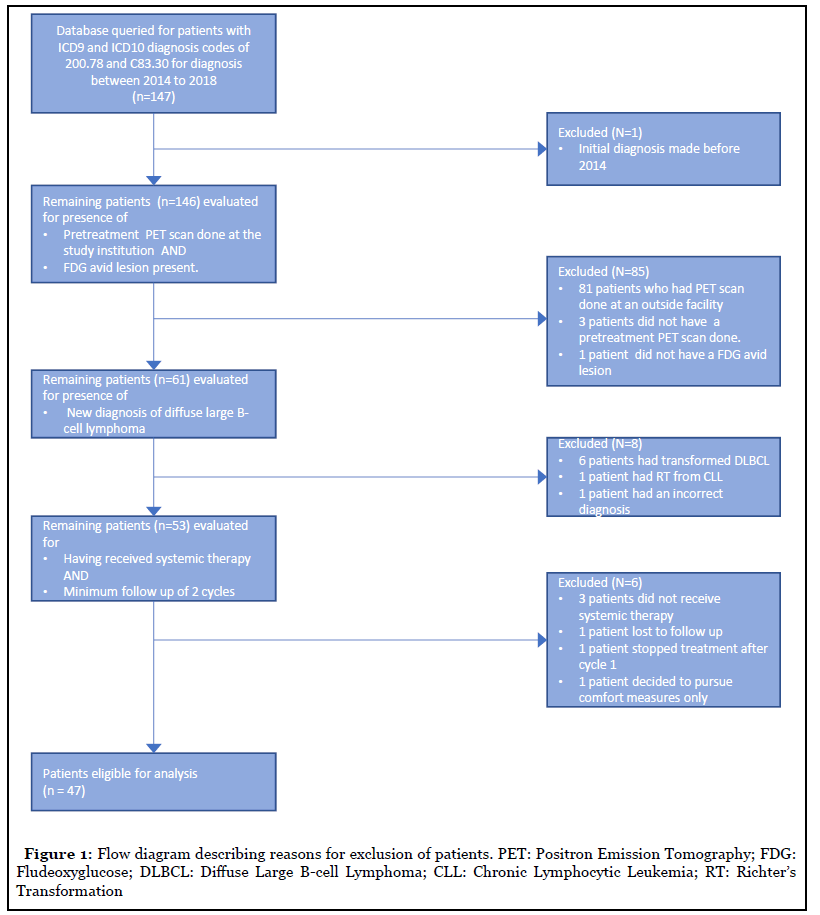
We evaluated PET-CT scan data from patients diagnosed with DLBCL and treated at a tertiary care institution from 2014 to 2018. The inclusion criteria included, a new diagnosis of DLBCL between Jan 2014 and Jan 2018, histologically confirmed diagnosis of DLBCL by the WHO classification and a pretreatment PET-CT scan done at the same tertiary institution. Patients who received less than two cycles of treatment and without a minimum of 6-months of follow-up period after treatment were excluded from the study.
Data collection
The medical records where queried for obtaining a list of patients with ICD9 and ICD10 diagnosis codes of 200.78 and C83.30 respectively. Data were collected for age, sex, Ann Arbor stage, R-IPI score, lactate dehydrogenase, extranodal sites of disease, performance status, date of the pretreatment PET scan, COO subtype, date of chemotherapy initiation, chemotherapy regimen, number of chemotherapy cycles received, disease status at the end of treatment, and clinical status at last clinic follow-up.
The COO was grouped as either germinal center B cell (GCB) or non-germinal center B cell (non-GCB) subtype based on Hahn’s algorithm. The primary endpoint of the study was EFS at 24 months. EFS was defined as the time from diagnosis until relapse or progression, unplanned re-treatment of lymphoma after initial chemoimmunotherapy, or death as a result of any cause. Other outcomes assessed included PFS, defined as the time from diagnosis until relapse or progression or death as a result of any cause and OS, defined as the time from diagnosis until death as a result of any cause.
Calculating TMTV and total lesional glycolysis (TLG)
The pretreatment PET-CT scans were individually reviewed by two nuclear medicine physicians (GE, RJ). The TMTV, measured in cm3, was computed using automated software (syngo®.via, Siemens), and measurements for TMTV were recorded. For each lesion visualized on PET/ CT, a Volume of interest (VOI) or MTV was calculated using a threshold of 41% of the SUVmax (max pixel value for every lesion). The TMTV was then calculated by summing all the MTV for every single lesion with VOI’s excluding areas of high physiological uptake or areas exceeding the anatomical tumor boundaries, as seen on CT.
The lesion glycolysis was calculated for each lesion by multiplying the MTV by the SUVmean (mean value of the FDG uptake in each lesion): MTV x SUVmean. The TLG was obtained for each patient by adding all the individual lesional glycolysis.
Statistical analysis
The prognostic value of TMTV was determined using EFS at 24 months, PFS and OS as endpoints, censoring at the time of the last follow-up. EFS at 24 months was dichotomized to form two groups; one with EFS less than 24 months and other with EFS for more than 24 months. A pooled t-test was performed to compare TMTV and TLG with EFS at 24 months. The pooled t-test was also used to compare TMTV with COO. A p-value of <0.05 was considered significant. We performed a time to event analysis using the log-rank test and plotted them using the Kaplan-Meir estimates. The cohort was divided into high and low TMTV groups based on pretreatment TMTV values with cutoffs of 550 and 300 for two separate analyses. Cox proportional hazards model was used to perform multivariate analysis.
Results
Pretreatment PET parameters
Of the 147 screened from the institutional database, 47 patients met the inclusion criteria (Table 1) (Figure 1). For these patients, the median TMTV was 142 cm3 (range 2.49 to 1843.55), with a median TLG of 1269.74 (Range 14.32 to 42153.94). Amongst 16 patients with Ann Arbor stage I-II lymphoma, the mean TMTV was 57.51 versus 428.20 for higher stage III-IV lymphoma (p<0.001). The mean TMTV in the GCB subtype was 264.3 versus 339.0 in the non-GCB subtype (p=0.59). Similarly, the mean TLG in the GCB subtype was 4365.8 versus 4933.6 in the non- GCB subtype (p=0.79). There was also no relationship observed between the Ann Arbor stage and GCB or non- GCB subtype (p=0.42).
| Population (%) | |
| Age in years (median, Range) | 60 (19 – 85) |
| Gender (male/female) | 27/20 |
| Prognostic factors | |
| Age > 60 | 23 (48) |
| ECOG performance status >2 | 7 (14) |
| LDH > 1 x upper limit of normal | 32 (68) |
| Two or more extranodal sites | 9 (19) |
| Ann Arbor stage III/IV | 31 (66) |
| Double expressor lymphomas | 4 (8) |
| Double hit lymphomas | 1 (2) |
| GCB subtype | 24 (51) |
| Non-GCB subtype | 23 (49) |
| R-IPI score | |
| Poor risk | 21 (45) |
| Good risk | 26 (55) |
| Treatment | |
| RCHOP | 42 (89) |
| R-EPOCH | 5 (11) |
Table 1: Patient characteristics.
Patient outcomes
The median duration of follow up was 25 months. Relapses occurred in 7 patients at a median of 7 months (3-60) after diagnosis. Four patients died at a median of 13.5 months (3 – 52). Nine patients had an event within 24 months of diagnosis.
Prognostic value of TMTV and TLG
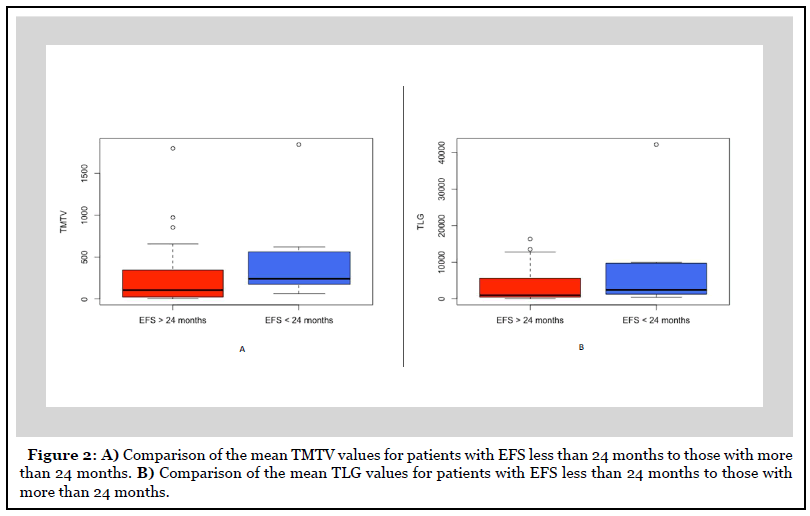
There were nine patients with an EFS of less than 24 months. There was no difference in mean TMTV in patients with EFS less than 24 months versus those more than 24 months (477.89 versus 252.25, p=0.29) (Figure 2). Similarly, the mean TLG was also no different for patients with EFS less than 24 months compared to those more than 24 months (8281.5 versus 3628.4, p=0.32).
The patients were divided into high and low pretreatment TMTV groups based on cutoffs obtained from prior studies [6,7]. In the first analysis, patients were divided into TMTV high and low group with a pretreatment cut off value of 550. There was no difference in EFS at 24 months between the high and low TMTV groups (62.5% versus 84.6%, p=0.18) (Figure 3). However, PFS was worse for those in the high TMTV group (37.5% versus 84.6%, p = 0.02), which is consistent with the observations made by Sasanelli et al. [6]. For the second analysis, patients were divided with a pretreatment cut off value of 300. Using this cutoff, there was no difference in EFS at 24 months (73.3% versus 84.3 %, p=0.50) and PFS (60% versus 84.3%, p=0.1) between the high and low TMTV groups. Multivariate analysis using Cox regression model failed to show COO and TLG as an independent predictor of EFS at 24 months.
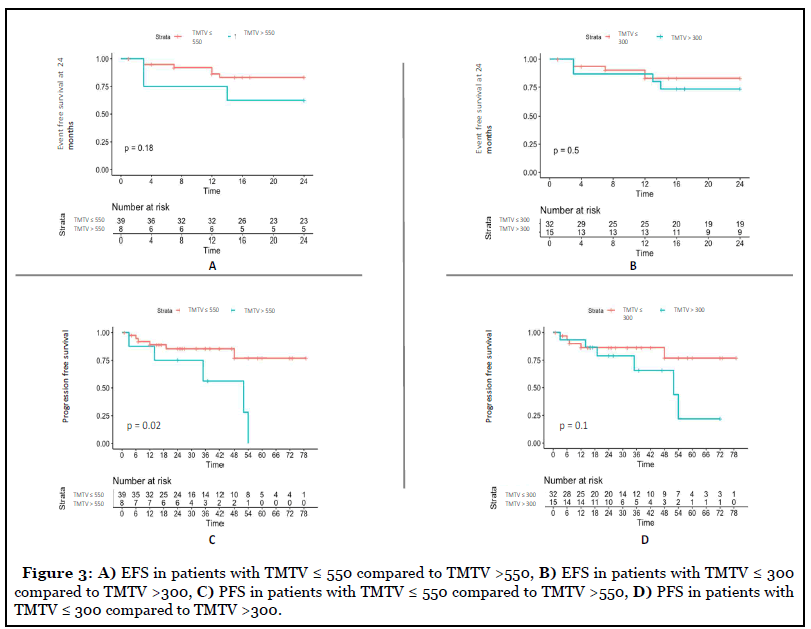
When analyzed for OS, patients with a pretreatment TMTV value of more than 550 had poor OS (p=0.1) but did not meet the predefined threshold of statistical significance, which is possibly due to small sample size. The COO classification of DLBCL using Hahn’s algorithm also did not have any impact on TMTV, TLG, EFS at 24, PFS, and OS.
Discussion
This single-center, retrospective study of 47 patients showed that pretreatment TMTV was not predictive of EFS at 24 months but is predictive of PFS when a cut-off of 550 is used. It also failed to demonstrate the predictive value of TLG and COO on EFS at 24 months.
The measurement of tumor burden is an essential component of prognostic tools. Ann Arbor staging has been the most widely used system for assessing tumor burden. The advent of PET scan has led to improvements in assessing tumor bulk by the ability to delineate viable tumor from necrotic tissue. TMTV is a PET scan derived metric which estimates metabolically viable tumor bulk and has led to its use as a prognostic marker. However, there are few challenges with its use. There have been multiple studies demonstrating its prognostic significance; however, each using a different cut off values to define TMTV high and low groups. There was no standardized definition for determining the volume of interest. Song et al. used SUV of >2.5 as a contouring border, whereas Sasanelli et al. and Cottereau et al. defined the volume of interest using the 41 % SUVmax method [6-8]. Lastly, the lack of prospective studies has led to the failure of its implementation in clinical practice.
In our study, we determined the VOI using the 41% SUVmax method as determined by the European procedure guidelines version 2. [9]. We evaluated both cutoffs, 550 and 300, to determine its prognostic significance on EFS at 24 months. The pretreatment TMTV and TLG were not predictive of EFS at 24 months, and there was no difference in the mean TMTV and TLG. When we used the cut-off of 550, patients with high TMTV had similar EFS at 24 months compared to the low TMTV group. However, PFS was inferior in the high TMTV group. This lack of difference in EFS at 24 months with a difference in PFS in our study, is possibly due to late relapses that were observed in patients with TMTV values more than 550. There was no difference in EFS at 24 months and PFS when a cut off 300 was used. These observations, in our study, are different from the observations made by Sasanelli et al. and Cottereau et al., where the Kaplan Meier survival curves begin to diverge as soon as 12 months after diagnosis for patients with higher pretreatment TMTV. These differences are because our study had a small number of patients from a single center. A lower relapse rate was observed in our patient sample compared to historical controls (14% versus 30-40%) possibly attributed to a shorter duration of follow-up. This lower relapse rate has resulted in discordant observations in some of our findings compared to other similar studies.
The limitation of our study can be overcome in the future by increasing the sample size with patients from multiple centers. In addition, combination with other measures of assessment of tumor burden such as circulating cell-free DNA or circulating tumor DNA will result in building a robust model for assessing tumor bulk. Such a model will refine our prognostic capabilities with its eventual incorporation into prospective clinical trials and clinical practice.
Author Contributions
MN designed the study, acquired the data and drafted the manuscript
SQ acquired the data
DD analyzed de-identified data and provided figures for the data
RJ analyzed the PET data
GG revised the manuscript and analyzed PET data
References
2. Sehn LH, Berry B, Chhanabhai M, Fitzgerald C, Gill K, Hoskins P, Klasa R, Savage KJ, Shenkier T, Sutherland J, Gascoyne RD. The revised International Prognostic Index (R-IPI) is a better predictor of outcome than the standard IPI for patients with diffuse large B-cell lymphoma treated with R-CHOP. Blood. 2007 Mar 1;109(5):1857-61.
3. Zhou Z, Sehn LH, Rademaker AW, Gordon LI, LaCasce AS, Crosby-Thompson A, et al. An enhanced International Prognostic Index (NCCN-IPI) for patients with diffuse large B-cell lymphoma treated in the rituximab era. Blood. 2014 Feb 6;123(6):837-42.
4. Cheson BD, Fisher RI, Barrington SF, Cavalli F, Schwartz LH, Zucca E, et al. Recommendations for Initial Evaluation, Staging, and Response Assessment of Hodgkin and Non-Hodgkin Lymphoma: The Lugano Classification. Journal of Clinical Oncology. 2014 Sep 20;32(27):3059.
5. Maurer MJ, Ghesquières H, Jais J-P, Witzig TE, Haioun C, Thompson CA, et al. Event-Free Survival at 24 Months Is a Robust End Point for Disease-Related Outcome in Diffuse Large B-Cell Lymphoma Treated With Immunochemotherapy. Journal of Clinical Oncology. 2014 Apr 1;32(10):1066.
6. Sasanelli M, Meignan M, Haioun C, Berriolo-Riedinger A, Casasnovas R-O, Biggi A, et al. Pretherapy metabolic tumour volume is an independent predictor of outcome in patients with diffuse large B-cell lymphoma. European Journal of Nuclear Medicine and Molecular Imaging. 2014 Nov 1;41(11):2017-22.
7. Cottereau AS, Lanic H, Mareschal S, Meignan M, Vera P, Tilly H, et al. Molecular profile and FDG-PET/CT total metabolic tumor volume improve risk classification at diagnosis for patients with diffuse large B-cell lymphoma. Clinical Cancer Research. 2016 Aug 1;22(15):3801-9.
8. Song MK, Chung JS, Shin HJ, Lee SM, Lee SE, Lee HS, et al. Clinical significance of metabolic tumor volume by PET/CT in stages II and III of diffuse large B cell lymphoma without extranodal site involvement. Annals of hematology. 2012 May 1;91(5):697-703.
9. Boellaard R, Delgado-Bolton R, Oyen WJ, Giammarile F, Tatsch K, Eschner W, et al. FDG PET/CT: EANM procedure guidelines for tumour imaging: version 2.0. European journal of nuclear medicine and molecular imaging. 2015 Feb 1;42(2):328-54.