Abstract
It is believed that the proper distance between the grafting location and the stenosis location and the appropriate angle of graft or transplantation in the blocked artery of the heart are two important factors in the removal or decrease of reappearance and re-development of intimal hyperplasia (IH), blood clotting, and re-blockage of the surgical artery. In the present study, a 3-D geometry of the host coronary artery as non-elastic with 75% symmetric axial cross-sectional area reduction is considered. The main assumptions were incompressible, laminar, steady-state, Newtonian, and non-Newtonian (with Herschel Bulkley model) blood flow. The 3-D Navier-Stokes equations coupled with the non-Newtonian constitutive model were solved numerically using a finite volume method with the procedure of the SIMPLE program. Shear stress distribution was obtained on the areas of potential re-obstruction and the occurrence of IH such as the Toe, Heel, arterial bed, suture location, and graft artery walls. Based on the results, the distribution of wall shear stress near the Heel, Toe location, and the intersection of the host and graft arteries suddenly increased dramatically. Wall shear stress (WSS) distribution was obtained in the areas of hyperplasticity re-incidence for some important anastomosis angles of grafted arteries, i.e. α=35°,45°,65°,75°. In addition, the increase in the angle of the graft artery caused a sharp increase in the shear stress on the area after the graft and the arterial bed in front of the branching region, and the shear stress decreases in the pre-graft region. Therefore, the excessive angle of the graft artery can cause damage to the arterial endothelial cells in the surrounding suture region.
Keywords
Anastomotic angles, Bypass graft surgery, Stenosis, Shear stress distribution
Introduction
Atherosclerosis, caused by the formation of disease in the body's arteries, can cause a heart attack or cardiac arrest [1]. Bypass graft surgery and angioplasty balloon are the most important methods of treatment in recent years. For various reasons, Bypass graft surgery has recently been common in the world [2]. Coronary artery bypass graft surgery is the preferred treatment for high-risk patients of Coronary artery disease, which can effectively relieve the symptom of ischemic heart disease and angina [3,4]. The most common disadvantage of this type of surgery that appears due to the occurrence of intimal hyperplasia (IH) and thrombosis or blood clotting is early thickening and restenosis in the graft artery [5]. The Heel (behind the graft arch) and Toe (front part of the graft arch), anastomosis or suture line, and arterial bed in front of the branching region are more likely to be exposed to intimal hyperplasia than other places [2,6]. It is thought to have hemodynamic effects on blood flow, in particular, the wall shear stress (WSS) due to the distance from the location to the graft location, as well as the graft angle, in the bypass graft surgery, has a significant role in hyperplasia [7-10]. Efforts have been made to determine the role of hemodynamic blood on hyperplasia experimentally and numerically.
Researchers in biomedical engineering and scientific field have explored extraordinary results in the flow of non-Newtonian fluid from different geometries because of its ever-increasing biomedical different industrial applications. Due to this significance, the authors [11-13] discussed the non-Newtonian flow characteristics over various geometries and physical effects. With this, they concluded that non-Newtonian fluids tend to control the flow behavior. Perktold et al. [14] and Lee et al. [15] obtain the shear stress on the artery wall in the graft location with the assumption of a Newtonian blood flow. Chen and Leo [16] examined the blood flow by assuming non-Newtonian in the arterial region. Lee and Liang [15], Kabinejadian et al. [17], Wang et al. [18] and Leuprecht et al.[18] have done other studies in this regard. Atif Azad et al. used a mathematical model and numerical simulation to evaluate the effects of graft-artery junction geometries on the shear stress distribution of the wall (WSS) in the bypass graft [19,20]. Chen et al., by studying the numerical value of blood flow in a bypass graft, special attention was paid to the non-Newtonian effect of blood on changes in the distribution of WSS and its role in studying the hemodynamic effects of blood flow in arterial grafts and used the Carreau-Yasuda model for blood shear behavior [21]. More recent advances in Bypass graft surgery developed by Azuma et al. [22] and it's past, present, and future status have been highlighted by Pashneh-Tala et al. [23].
Motivated by the above evidence an attempt is made to study the effect of the various physical parameters of the flow velocity and shear stress are investigated for the variations in yield stress and stenosis. This research is done on basis of fundamental hydrodynamic theories which investigated the rheological behavior of blood in the artery. To our knowledge in the literature, it has been observed that, in some experimental studies done by Whitemore [24], Forrestor and Young [25], Shukla et al. [12], Jain et al. [13], and Neeraja et al. [26] on blood flows but in different geometries of artery shapes. In the present study, the effect of different anastomosis angles of grafted arteries, i.e. α=35°,45°,65°,75°, as well as the effect of the distance from the graft location to the shear stress distribution of potential re-obstruction and the occurrence of IH such as Toe, Heel, arterial bed, suture location, and graft artery walls was obtained. All results were considered in a steady state and calculated for both Newtonian and non-Newtonian models.
Assessment of blood flow in the coronary arteries is highly challenging because of their small size, tortuosity, and high mobility. In addition, flow velocities are low. The average radius of the coronary arteries is about 1.0 to 1.5 mm. Although the mean Reynolds number in the coronary arteries is about 150 under resting conditions [27], under the pathological situation of a stenosis present, the mean Reynolds number can be even as small as 50 [28]. So our calculations are based on the laminar flow. To our knowledge of the literature, it has been observed that, in some experimental studies done by Whitemore [24], Forrestor and Young [25], Shukla et al. [12], Jain et al. [13], and Neeraja et al. [11] on blood flows in tubes of smaller diameters indicates that under certain flow conditions mainly at low shear rate blood behaves like a non-Newtonian fluid. The non-Newtonian behavior of blood is due to the suspension of RBCs in plasma. An analysis by Kapur [29] indicates that Casson fluid model and Herschel-Bulkley fluid (H-B fluid) model have non-zero yield stress and exhibits a non-Newtonian fluid behavior. Hence, these models are more suitable to study blood flow in narrow arteries. The arterial blood flow of Newtonian fluids has been studied by quite a few researchers [30-34]. However, a flattened velocity profile has been obtained especially when dealing with flow in many experiments suggesting a plug flow in the core region. Therefore, it is appropriate to represent blood as a non-Newtonian fluid which models this velocity profile. Aroesty and Gross [35,36] and Chaturani and Ponnalagar Samy [37] have studied the blood flow of Casson’s fluid through stenosed arteries. In this paper we have extended their result for steady flow of Herschel–Bulkley fluid through a stenosed artery, as it is noticed that blood obeys Casson’s equation only for moderate shear rate and the Herschel–Bulkley equation represents fairly closely what is occurring in blood [38]. Chaturani et al. [39] have mentioned that for artery diameter of about 1.0 mm blood behaves like Herschel–Bulkley fluid rather than power-law and Bingham fluids. Iida [40] reports “The velocity profile in the arterioles having a diameter less than 0.1 mm are generally explained fairly by the two models. However, velocity profiles in the arterioles whose diameters are less than 0.065 mm do not conform to the Casson model but can still be explained by Herschel–Bulkley model. Hence, we felt that it is appropriate to model blood as a Herschel–Bulkley fluid than Casson fluid in this paper.
Blood and its rheological properties
Human blood is a suspension of billions of cells in an aqueous solution called plasma. Plasma is a Newtonian fluid that has a viscosity of 1.2 cp T = 37°C. Blood viscosity is heavily influenced by the amount of hematocrit (cellular components of the blood) in the plasma, and usually, in the Newtonian state, about 3.5 times the viscosity of water ( 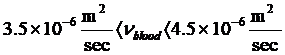 ) is considered. The blood behavior of the upper shear rates is Newtonian. However, its viscosity decreases with decreasing shear rate. Therefore, the relation between
  and
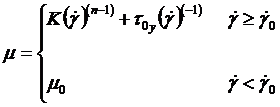
and  strongly changed and nonlinear. The Herschel non-Newtonian Bulkley model definition [41] is
  with a viscosity of:
Modeling
In this paper, the blood flow in the host artery (the main artery or the artery that is connected to the graft or transplantation) and the graft artery (secondary artery) in a three-dimensional, laminar, incompressible, steady-state, Newtonian and non-Newtonian (with Herschel Bulkley model), the walls of the arteries are rigid, imperturbable and associated with symmetric axial stenosis in the host artery. Meanwhile, the viscosity and density of blood in the Newtonian state are assumed to be 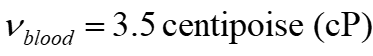 and
and 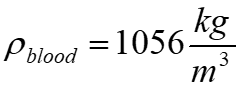 respectively. As mentioned earlier, a graft is used to bypass the occluded or stenosed region. A typical graft is illustrated in Figure 1 where we see the proximal anastomosis or the junction where the graft begins and the distal anastomosis, i.e., the junction where the graft rejoins the artery after bypassing the stenosis.
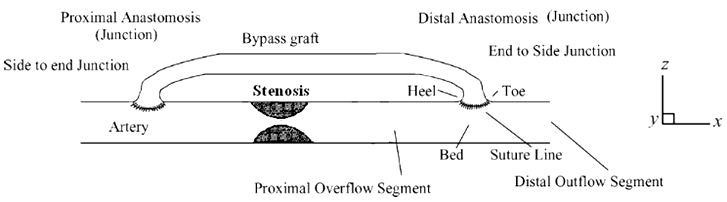
Figure 1. An illustration of a bypass graft.
As shown in Figure 2 simplified anastomosis model is represented as the intersection of two hollow cylinders. The general schematic diagram of the problem and other important regions such as Toe, Heel, host Artery bed, sutured line, and graft angle are presented.
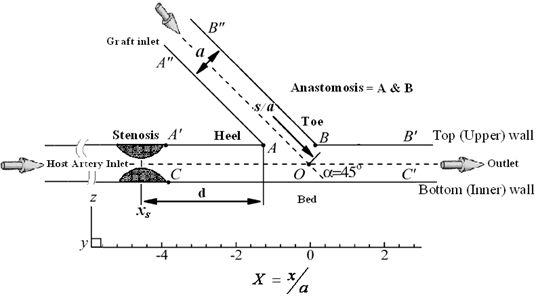
Figure 2. Schematic diagram of a distal vascular anastomosis in the x_z plane of symmetry view and other important areas such as the Toe, Heel, Anastomosis, Host artery bed, its walls, and grafting angle.
The characteristics of the three-dimensional geometric model used in this study are as follows:
- The length of the host artery (main branch) is 80 mm, the length of the graft artery (sub-branch) is 25 mm, and the graft artery location is selected up to the entrance of the host artery to 20 mm. The geometry has two active inputs and is an active output of the main output, and the other walls are assumed to be rigid or non-elastic. The flow is entered from the left of the model and goes out to the right. The mean velocity at the outlet of the host artery is approximately 0.19 m/s (the ratio of the entrance flow rate in the host artery per the entrance flow rate in the graft is 0.5).
- As reported by Ofili et al. [42], the diameter of the host artery and the graft artery is the same approximately and considered equal to 3 mm (i.e., a=3.0 mm).
- To examine the effects of the stenosis distance (
 ) on the graft artery, the angle of intersection of the host artery and the graft artery is fixed and considered equal to 45 (i.e., α=45°).
 - Lee and Fang's model [43] has been used to describe the profile and geometry of the stenosis in a non-dimensional form that develops symmetrically about the artery axis where the host artery has a 75% severity stenosis. According to this model:
Where  and
and  are the radius of the host artery with and without stenosis respectively (i.e.,
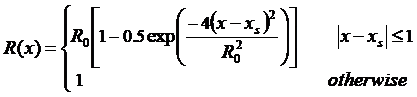
 ), and represents the position of stenosis in the host artery. Meanwhile, the distance between the heel position of the graft and the center of the stenosis is
  . In Figure 3, the schema of the important arterial region, Toe, and Heel is also presented.
Figure 3. Illustrations of the important regions of the grafted artery (Toe, Heel).
Governing equations
It will be assumed that the flow of blood in the host and graft artery is governed by a continuity equation for an incompressible fluid and the Navier–Stokes equations, as follows:
Continuity equation:
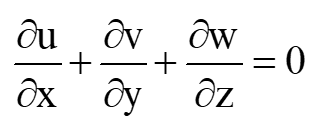 (1)
(1)
Momentum equation in x-direction:
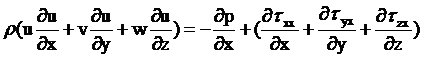 (2)
(2)
Momentum Equation in the y-direction:
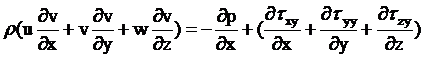 (3)
(3)
Momentum Equation in the z-direction:
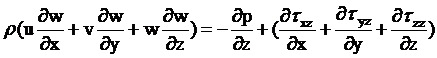 (4)
(4)
Also, the Non-Newtonian model Herein employed is Herschel-Bulkley. The model encapsulates the behaviors of many of the other blood models:
 (5)
(5)
Where respectively  the Yield stress,
  the Consistency index, the shear rate, and
  the Power law index (or flow behavior index). The values of these parameters are employed from reported data based on the blood fluid and SI units
  ,
,  ,
,  [44,45].
Writing the dimensionless variables in the below form allows with flexibility to use the Navier–Stokes equations.
 (6)
(6)
Where  is the radius of the arteries; d the distance of the stenosis to the position of the suture heel,
  the reference pressure,
  is the mean velocity and
  is also shown in Figure 2.
Calculation methods
Initially, the motion field in the host and graft artery meshed. A finite-volume procedure is used by the Discretized solver based on a SIMPLE algorithm to solve continuity and Momentum equations numerically. The relaxation factor for pressure is 0.3 and for momentum is 0.7. The convergence criterion is considered for the continuity and momentum equations10-3. It is assumed that the grid compression near the walls is more than in other regions. Due to the blood flow near the stenosis being very important and complex, we need a very fine grid in this region. Far away from the stenosis, the flow is comparably simple, so we can use the coarse grid. An unstructured grid with hexagonal cells is applied. Once the computations are done and the desired properties of fluid do not vary concerning different mesh elements then it represents that further change in elements doesn't vary our results it is selected as Independent Grid. After analyzing the independence of the Grid, 90,000 cells were selected as the optimal Grid.
Boundary conditions
At the entrance to the host artery, the velocity is uniform and it is assumed that the flow is perpendicular to the entrance to the artery and the graft is graft. Due to the non-slip condition, the velocity in the wall is also considered equal to zero.
Results and Discussion
The effects of various angles of bypass graft on the distribution of WSS
The results of the numerical solution of the flow field in the grafted artery and the host artery show that wall shear stress near the Heel, Toe location, and the intersection of the host and graft arteries suddenly increased dramatically.
To accurately evaluate the shear stress values in different walls of the host artery and graft artery, is defined by the following lines as shown in Figure 4:
Line  : Before the graft artery and on the upper wall (upstream of the junction)
Line  : after the graft artery and on the upper wall (downstream of the junction)
Line  : The host artery bed or on the lower wall.
Line  : On the wall closer to the upstream of the junction (Heel of a grafted artery).
Line  : On the wall closer to the downstream of the junction (toe of a grafted artery).
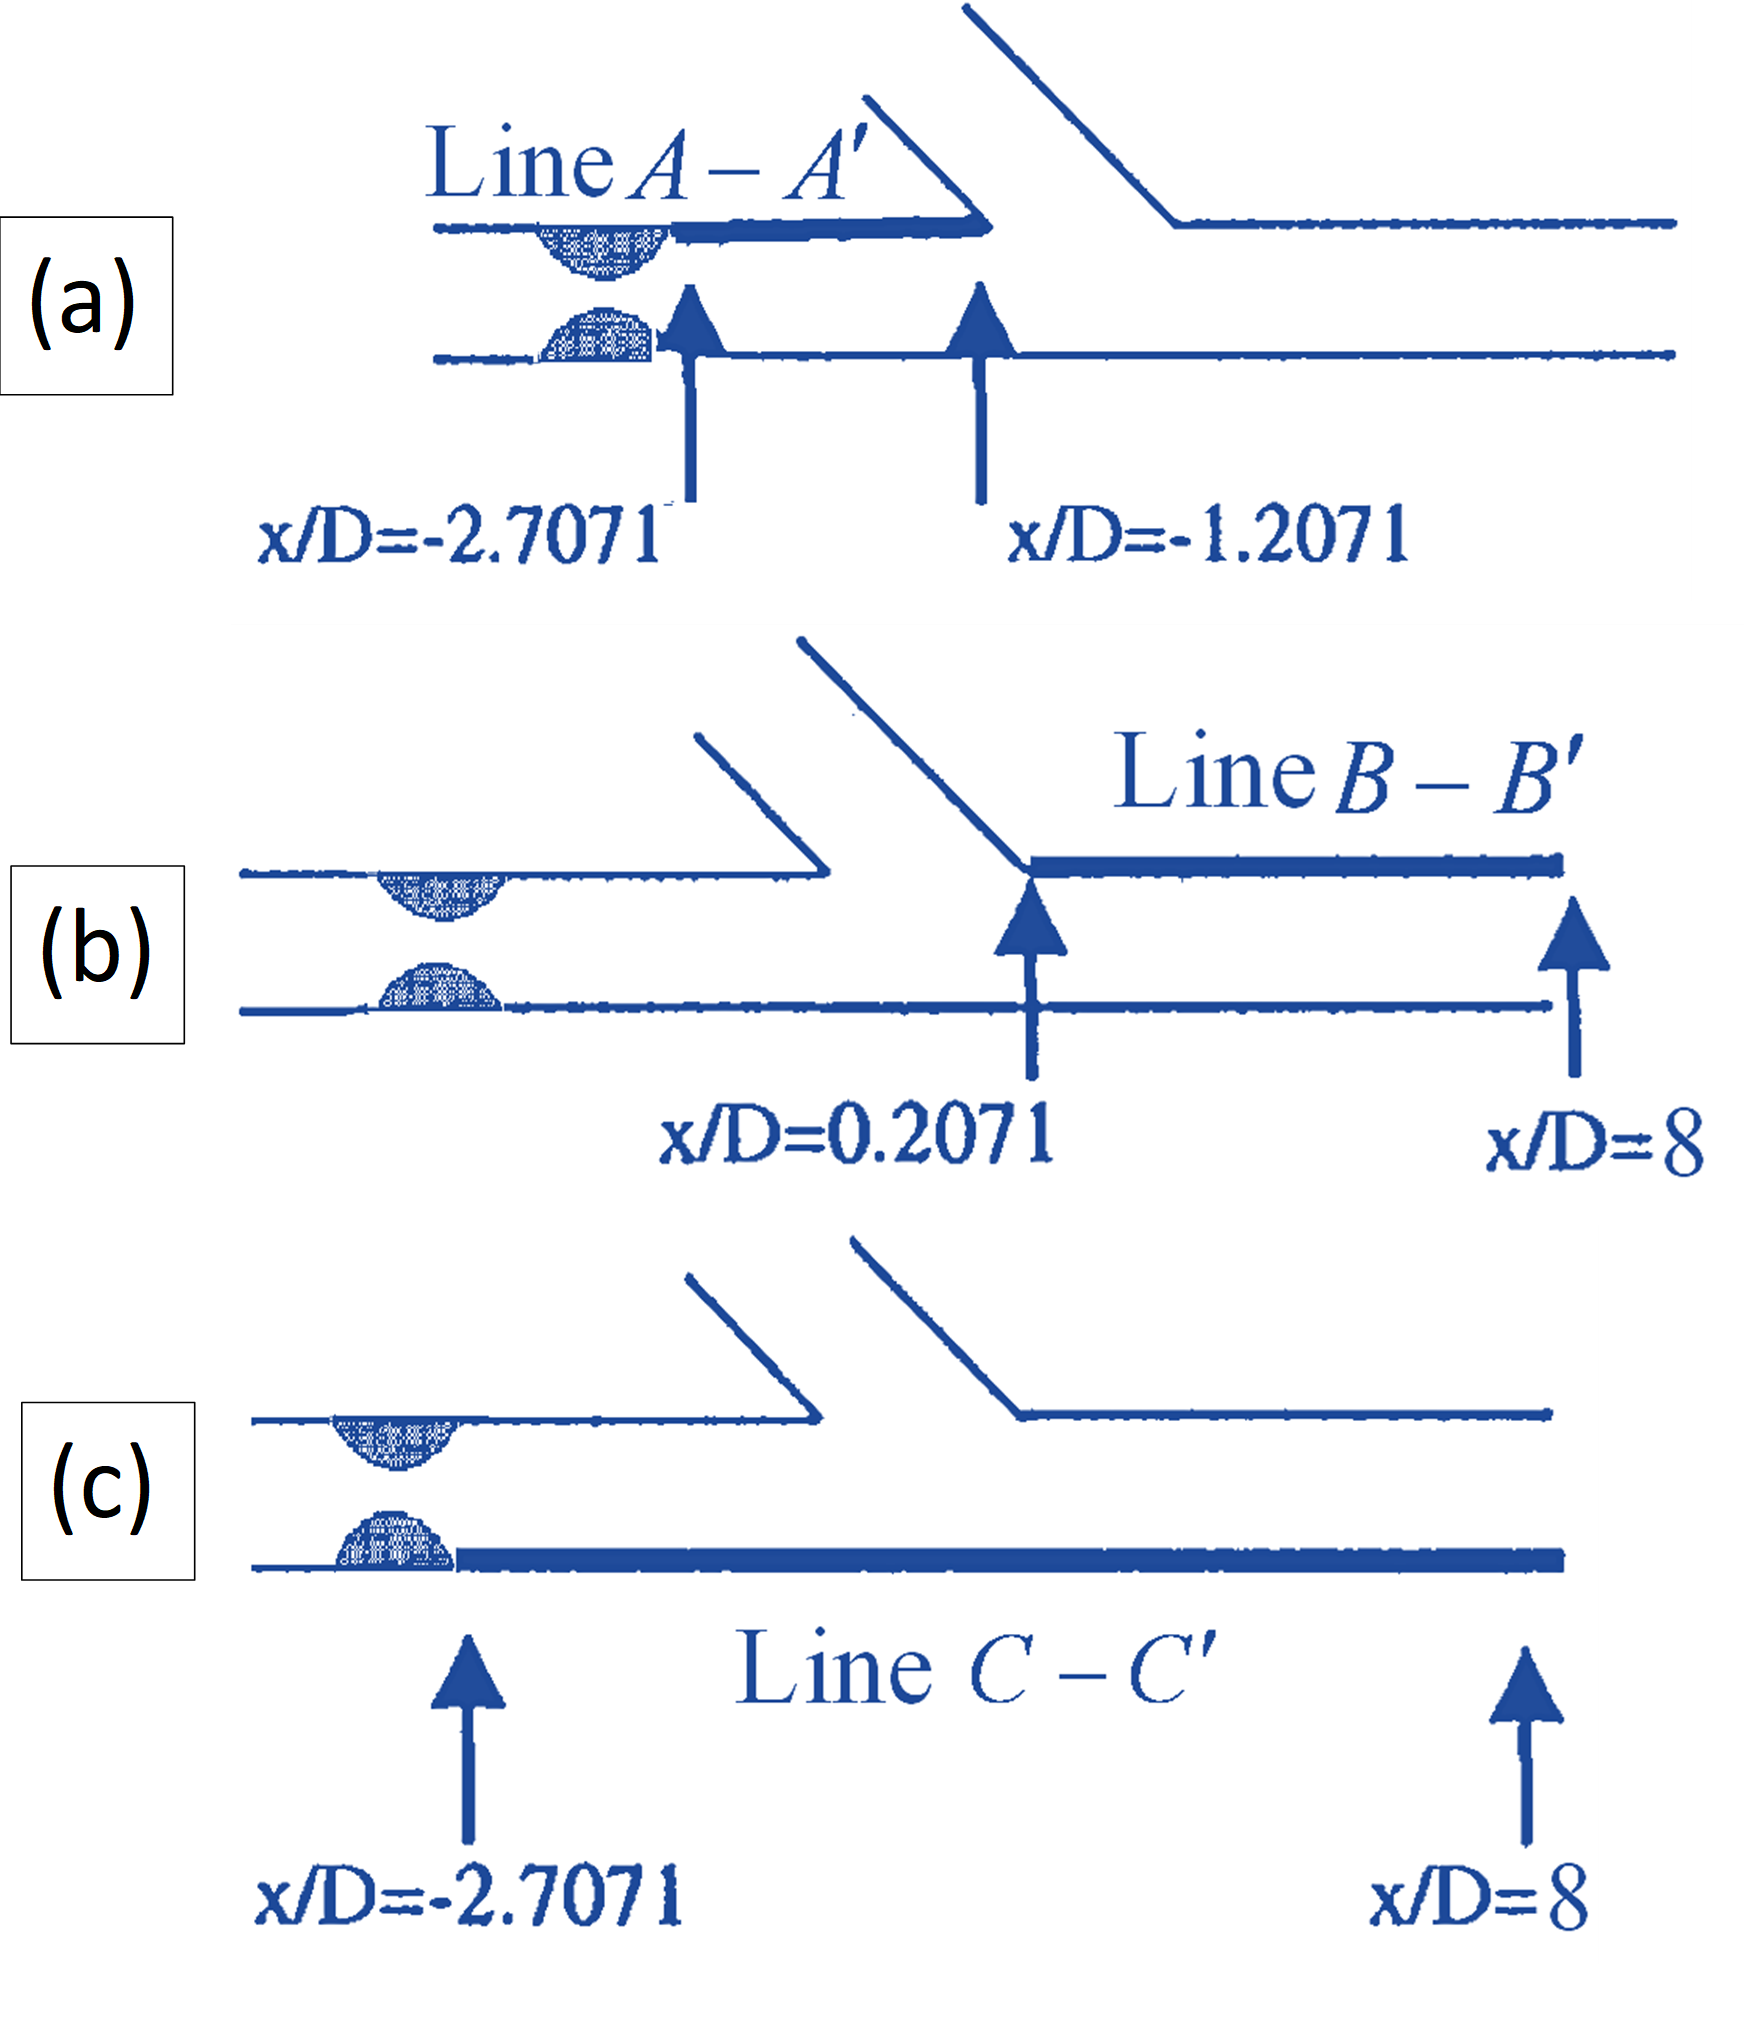
Figure 4: (a) Position of the Line , upstream of the junction; (b) the position of the Line , downstream of the junction; and (c) the position of the Line , Host artery bed.
In Figure 5, the shear stress of the wall (WSS) in the Newtonian model of blood for each of the above lines in different states (various angles of bypass graft) has been investigated. Figure 5a shows the distribution of the WSS along the line and the different angles of the bypass graft, i.e. α=35°,45°,65°,75°. As you can see from this Figure, increasing the angle of the graft reduces the amount of shear stress applied to the heel.
The decreasing intensity of the WSS distribution with angle growth in lower angles is a greater increase. In other words, the reduction of WSS for an angle increase from α=35° to α=45° is much greater than the reduction of WSS for an angle increase from α=45° to α=65° or from α=65° to α=75°. Therefore, in the Heel position, the WSS is reduced by increasing the angle.
Figure 5b shows the distribution of the WSS along the Line and the different angles of the bypass graft, i.e. (α=35°,45°,65°,75°). As can be seen from this Figure, increasing the graft angle increases the amount of shear stress applied to the toe. The increasing intensity of the WSS distribution with angle growth in lower angles is greater. In other words, the increase in WSS for an angle increase from α=35° to α=45° is much higher than the increase in WSS for an angle increase from α=45° to α=65°or from α=65° to α=75°. Therefore, in the Toe position, the WSS increases as the angle increases.
Figure 5c shows the distribution of the WSS along the Line (the host artery bed) and the different angles of the bypass graft, i.e. (α=35°,45°,65°,75°). As can be seen from this Figure, like the grafted toe, increasing the angle of the graft increases the amount of shear stress applied to the bed artery. In this part too the increasing intensity of the WSS distribution with angle growth in lower angles is greater. In other words, the increase in WSS for an angle increase from α=35° to α=45° is much higher than the increase in WSS for an angle increase from α=45° to α=65°or from α=65° to α=75°. Therefore, in the bed position, the WSS increases as the angle increases.
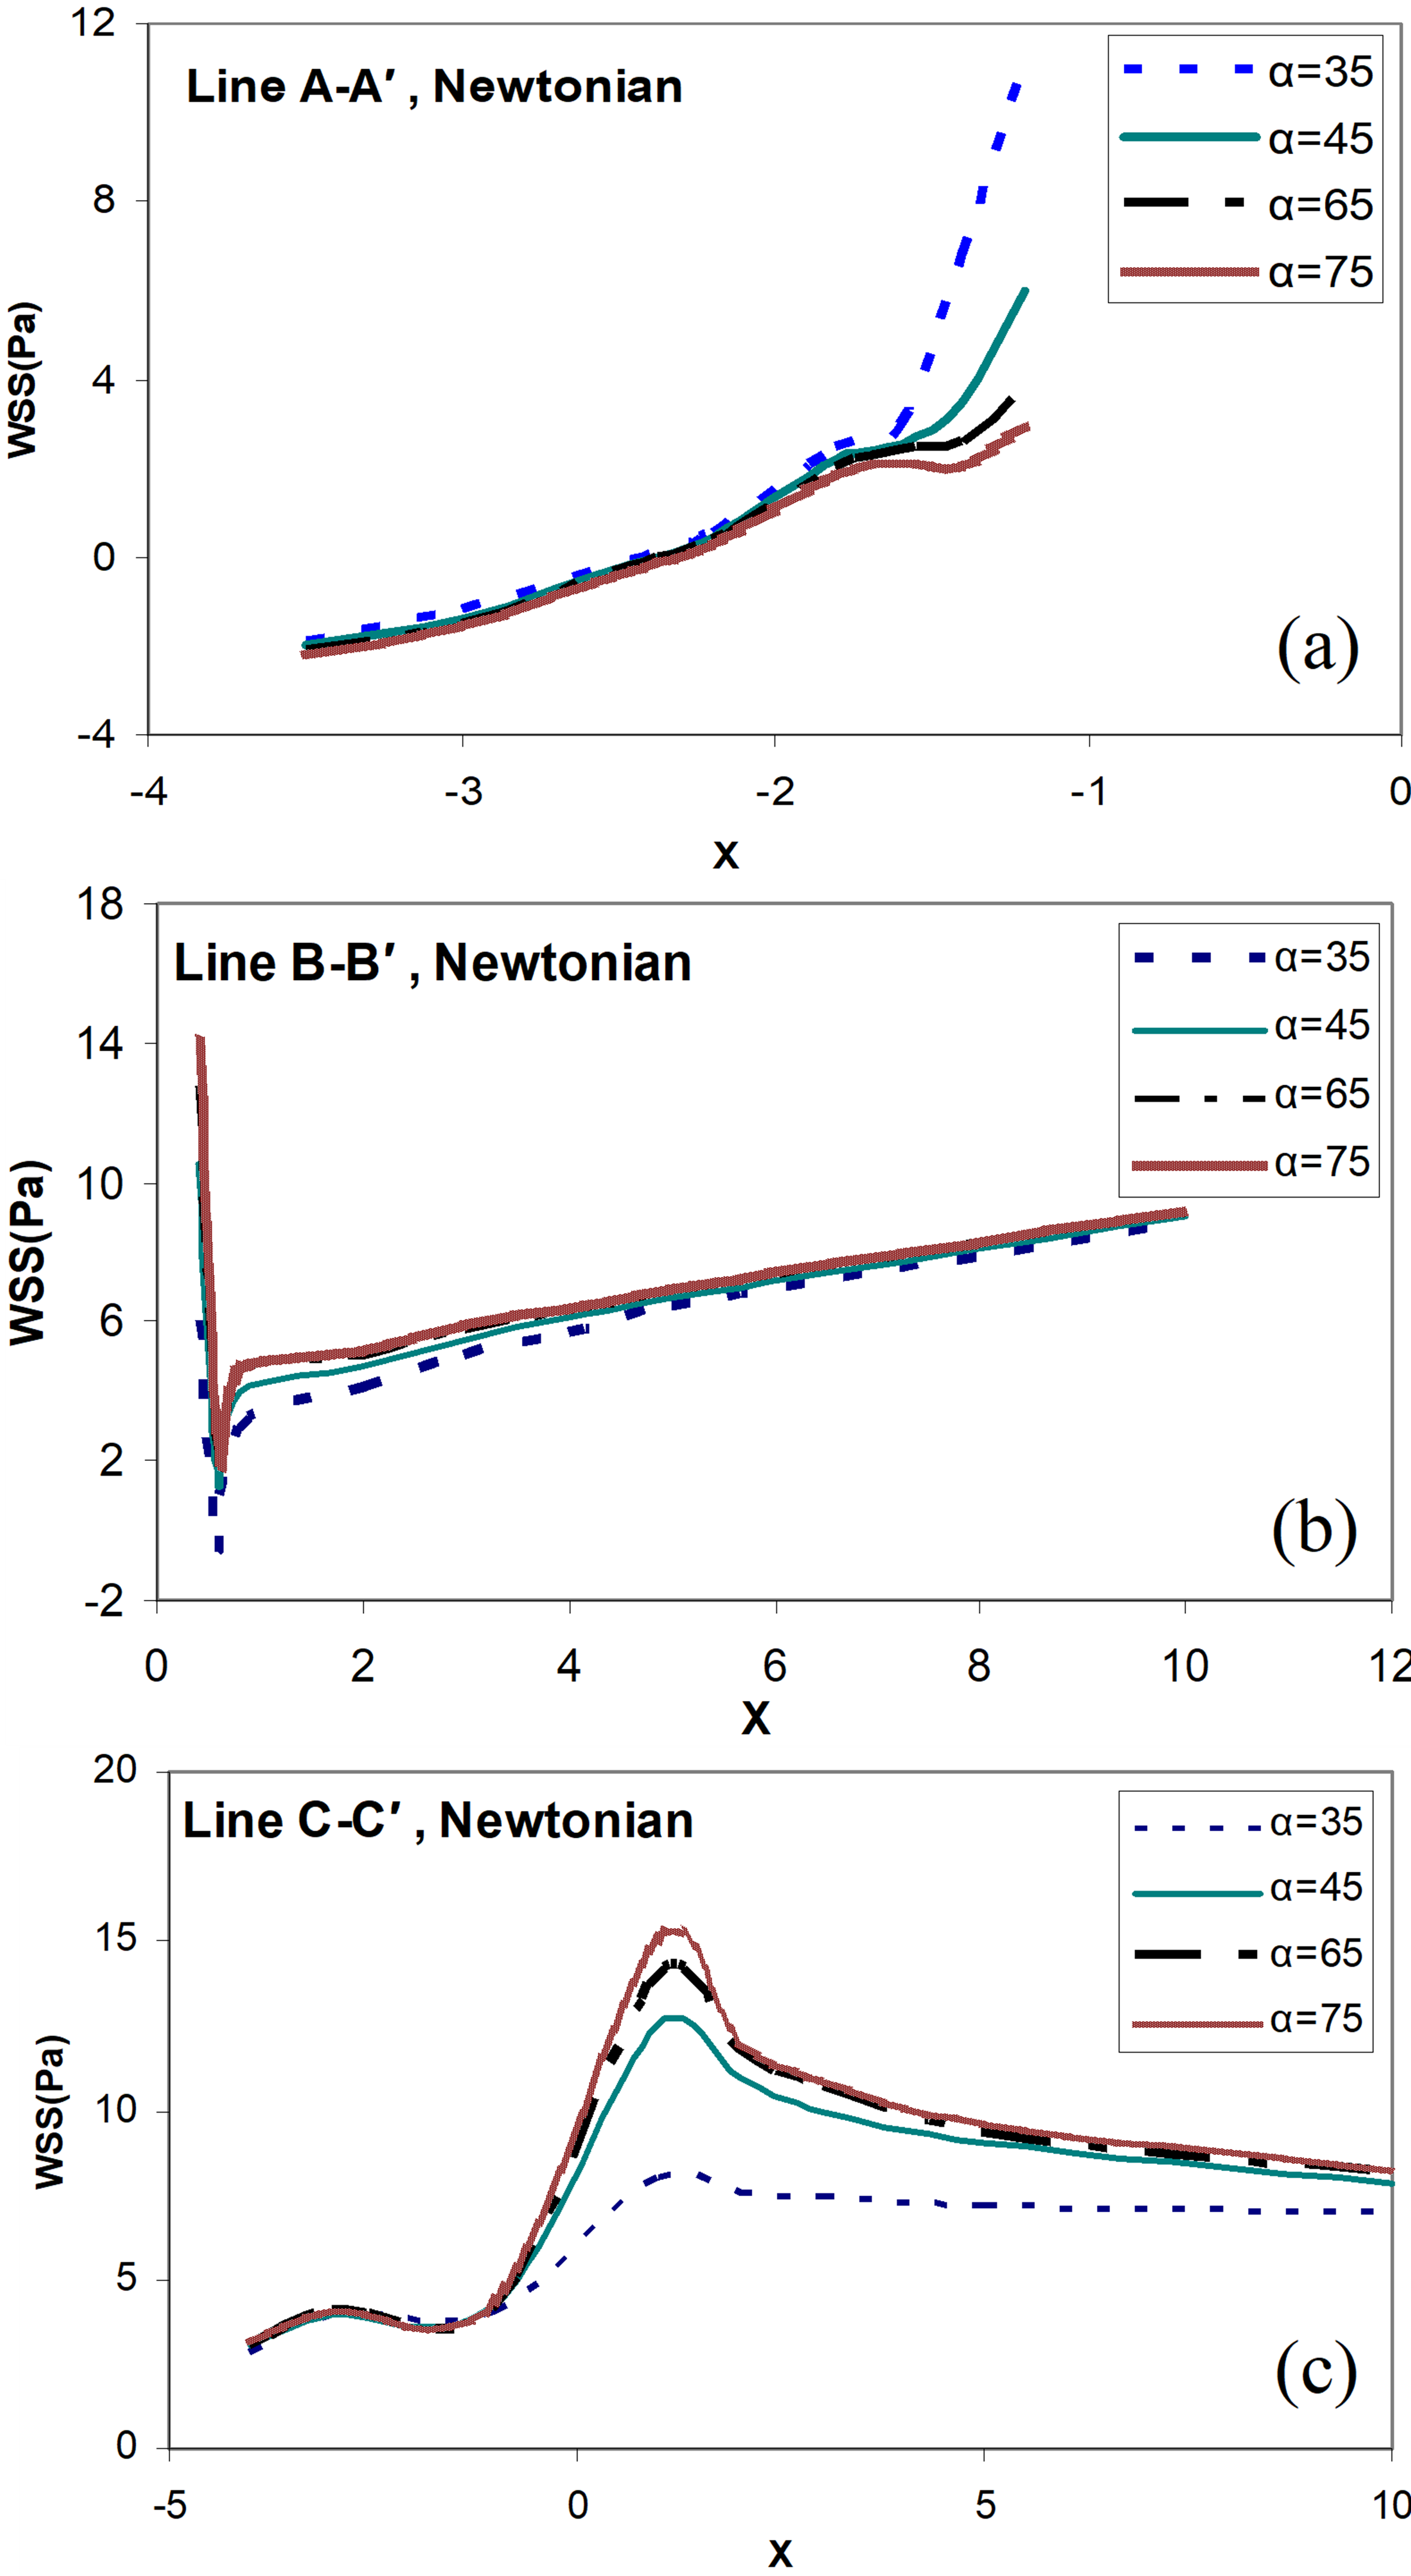
Figure 5. Distribution of the wall shear stress for different angles of bypass graft (α=35°,45°,65°,75°), and the distance between the graft and the stenosis D = 3.0, Newtonian blood flow model, and (a) along the line ; (b) along the line ; (c) along the line .
In Figure 6, the distribution of WSS is based on the Reynolds number Re for the two points A and B (Toe, Heel positions of the graft in Figure 1), and two different angles of bypass graft (α=35°, 65°) are presented. From these two diagrams, it can be seen that with increasing the flow to the graft (increasing Reynolds number Re), the wall shear stress on the two positions A and B also increases. However, the WSS distribution, with increasing Reynolds number (Re) and increasing the angles of bypass graft for the Toe position, is much greater than the Heel position.
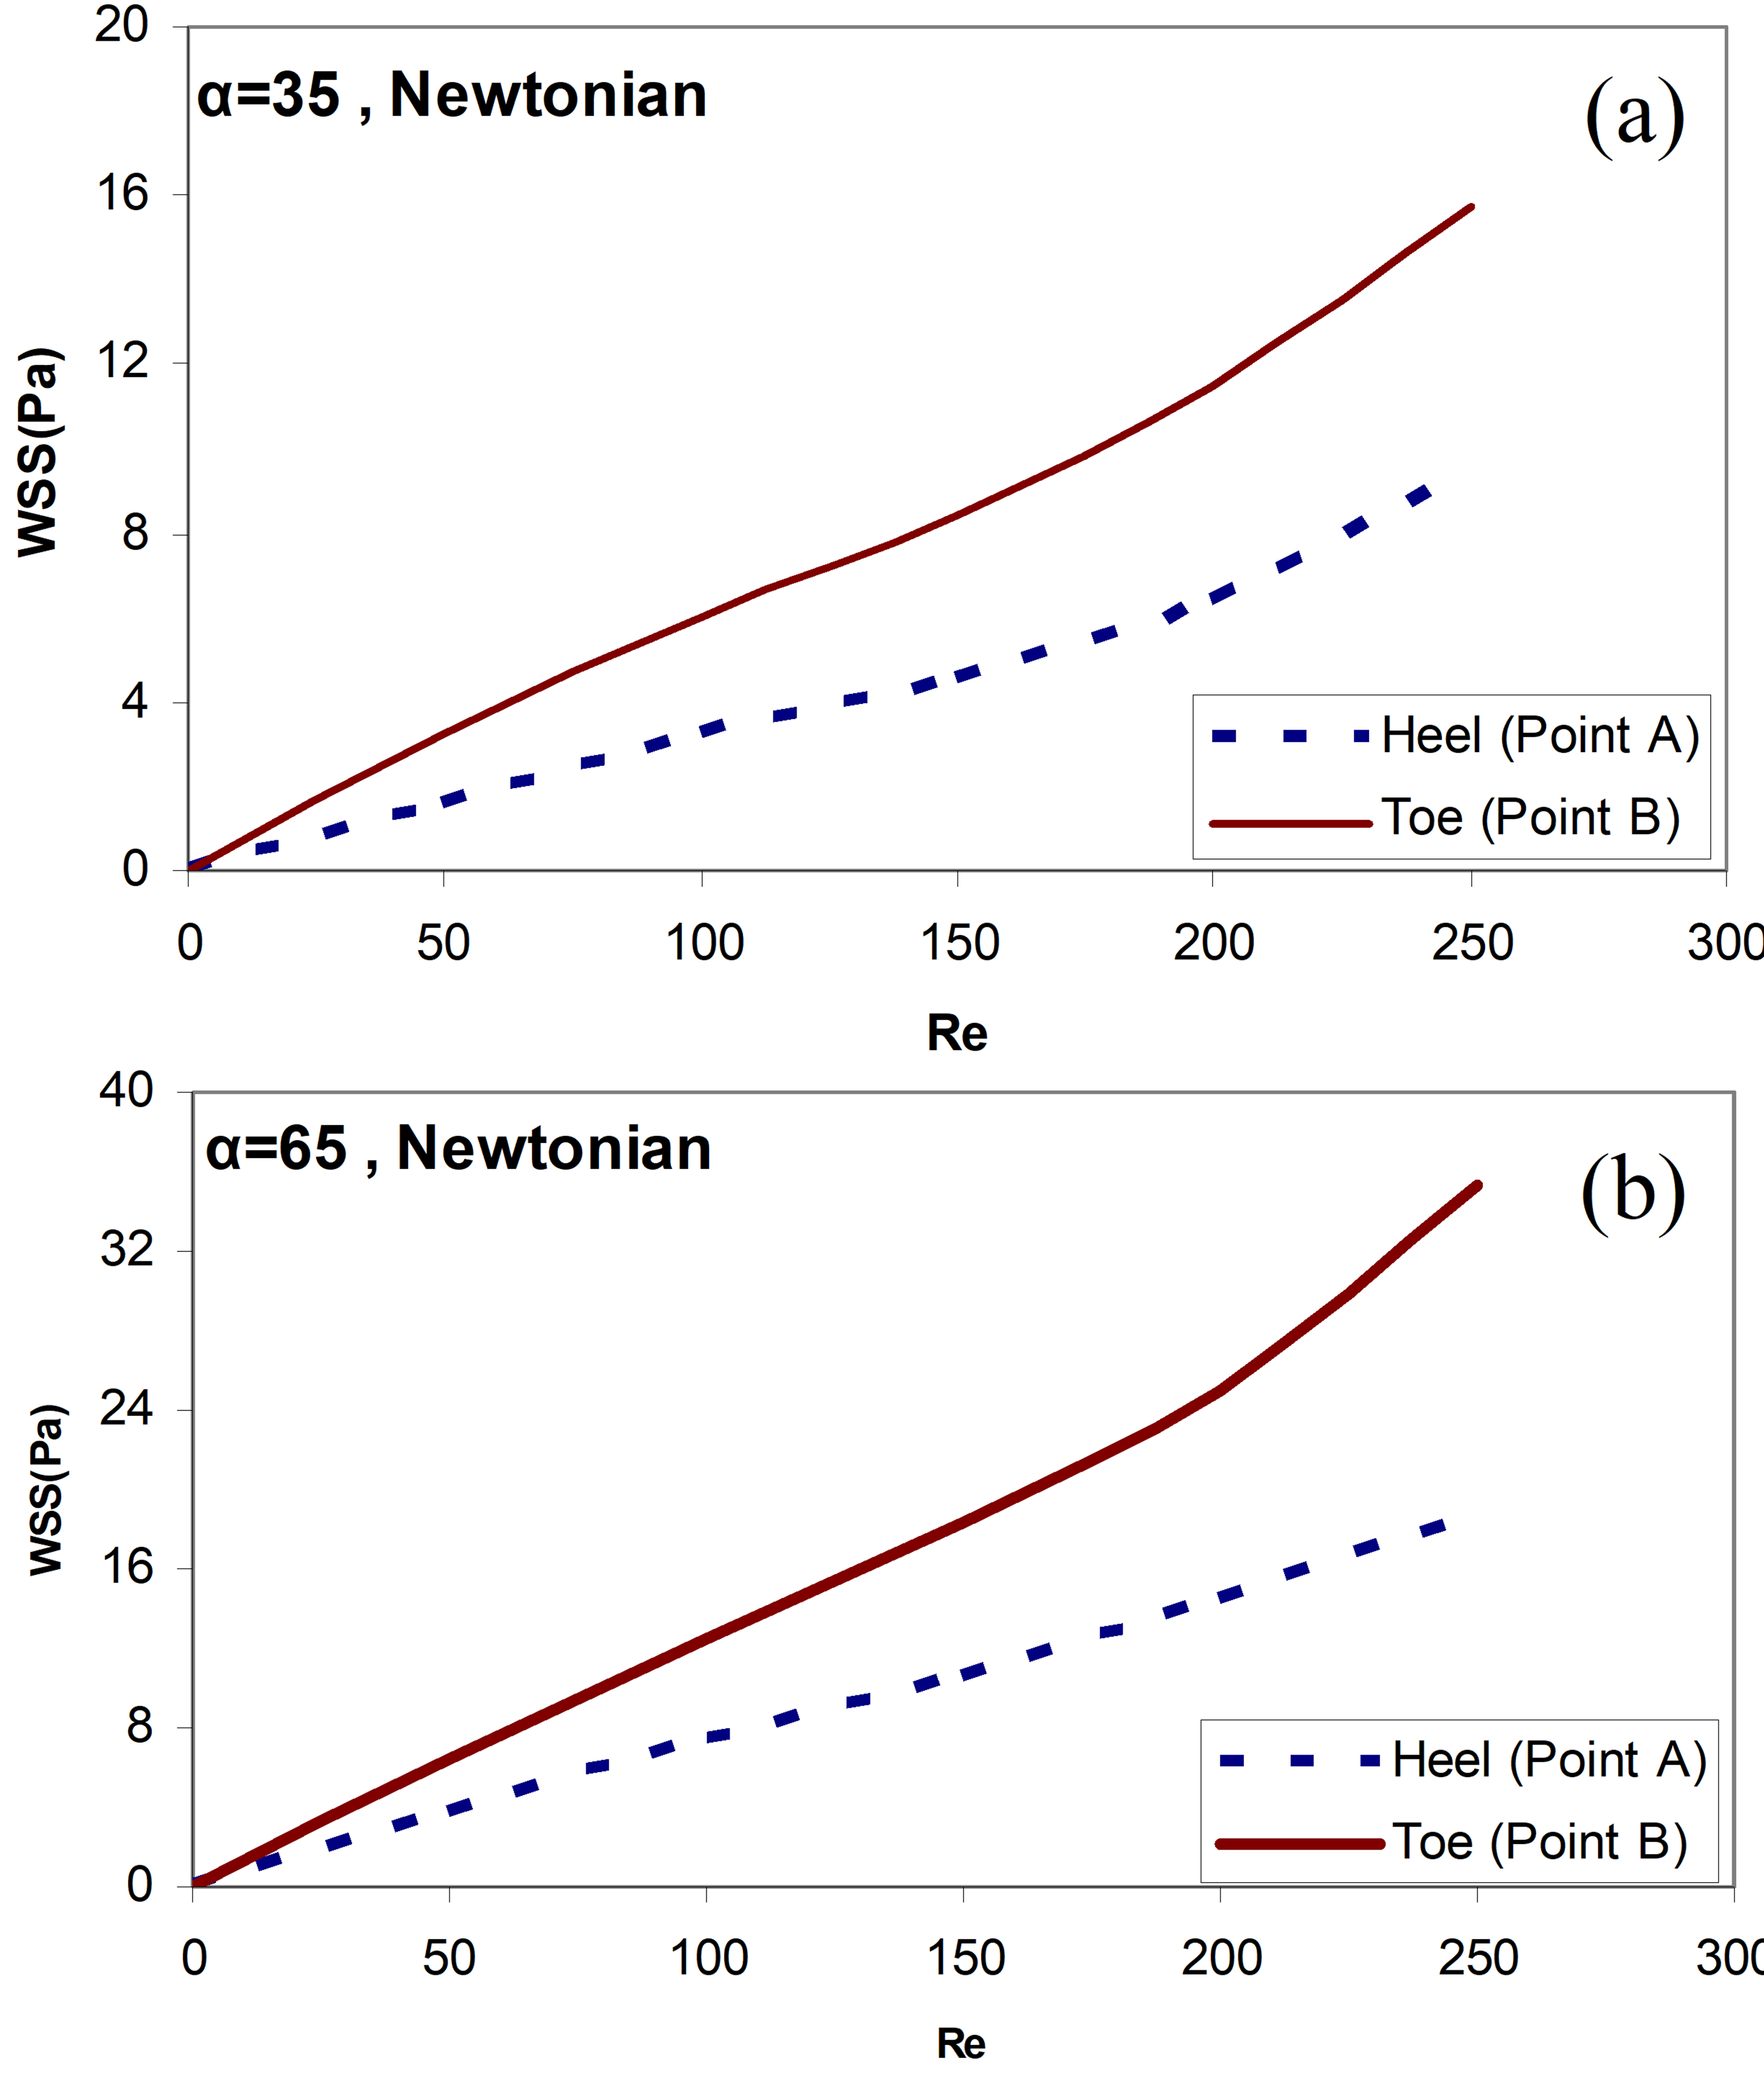
Figure 6. Distribution of the wall shear stress by Reynolds number Re for the two positions A and B (Toe positions, Heel positions of the graft in Figure 1), the distance between the graft and the stenosis D = 3.0, Newtonian blood flow model, and angles of bypass graft (a) α=35° (b) α=65°.
In Figure 7, the shear stress of the wall (WSS) for each of the above lines in various states (different angles of bypass graft) has been studied in non-Newtonian conditions. As we can see here, the increase in the angles of the bypass graft α=65°causes a sudden increase in the amount of shear stress applied to the toe of the graft and the arterial bed in front of the branching region and the shear stress decreased on the Heel of the graft. Of course, the amount of wall shear stress (WSS) on the arterial wall in the non-Newtonian model is lesser than that of the same situation in the Newtonian model.
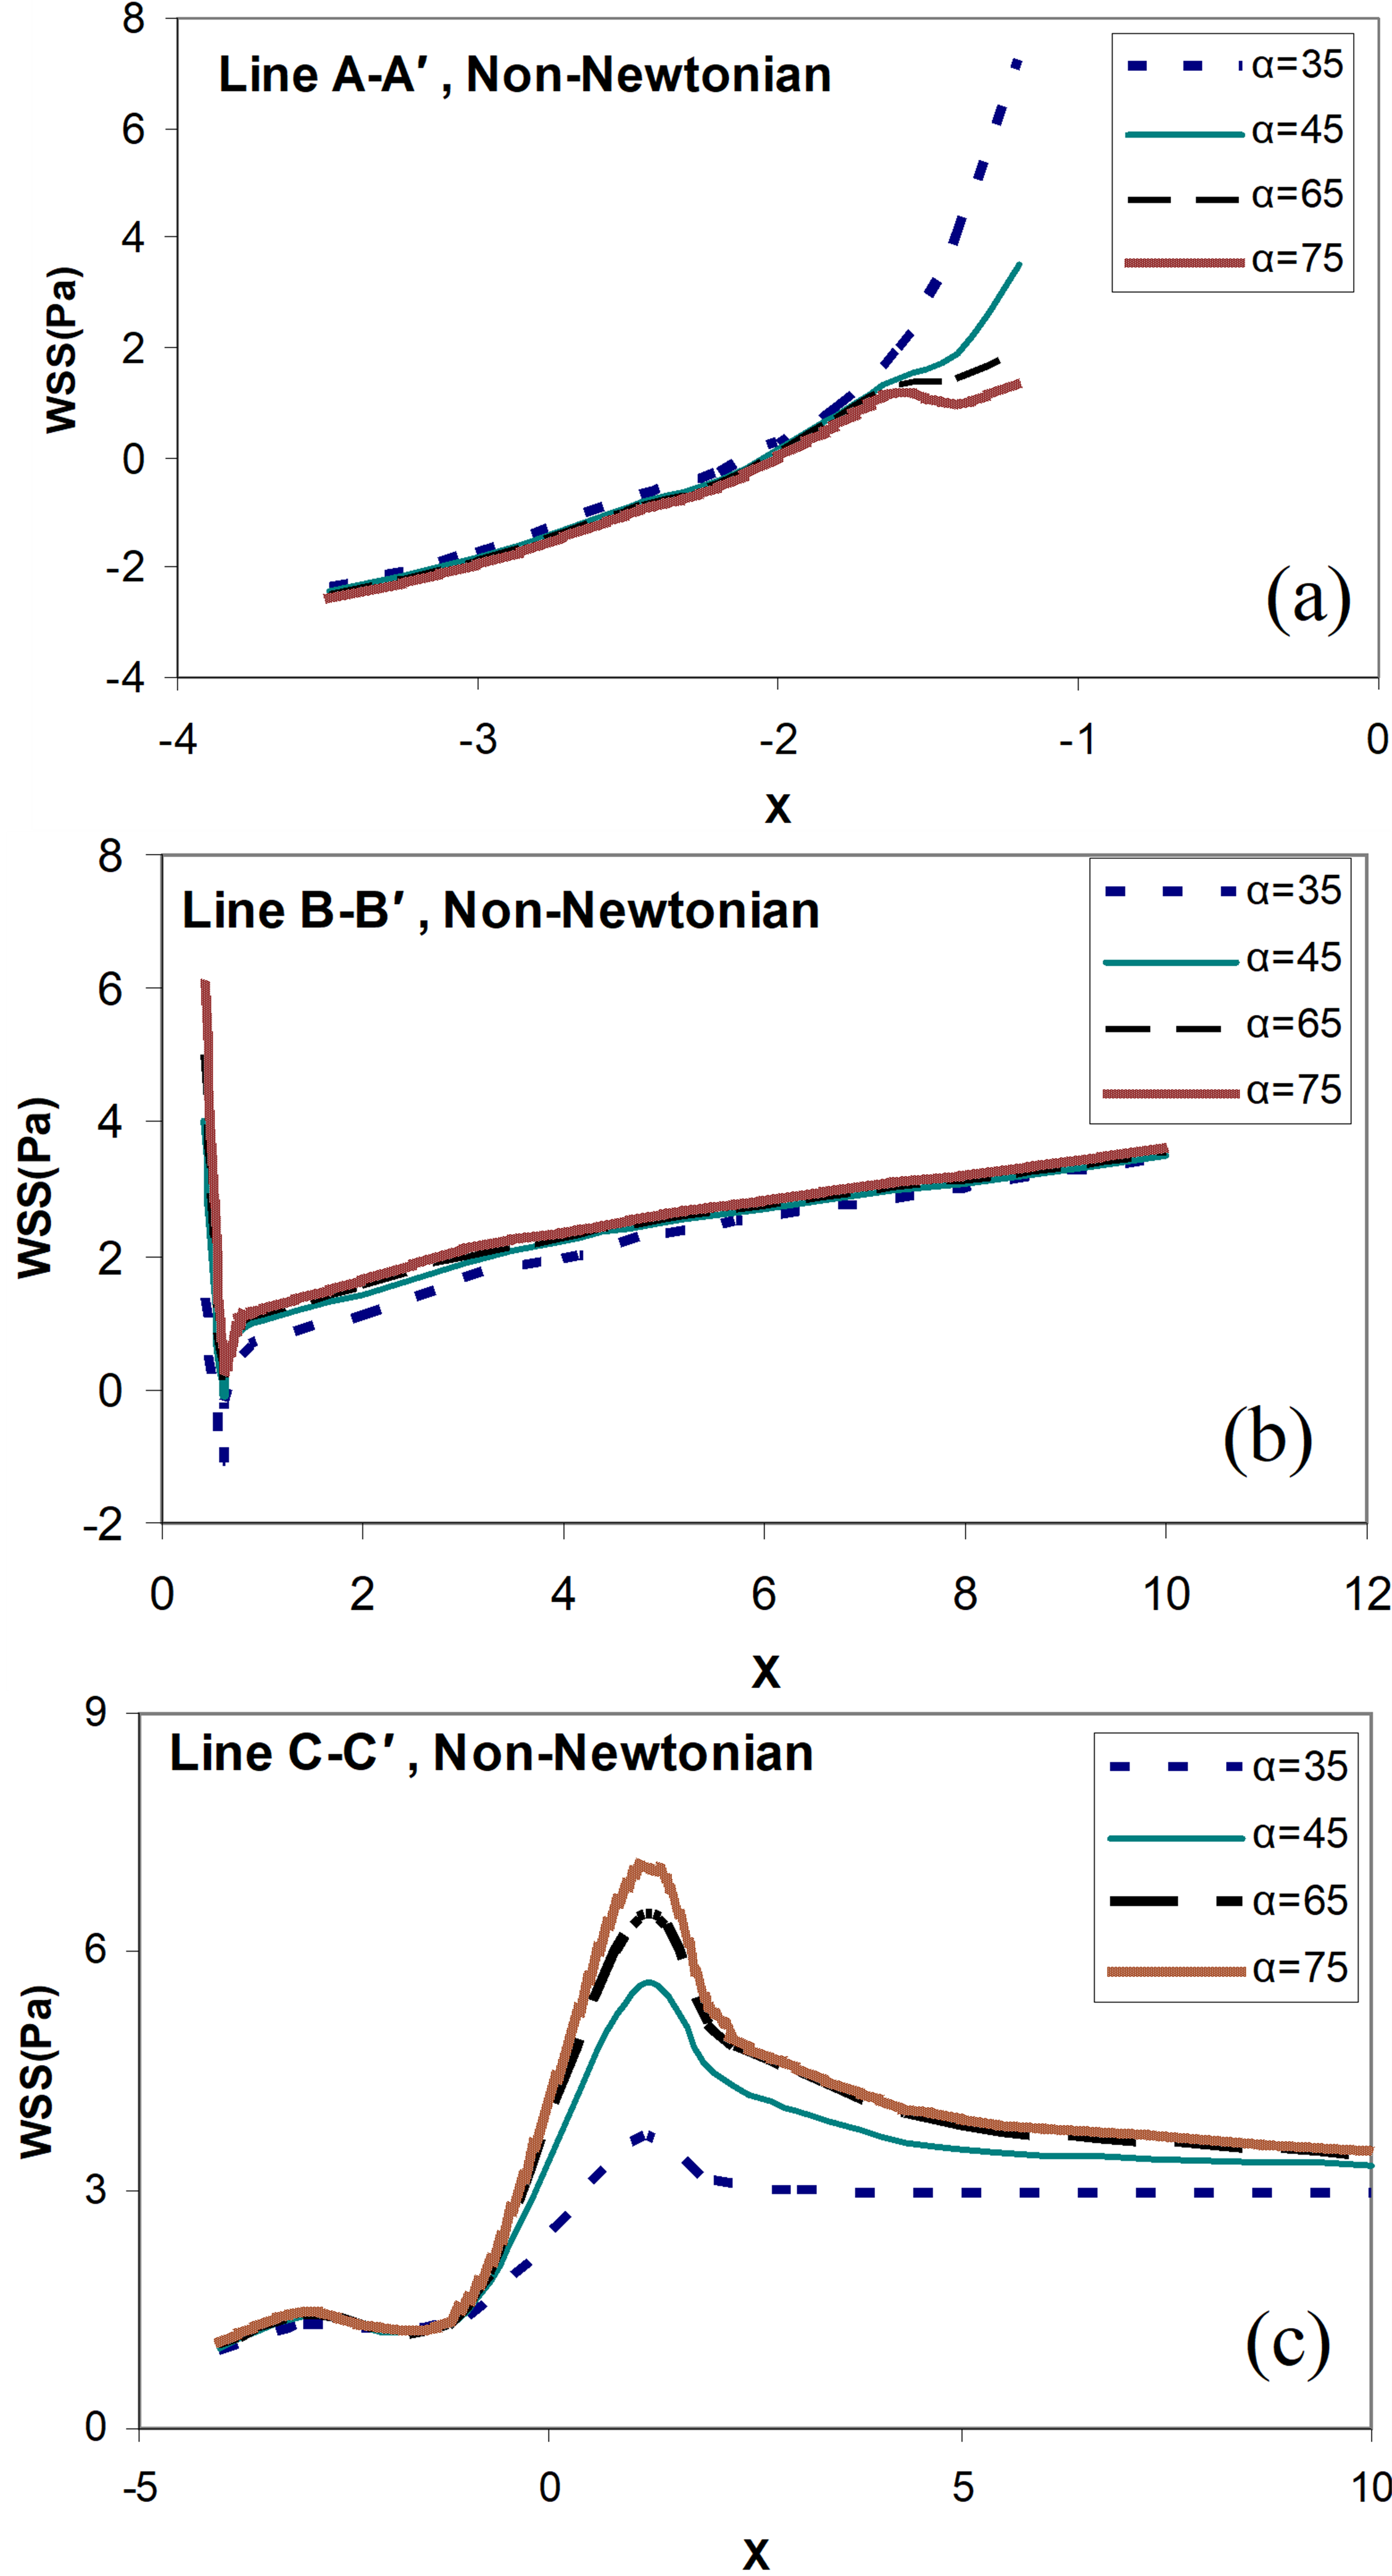
Figure 7. Distribution of the wall shear stress for different angles of bypass graft (α=35°,45°,65°,75°), and the distance between the graft and the stenosis D = 3.0, non-Newtonian blood flow model, and (a) along the line ; (b) along the line ; (c) along the line .
On the other hand, disturbed flow is postulated to provide a favorable environment for the progression of bypass failure. Flow recirculation zones are associated with distinct pathogenic biological pathways relevant to thrombosis and atherogenesis. It increases the near-wall residence time and the probability of red blood cell, platelet and other material deposit here due to the very low velocity, and the flow separation of the recirculation region is the most discernible hemodynamic feature which leads to intimal hyperplasia development. What’s more, the graft flow impact on the artery bed is injurious to the endothelium. The collagen and tissue factor would be exposed to the flowing blood if the endothelium is injured, resulting in platelet activation, thrombin generation and eventually thrombus formation. Therefore, the smaller anastomosis angle is beneficial to reduce the area of the recirculation zone and improve the smoothness of bypass grafting coronary artery [46].
The effects of the distance changes between the graft and the stenosis position on the distribution of WSS
The results of the numerical solution of the flow field in the grafted artery and the host artery show that wall shear stress near the Heel, Toe location, and the intersection of the host and graft arteries suddenly increased strongly and fluctuated.
Figure 8 shows the WSS for each of the above lines in different Newtonian and non-Newtonian states and at different distances between the grafts to the stenosis location.
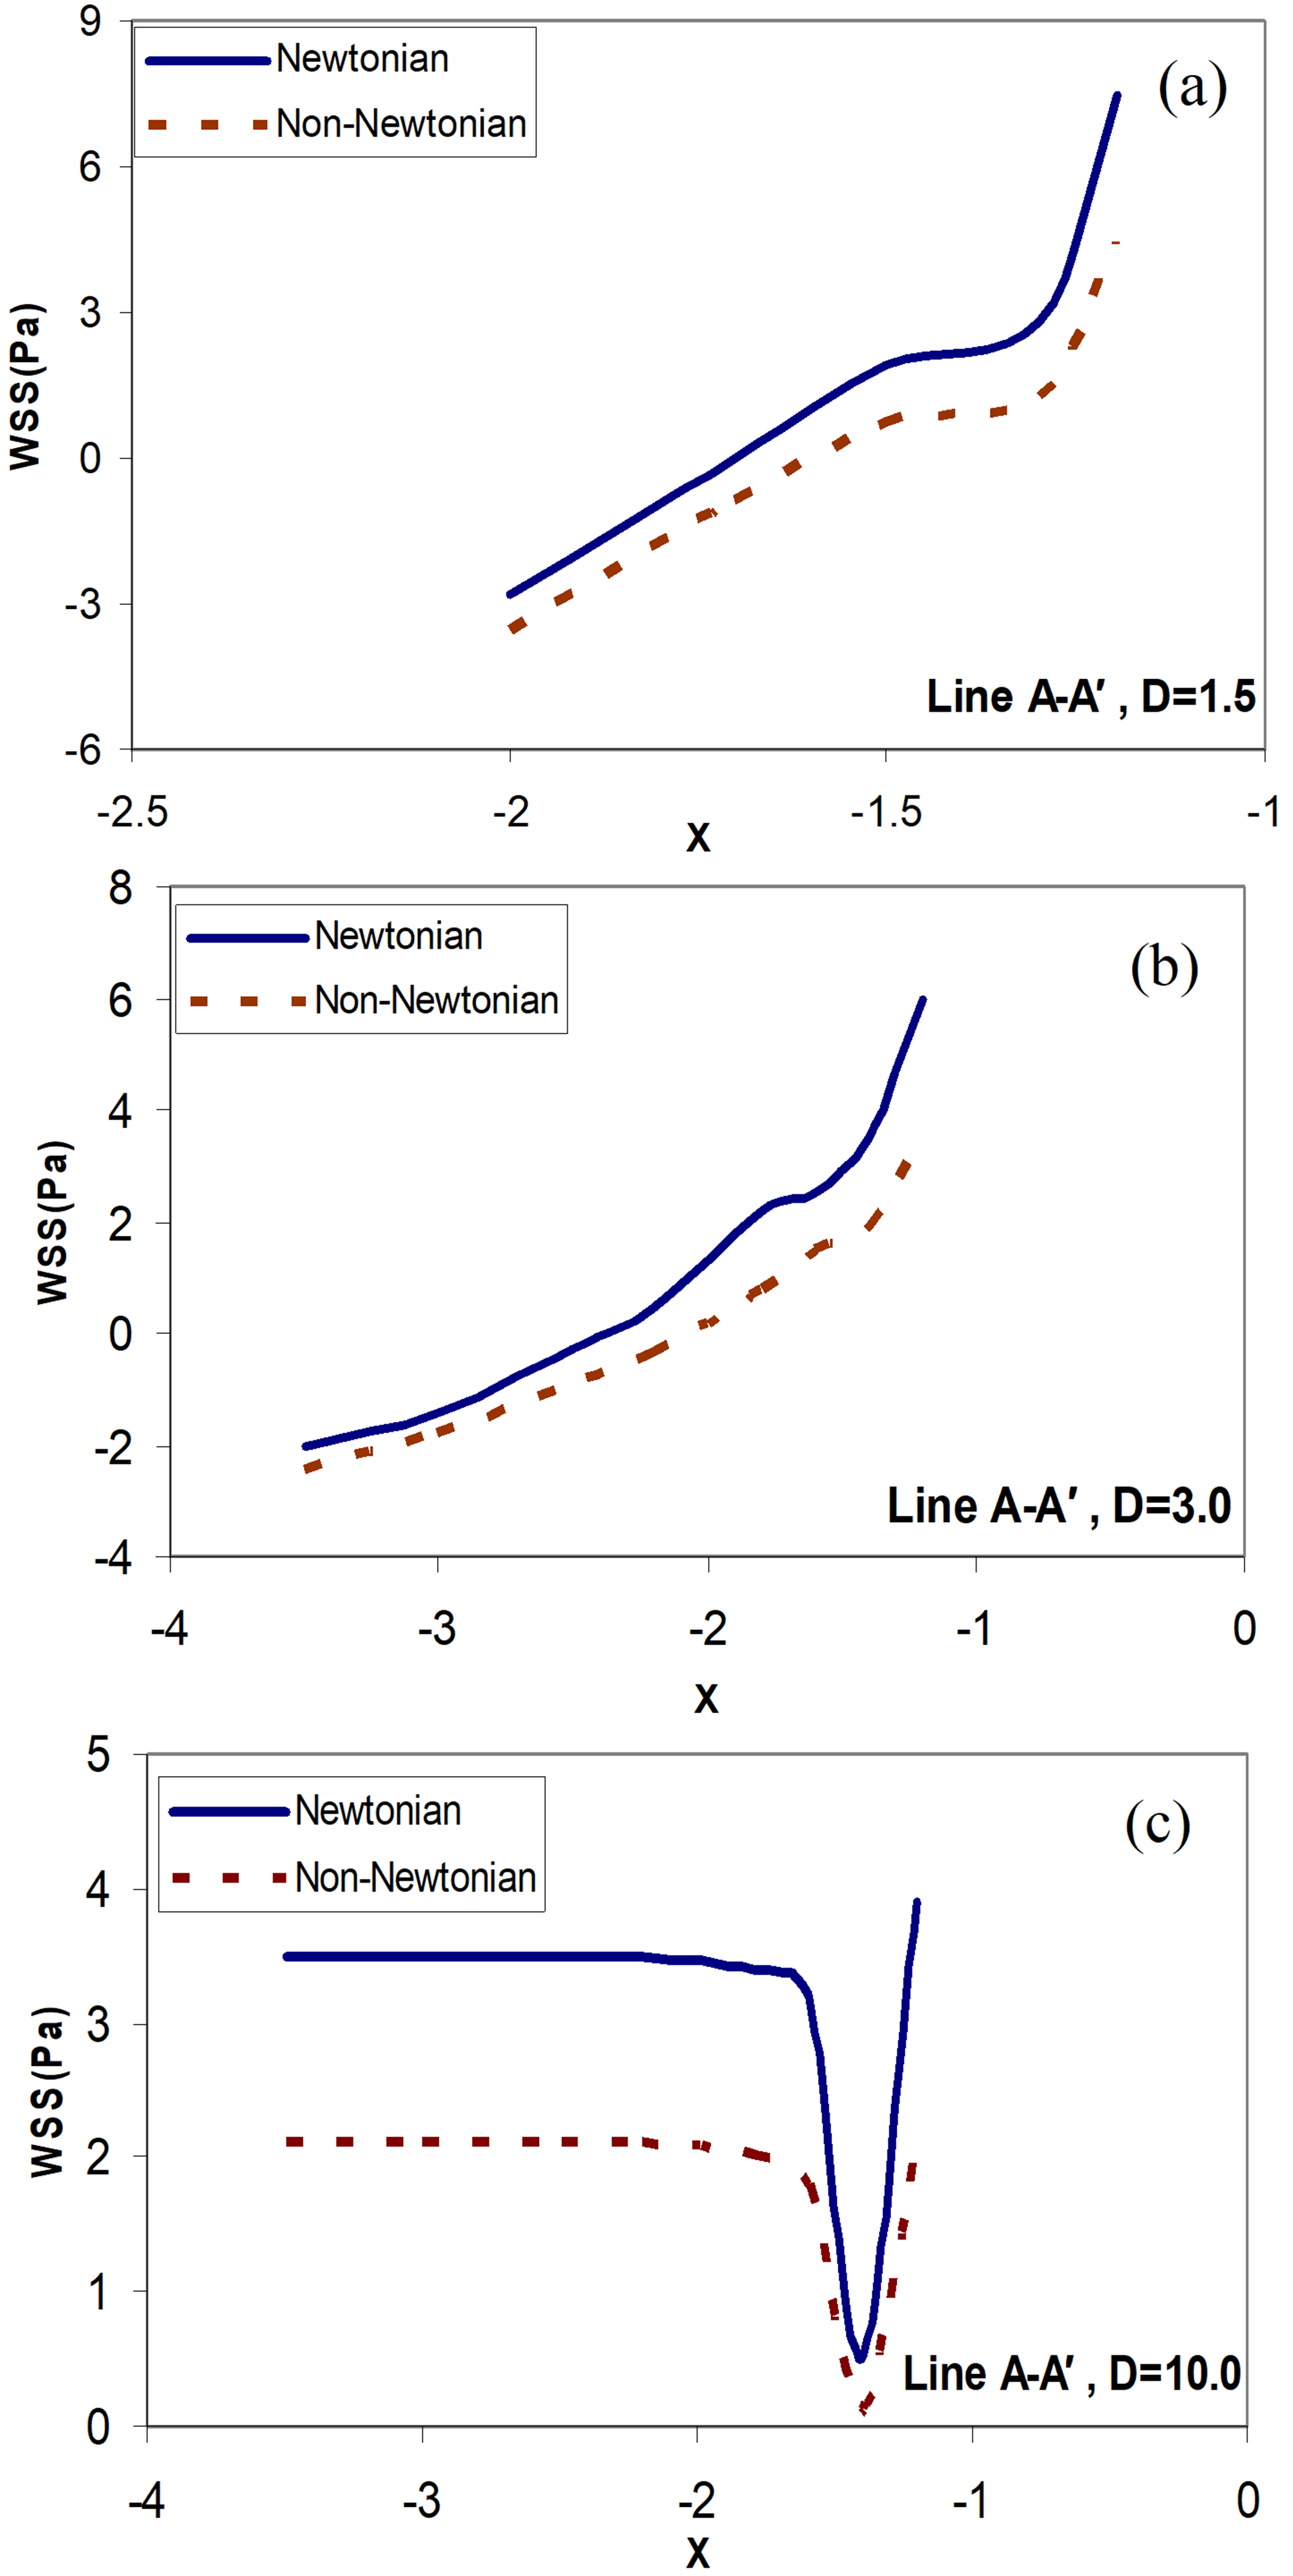
Figure 8. Distribution of the wall shear stress along the line ; Newtonian and non-Newtonian blood flow for the different distances between the graft and the stenosis, (a)  ; (b)
; (b)  ; (c)
; (c)  .
.
These distances are 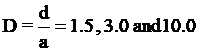 ( is the arterial diameter of the host artery). The last case D = 10.0 is like behavior that does not exist stenosis in the host artery (stenosis at a faraway point). It can be seen from these Figures that by decreasing the distances between the grafts to the stenosis location, the WSS value increases. With increasing the distances between the grafts to the stenosis location (
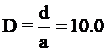 ), the WSS value will always be positive. This means that there is no re-circulation of the blood flow near the Heel. In this case, there is a slight drop in the WSS value near the intersection, but the WSS value is not negative. Near the location of the graft, there is a sudden and severe change in the WSS values for all occasions. The distances between the grafts to the stenosis location are very influential on the distribution of the WSS downstream of the junction. By increasing the distances between the grafts to the stenosis location, the unusual effects of the outflow flow from the stenosis location before the graft is removed. Therefore, less variation in the graft location is observed for the WSS value. Lower variations in WSS value at the location of the graft can reduce the risk of intimal hyperplasia (IH).
Figure 9 shows the distribution of wall shear stress along the line . The amount of shear stress for the wall in the upper part of the host artery is always positive. There is also a sudden drop in WSS 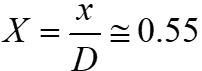 . This is due to the presence of recirculation zones in the flow. Also, as you can see, the WSS for the Newtonian model is higher than for the non-Newtonian model. As the distance between the graft and the stenosis increases, the WSS also increases and eventually reaches a relatively constant amount.
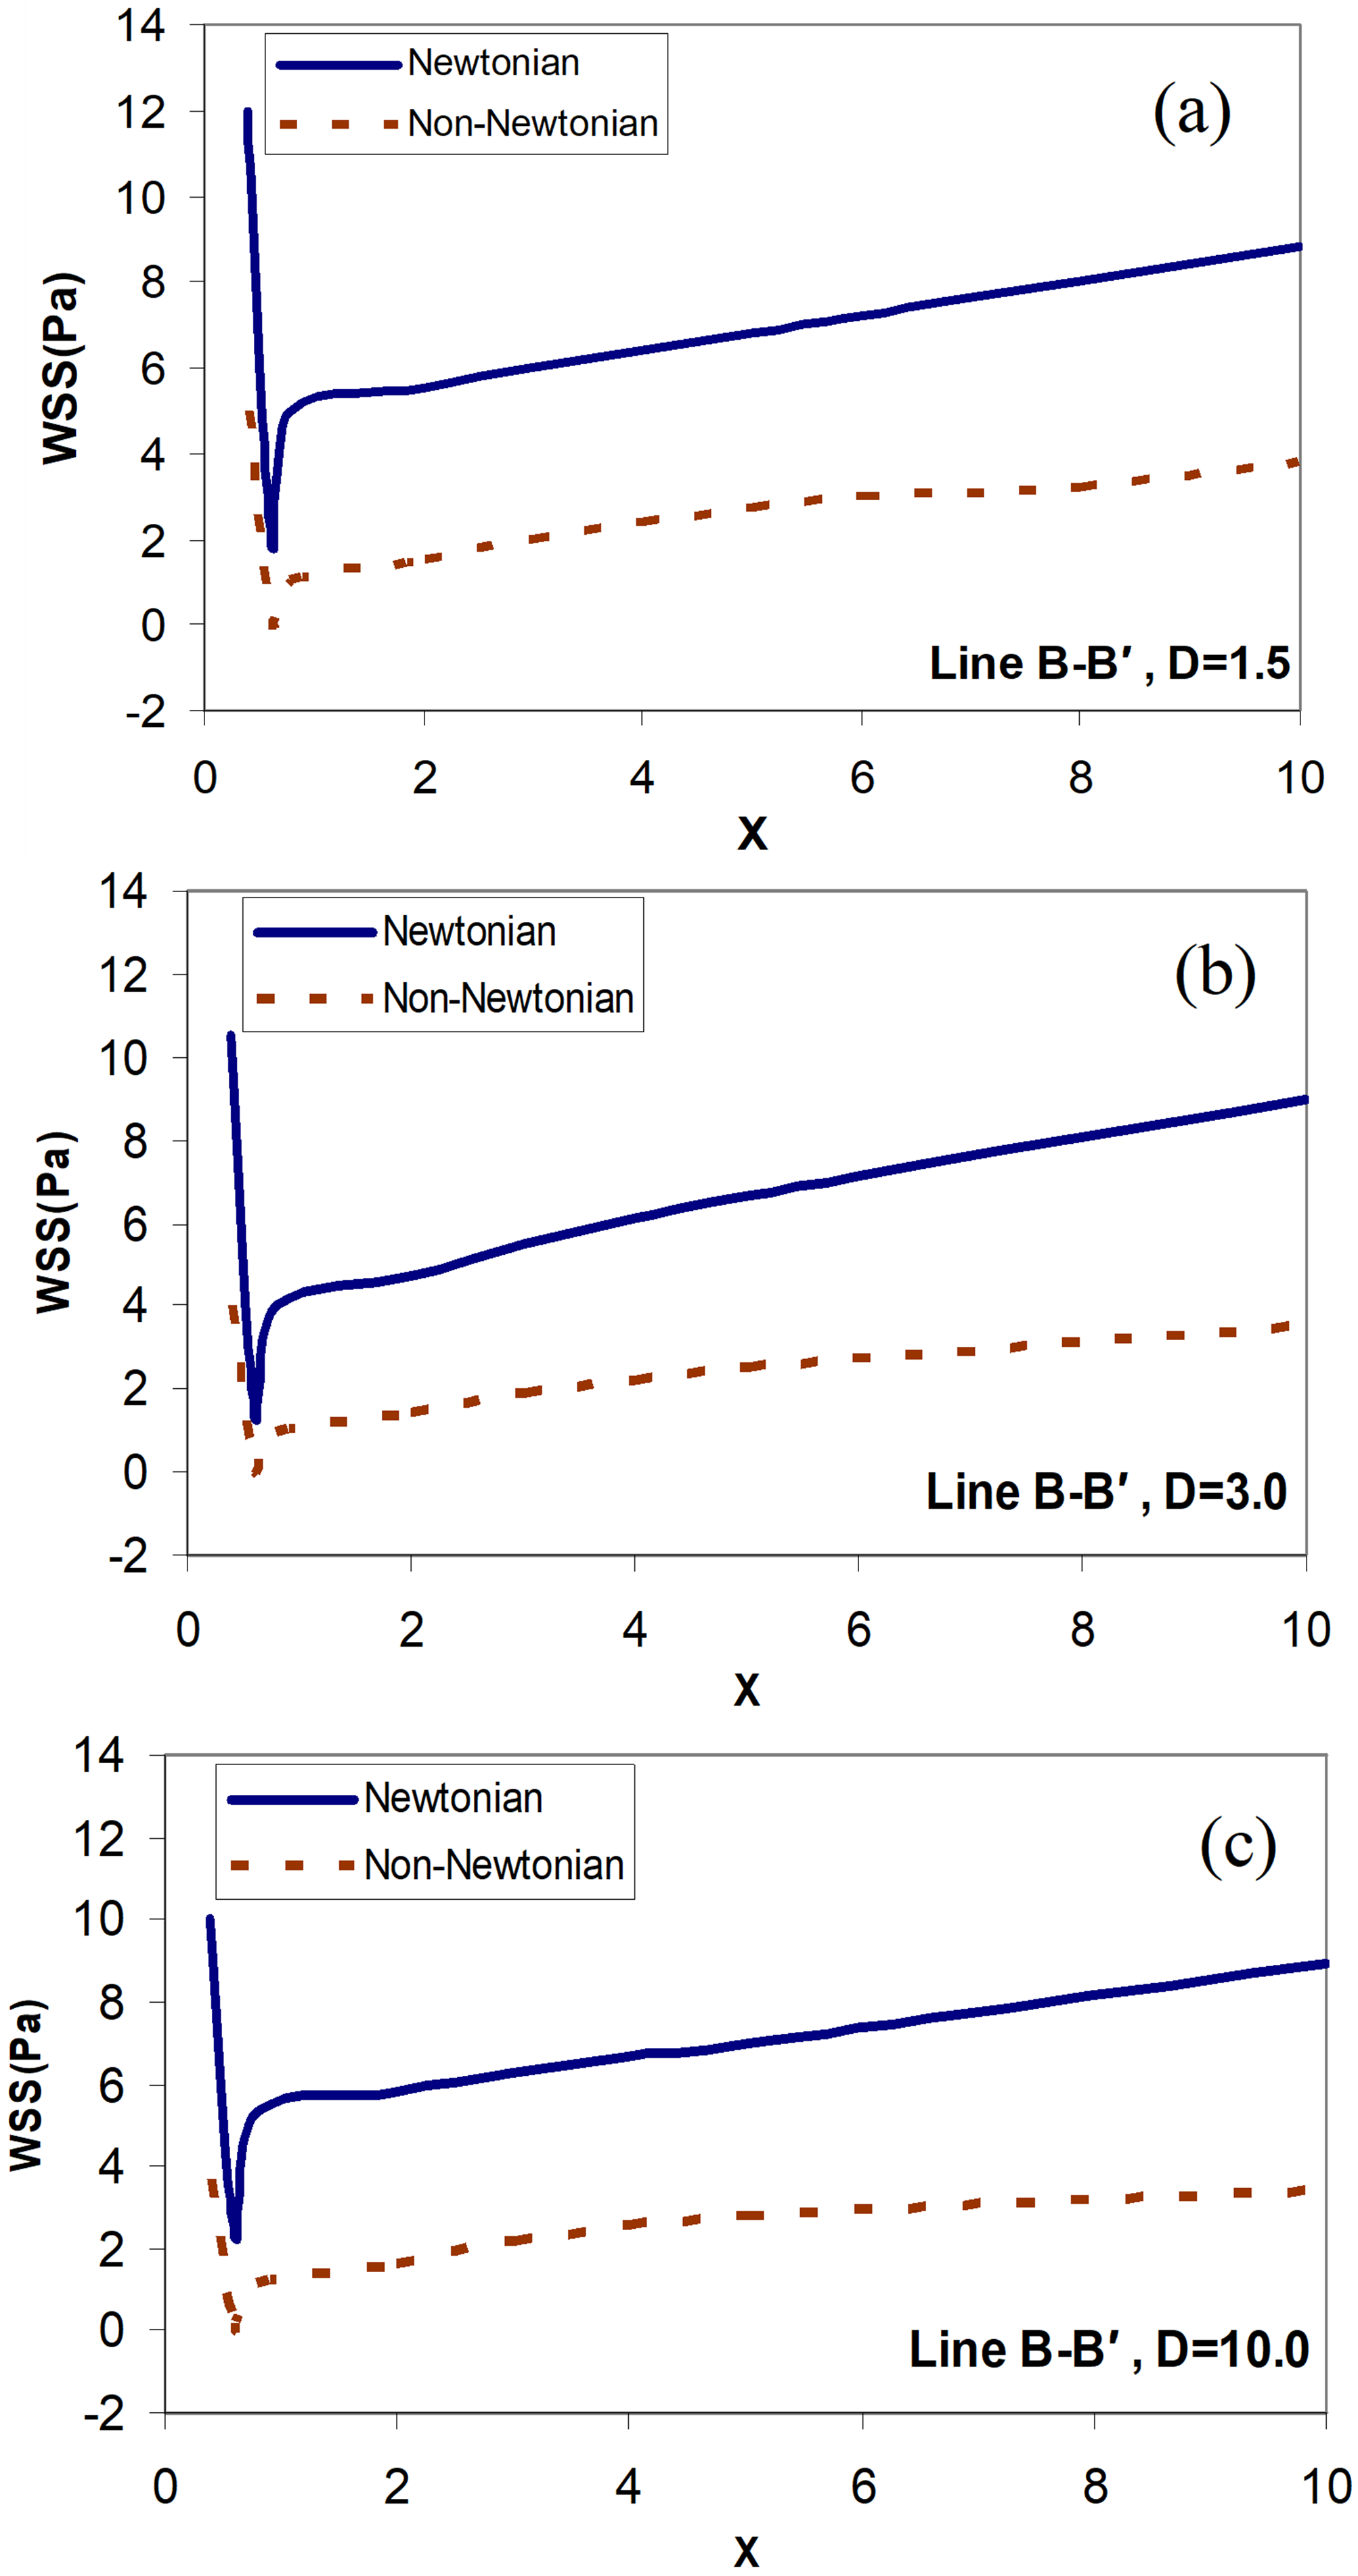
Figure 9. Distribution of the wall shear stress along the line ; Newtonian and non-Newtonian blood flow for the different distances between the graft and the stenosis, (a) ; (b) ; (c) .
Figure 10 shows the distribution of wall shear stress along the Line . The amount of shear stress for the wall in the lower part of the host artery for the distance upstream of the junction is negative. But in two cases  , and , the negative WSS is not observed anywhere in the flow. The rate of WSS in the bed of host arteries increases with increasing distance, and ultimately reaches a maximum at . The place where the maximum WSS occurs, in this case, is according to the minimum WSS in the previous case (along with the line ). The reason for an increase in WSS in the near Toe is increased flow due to the vicinity of the bypass graft. The outlet flow of the bypass graft artery first collides with the lower wall of the host artery location. Also, the maximum WSS, in this case, is greater than in the other cases. As the flow progresses to the end of the artery, the WSS gradually decreases and reaches a constant rate for all three cases. Also, as you can see, just like in previous cases the amount of WSS for the Newtonian model is higher than the non- Newtonian model.
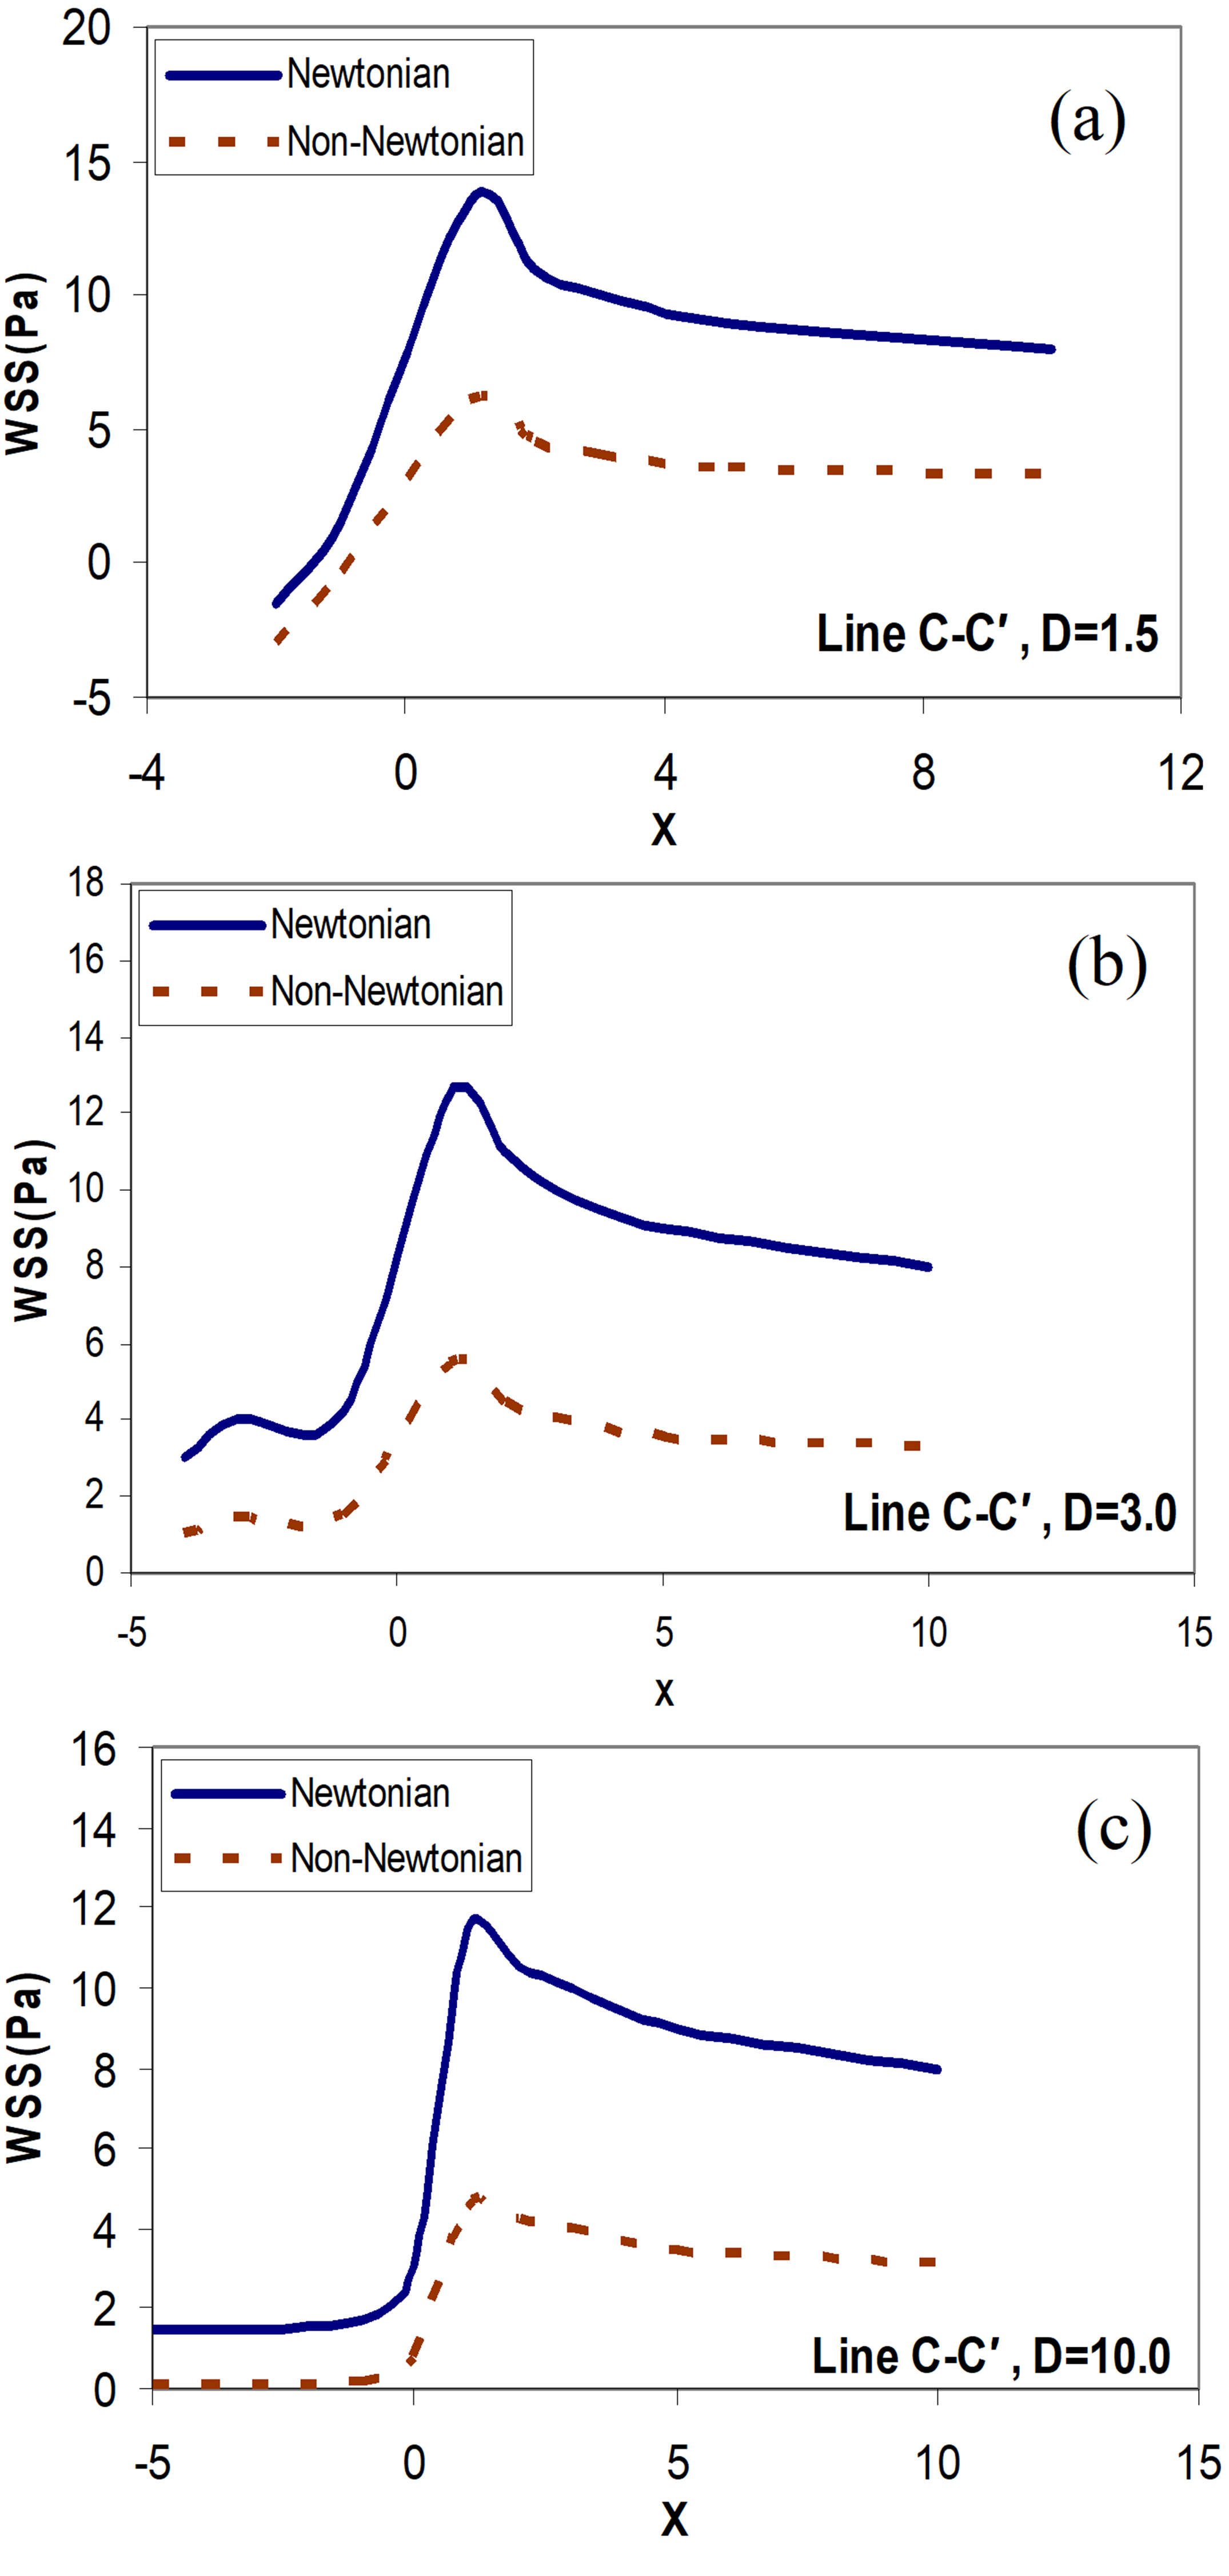
Figure 10. Distribution of the wall shear stress along the Line ; Newtonian and non-Newtonian blood flow for the different distances between the graft and the stenosis, (a) ; (b) ; (c) .
In Figure 11, the distribution of WSS in the graft artery along the two lines closer to the upstream of the junction (Heel of a grafted artery or Line ) and closer to the downstream of the junction (toe of a grafted artery or Line ) are presented. No recirculating flow is seen in the graft artery. There is an increase in the WSS level near the toe of the bypass graft for both the Newtonian and non-Newtonian flow. Higher values in WSS are observed for the non-Newtonian flow in all cases. An increase in flow rate at the location of the graft increases the observed WSS.
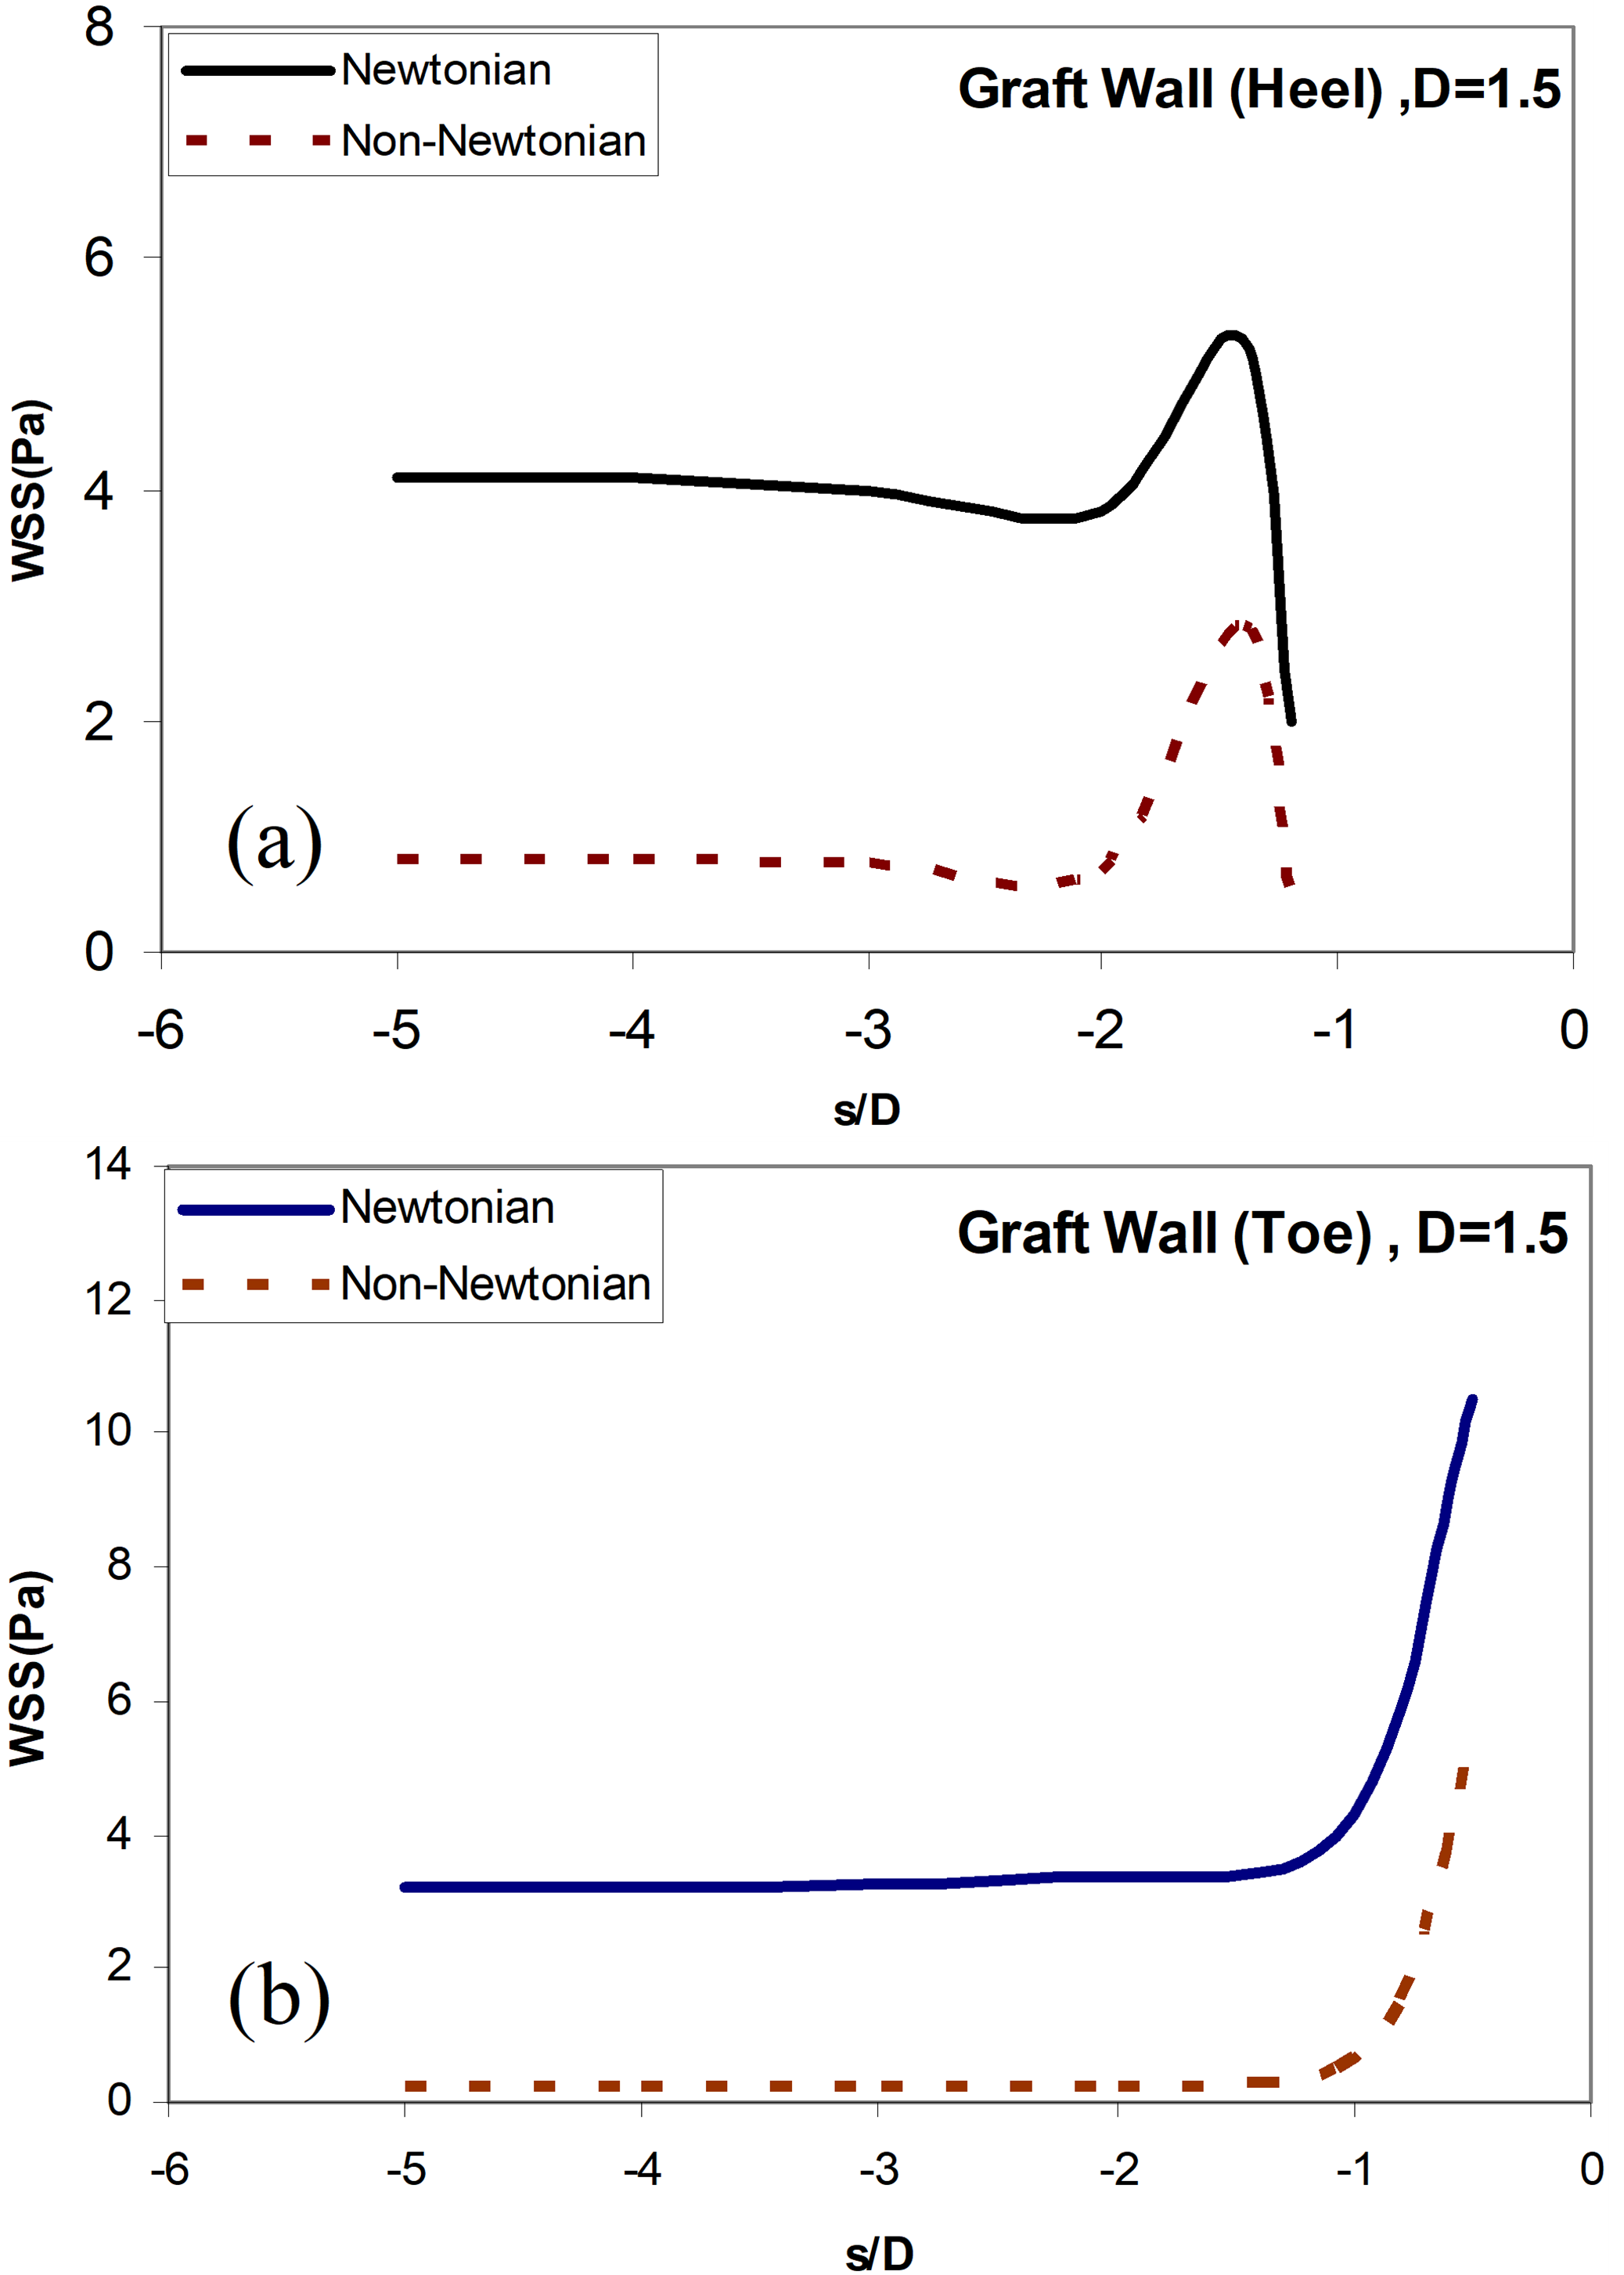
Figure 11. (a) Distribution of the wall shear stress along the Line ; Newtonian and non-Newtonian blood flow for the different distances between the graft and the , (a) along the Line; (b) stress along the Line .
For the verification of the numerical method, the Newtonian blood flow inside the artery is simulated and compared with the results of Politis et al. [47]. In this simulation, the geometry of stenosis is modeled to an angle of bypass graft (α=90°), similar to the model of Politis, and the interaction between blood fluid and the arterial wall is considered. In Figure 12, the distribution of the wall shear stress profile is traced for a 75% symmetric axial cross-sectional area reduction for an angle of bypass graft (α=90°), and the distance between the graft and the stenosis D = 3.0, Newtonian blood flow model, and along the line and are compared with the results of Politis et al. As shown in Figure 12, there is a very good agreement between the results of this study for WSS distribution (along the Line (the host artery bed) and the angle of the bypass graft, (α=90°), with 75% symmetric axial stenosis and Newtonian model) and those of the research of Politis et al.
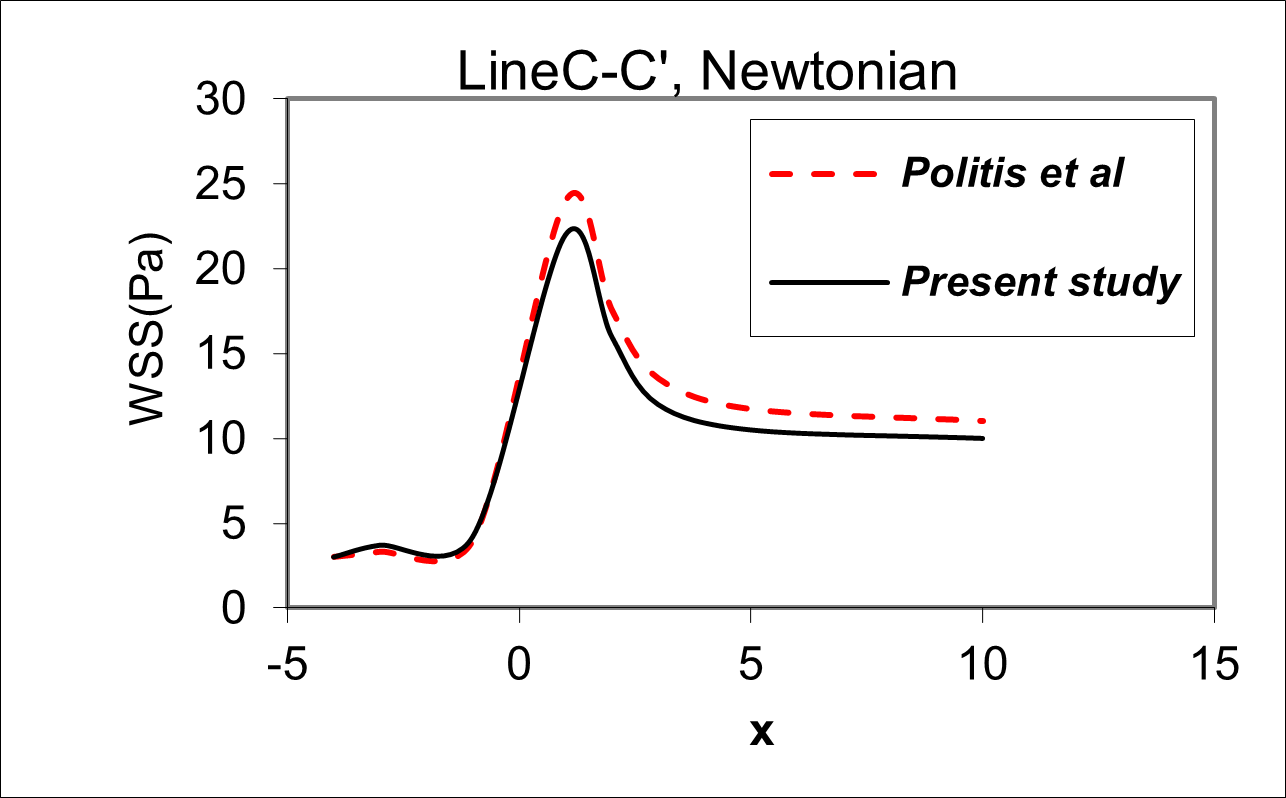
Figure 12. Comparison of Distribution of the wall shear stress profile related to the model of study with the research of Politis et al. for an angle of bypass graft (α=90°), and the distance between the graft and the stenosis D = 3.0, Newtonian blood flow model, and along the line .
Conclusions
In this study, the control volume method was used to examine the wall shear stresses distribution WSS of the blood flow in a graft artery. Wall shear stress (WSS) distribution was obtained on the areas of hyperplasticity re-incidence for some different angles of grafted arteries, i.e., α=35°,45°,65°,75°. And also the various Distances of the Bypass Graft to the Stenosis in the Newtonian and non- Newtonian flow (with Herschel Bulkley model) on the areas of potential re-obstruction and the occurrence of IH such as Toe, Heel, arterial bed, suture location, and graft artery walls. Based on the results, the changes in WSS depend heavily on the angular position of the artery. For instance, an increase in the angles of the bypass graft α=75° causes a sudden increase in the amount of shear stress applied to the toe of the graft and the arterial bed in front of the branching region and the shear stress decreased on the Heel of the graft. Also, the amount of WSS on the arterial wall in the Newtonian model is much higher than its equivalent in the non-Newtonian model. Since the rapid increase in the amount of shear stress causes the endothelial cells of the arterial wall to be damaged, the large excessive angle of the graft artery can not be a good fit recommendation for transplantation surgery. Also, more Reduction of graft artery angles due to a severe reduction in the WSS can not be a good proposition. Under low WSS values, the probability of sedimentation of suspended particles such as cholesterol increases, and the probability of intimal hyperplasia (IH), blood clotting, and re-blockage of the surgical artery also increases. Therefore, an intermediate angle α=45° could be suggested as an optimal bypass graft angle for transplantation surgery. In this case, we have a smoother shear stress distribution on the toe and heel of the bypass that can significantly reduce the risk of intimal hyperplasia (IH). Based on the results, the steep variations in the WSS depend on the distance between the stenosis location to the graft location and different wall positions of the host artery (such as upstream of the junction; downstream of the junction; and (c) Host artery bed). The distribution of WSS near the anastomosis including the Heel, Toe location, and the intersection of the host and graft arteries suddenly changed dramatically.
Usually, changes to the WSS are incremental. There is also a large difference in the amount of WSS in the upper and lower wall of the host artery (at the opposite wall to the anastomosis). This high difference in WSS, which is seen in the anastomosis wall, may induce blood platelet activation and aggregation and causes the Incidence or occurrence of intimal hyperplasia (IH) disease. When the distance between the stenosis to the location of the graft is short, we encounter negative WSS values ??that may increase the residence time for atherogenic particles (Particles that cause atherosclerosis e.g., platelets and macrophages) in the graft artery. This factor promotes and raises the deposition and adhesion of the particles in the diseased artery. If the distance between the stenosis to the location of the graft increases, the unusual effects of the outlet flow from the stenosis (such as the sudden increase in velocity) will be eliminated and therefore will have the least effect on the location. In this case, we have a more uniform distribution of WSS before anastomosis, which can cause to enhance the patency of bypass graft surgery and reduce the risk chances of developing endometrial hyperplasia and is recommended as surefire means of prevention of developing this condition.
Acknowledgments
Financial support for this work by the ACECR Institute of Higher Education (Isfahan Branch) is gratefully appreciated.
Conflict of Interest
The authors declare no conflict of interest.
References
2. Zimmer RJ, Lee MS. Transplant coronary artery disease. JACC: Cardiovascular Interventions. 2010 Apr;3(4):367-77.
3. Tran JS, Schiavazzi DE, Kahn AM, Marsden AL. Uncertainty quantification of simulated biomechanical stimuli in coronary artery bypass grafts. Computer Methods in Applied Mechanics and Engineering. 2019 Mar 1;345:402-28.
4. Sia SF, Zhao X, Li R, Zhang Y, Chong W, He L, Chen Y. Evaluation of the carotid artery stenosis based on minimization of mechanical energy loss of the blood flow. Proceedings of the Institution of Mechanical Engineers, Part H: Journal of Engineering in Medicine. 2016 Nov;230(11):1051-8.
5. Kute SM, Vorp DA. The effect of proximal artery flow on the hemodynamics at the distal anastomosis of a vascular bypass graft: computational study. Journal of Biomechanical Engineering. 2001 Jun 1;123(3):277-83.
6. Patel SD, Waltham M, Wadoodi A, Burnand KG, Smith A. The role of endothelial cells and their progenitors in intimal hyperplasia. Therapeutic Advances in Cardiovascular Disease. 2010 Apr;4(2):129-41.
7. Caro CG, Fitz-Gerald JM, Schroter RC. Atheroma and arterial wall shear-observation, correlation and proposal of a shear dependent mass transfer mechanism for atherogenesis. Proceedings of the Royal Society of London. Series B. Biological Sciences. 1971 Feb 16;177(1046):109-33.
8. El Zahab Z, Divo E, Kassab A. Minimisation of the wall shear stress gradients in bypass grafts anastomoses using meshless CFD and genetic algorithms optimisation. Computer Methods in Biomechanics and Biomedical Engineering. 2010 Feb 1;13(1):35-47.
9. Brien TO, Walsh M, McGloughlin T. On reducing abnormal hemodynamics in the femoral end-to-side anastomosis: the influence of mechanical factors. Annals of Biomedical Engineering. 2005 Jan;33(3):310-22.
10. Ghista DN, Kabinejadian F. Coronary artery bypass grafting hemodynamics and anastomosis design: a biomedical engineering review. Biomedical Engineering Online. 2013 Dec;12(1):129.
11. Neeraja G, Dinesh PA, Vidya K, Raju CS. Peripheral layer viscosity on the stenotic blood vessels for Herschel-Bulkley fluid model. Informatics in Medicine Unlocked. 2017 Jan 1;9:161-5.
12. Shukla JB, Parihar RS, Rao BR. Effects of stenosis on non-Newtonian flow of the blood in an artery. Bulletin of Mathematical Biology. 1980 May;42(3):283-94.
13. Jain N, Singh S, Gupta M. Steady flow of blood through an atherosclerotic artery: A non-Newtonian model. International Journal of Applied Mathematics and Mechanics. 2012;8:52-63.
14. Perktold K, Hofer M, Rappitsch G, Loew M, Kuban BD, Friedman MH. Validated computation of physiologic flow in a realistic coronary artery branch. Journal of Biomechanics. 1997 Dec 19;31(3):217-28.
15. Lee D, Su JM, Liang HY. A numerical simulation of steady flow fields in a bypass tube. Journal of Biomechanics. 2001 Nov 1;34(11):1407-16.
16. Chen J, Lu XY. Numerical investigation of the non-Newtonian pulsatile blood flow in a bifurcation model with a non-planar branch. Journal of Biomechanics. 2006 Jan 1;39(5):818-32.
17. Kabinejadian F, Chua LP, Ghista DN, Tan YS. CABG models flow simulation study on the effects of valve remnants in the venous graft. Journal of Mechanics in Medicine and Biology. 2010 Dec;10(04):593-609.
18. Wang W, Mao B, Wang H, Geng X, Zhao X, Zhang H, Xie J, Zhao Z, Lian B, Liu Y. Hemodynamic analysis of sequential graft from right coronary system to left coronary system. Biomedical Engineering Online. 2016 Dec;15(2):545-56.
19. Leuprecht A, Perktold K, Prosi M, Berk T, Trubel W, Schima H. Numerical study of hemodynamics and wall mechanics in distal end-to-side anastomoses of bypass grafts. Journal of Biomechanics. 2002 Feb 1;35(2):225-36.
20. Azad RM, Ansari AR, Ryan C, Walsh M, McGloughlin T. An evolutionary approach to wall shear stress prediction in a grafted artery. Applied Soft Computing. 2004 May 1;4(2):139-48.
21. Chen J, Lu XY, Wang W. Non-Newtonian effects of blood flow on hemodynamics in distal vascular graft anastomoses. Journal of Biomechanics. 2006 Jan 1;39(11):1983-95.
22. Azuma N, Kikuchi S, Okuda H, Miyake K, Koya A. Recent progress of bypass surgery to the dialysis-dependent patients with critical limb ischemia. Annals of Vascular Diseases. 2017 Sep 25;10(3):178-84.
23. Pashneh-Tala S, MacNeil S, Claeyssens F. The tissue-engineered vascular graft—past, present, and future. Tissue Engineering Part B: Reviews. 2016 Feb 1;22(1):68-100.
24. Whitmore RL. Rheology of the Circulation. Pergamon. 1968.
25. Forrester JH, Young DF. Flow through a converging-diverging tube and its implications in occlusive vascular disease—I: Theoretical development. Journal of Biomechanics. 1970 May 1;3(3):297-305.
26. Perkkiö J, Keskinen R. Hematocrit reduction in bifurcations due to plasma skimming. Bulletin of Mathematical Biology. 1983 Jan 1;45(1):41-50.
27. Young D. Fluid mechanics of arterial stenoses. Journal of Biomechanical Engineering. 1979;101(3):157-175.
28. Dash RK, Jayaraman G, Mehta KN. Flow in a catheterized curved artery with stenosis. Journal of Biomechanics. 1999 Jan 1;32(1):49-61.
29. Kapur JN. Mathematical models in biology and medicine. Affiliated East-West Press; 1985.
30. Ling SC, Atabek HB. A nonlinear analysis of pulsatile flow in arteries. Journal of Fluid Mechanics. 1972 Oct;55(3):493-511.
31. Rao AR, Devanathan R. Pulsatile flow in tubes of varying cross-sections. Zeitschrift für angewandte Mathematik und Physik. 1973 Mar;24(2):203-13.
32. Iida N, Murata T. Theoretical analysis of pulsatile blood flow in small vessels. Biorheology. 1980;17(4):377.
33. Rao AR. Oscillatory flow in an elastic tube of variable cross-section. Acta Mechanica. 1983 Mar;46(1):155-65.
34. Rao AR. Unsteady flow with attenuation in a fluid filled elastic tube with a stenosis. Acta mechanica. 1983 Sep;49(3):201-8.
35. Aroesty J, Gross JF. The mathematics of pulsatile flow in small vessels I. Casson theory. Microvascular Research. 1972 Jan 1;4(1):1-12.
36. Aroesty J, Gross JF. Pulsatile flow in small blood vessels—I. Biorheology. 1972 Jan 1;9(1):33-43.
37. Chaturani P, Samy RP. Pulsatile flow of Casson’s fluid through stenosed arteries with applications to blood flow. Biorheology. 1986 Jan 1;23(5):499-511.
38. Blair S. An Introduction to Biorheology. Amsterdam-New York: Elsevier Scientific Pubi. Co; 1974.
39. Chaturani P, Ponnalagar Samy R. A study of non-Newtonian aspects of blood flow through stenosed arteries and its applications in arterial diseases. Biorheology. 1985 Jan 1;22(6):521-31.
40. Iida N. Influence of plasma layer on steady blood flow in microvessels. Japanese Journal of Applied Physics. 1978;17(1):203.
41. Iasiello M, Vafai K, Andreozzi A, Bianco N. Analysis of non-Newtonian effects within an aorta-iliac bifurcation region. Journal of Biomechanics. 2017 Nov 7;64:153-63.
42. Ofili EO, Kern MJ, Vrain JA, Donohue TJ, Bach R, Al-Joundi B, et al. Differential characterization of blood flow, velocity, and vascular resistance between proximal and distal normal epicardial human coronary arteries: analysis by intracoronary Doppler spectral flow velocity. American Heart Journal. 1995 Jul 1;130(1):37-46.
43. Nakamura M, Sawada T. Numerical study on the unsteady flow of non-Newtonian fluid. Journal of Biomechanical Engineering. 1990;112(1):100-103.
44. González HA, Moraga NO. On predicting unsteady non-Newtonian blood flow. Applied Mathematics and Computation. 2005 Nov 15;170(2):909-23.
45. Johnston BM, Johnston PR, Corney S, Kilpatrick D. Non-Newtonian blood flow in human right coronary arteries: steady state simulations. Journal of Biomechanics. 2004 May 1;37(5):709-20.
46. Liu Z, Yang G, Nan S, Qi Y, Pang Y, Shi Y. The effect of anastomotic angle and diameter ratio on flow field in the distal end-to-side anastomosis. Proceedings of the Institution of Mechanical Engineers, Part H: Journal of Engineering in Medicine. 2020 Apr;234(4):377-86.
47. Politis AK, Stavropoulos GP, Christolis MN, Panagopoulos FG, Vlachos NS, Markatos NC. Numerical modeling of simulated blood flow in idealized composite arterial coronary grafts: Steady state simulations. Journal of Biomechanics. 2007 Jan 1;40(5):1125-36.