

Abstract
This study investigated the effect of annealing temperature on the microstructure and electrochemical behavior of commercially pure titanium (CP Ti) subjected to cold rolling and heat treatments between 400 and 900°C. Microstructural characterization and microhardness measurements were performed, along with potentiodynamic polarization and electrochemical impedance spectroscopy (EIS) tests in artificial saliva following exposure to a fluoridated agent. Three independent specimens were evaluated for each electrochemical condition, and results are reported as mean ± standard deviation. Microstructural characterization revealed recovery, recrystallization, and grain growth with increasing annealing temperature, as well as α′ martensite formation, evidenced by acicular morphologies that were more pronounced under the higher-temperature conditions. The electrochemical response varied depending on the parameter considered: cold-rolled and annealing at 900°C (CR900) exhibited the lowest Icorr (1.40 ± 0.18 μA/cm²), whereas CR600 and CR800 showed the lowest Ipass values (8.95 ± 0.20 and 9.1 ± 1.1 μA/cm², respectively). CR800 reached the highest Rf after 72 h of immersion (102 ± 12 MΩ·cm²), while for CR900, the Rf values decreased from 0.847 ± 0.022 to 0.293 ± 0.010 MΩ·cm². The occurrence of α′ martensite at higher annealing temperatures and the differing responses of Icorr, Ipass, and Rf demonstrate that microstructural evolution affects corrosion-related parameters in distinct ways. Accordingly, the influence of annealing can only be properly understood through the combined analysis of microstructure, polarization behavior, and EIS results.
Keywords
CP titanium, Fluoride, Corrosion resistance, Annealing
Introduction
Titanium is a widely used material in dentistry and the biomedical field due to its mechanical properties, corrosion resistance and biocompatibility [1]. Despite its high reactivity, titanium spontaneously forms a passive oxide layer when exposed to air or water, providing durability and stability to the material [2]. However, exposure to oral environments, especially those containing fluorides, can trigger corrosive processes that compromise its structural integrity and, consequently, its clinical efficacy [1,3]. Recent studies have highlighted the importance of understanding the corrosion mechanisms of titanium in fluoride-containing solutions due to the direct impact on the osseointegration process and the durability of biomedical implants [1,2,4–7].
Fluoride ions are aggressive ions that can degrade the protective oxide layer formed on titanium and its alloys. This degradation can be influenced by variables such as fluoride concentration, pH of the environment, material selection and passive film formation [5,8–11]. Studies show that the corrosive behavior of titanium is sensitive to changes in environmental conditions, therefore optimizing fluoride content and understanding its interactions remain crucial to ensuring the material's long-term performance [8,12–17].Considering the importance of titanium and its alloys in dental implants and other biomedical applications, as well as the prevalence of fluoride in oral hygiene products [18], investigation of frictional corrosion behavior of commercially pure (CP) titanium in artificial saliva with varying concentrations of fluoride ions is very important. Higher fluoride concentrations were associated with an increased corrosion rate and more significant surface damage to the material.
The chemical stability and biocompatibility of titanium results from the formation of a highly protective passive film on the surface [9,19]. As demonstrated in a recent study, the annealing temperature governs two critical microstructural phenomena in cold-rolled CP Ti: grain growth and phase transformation. While lower temperatures induce recovery and partial recrystallization. Annealing at higher temperatures (above 700 °C) leads to substantial grain growth. Crucially, rapid cooling from these elevated temperatures promotes the precipitation of the metastable acicular α’ (alpha-prime) martensite phase [20]. These specific microstructural changes—grain coarsening and martensitic transformation—directly influence the thermodynamic stability of the passive film and, consequently, the corrosion rate of the metal [21,22].
In this context, the integrity of titanium in fluoride-containing environments is governed by a complex interdependence of microstructural and electrochemical factors. While the impact of grain size and crystallographic texture on corrosion resistance is well-established in current literature [20,23–26], a critical gap remains regarding the electrochemical implications of thermally induced phase transformations, specifically the influence of the metastable α′ (alpha-prime) martensite phase. Distinguishing itself from conventional approaches, the present work systematically elucidates the correlation between annealing temperature, the evolution of the microstructural matrix, including recovered and recrystallized states to α′-phase precipitation, as well as the thermodynamic stability of the passive film in fluoridated artificial saliva. The results presented herein aim not only to fill this data scarcity but also to establish guidelines for microstructural design through thermal processing, ensuring superior clinical performance in biomedical devices.
Experimental Procedure
Sample preparation
The CP titanium strip was supplied in a hot-rolled and homogenized condition with a thickness of 4.62 mm. Table 1 shows its chemical composition. A sample measuring 141 × 77.3 × 4.62 mm was cold rolled using a Fröhling laboratory rolling mill at a speed of 6.25 m/min. The reduction was achieved in 12 passes, reaching 66%, resulting in a final thickness of 1.56 mm. Strips 10 mm wide were cut from the cold-rolled strip and annealed for 30 min at temperatures of 400°C, 500°C, 600°C, 700°C, 800°C, and 900°C in a Linn ElektroThermelectric furnace, followed by rapid quenching in agitated water, at approximately 300ºC/s. Temperatures were chosen from the parameters of beginning of recrystallization and phase transformation, which occurs between 500°C-600°C, so an initial lower value was due, and a higher 900°C, respectively.
|
Elements |
C |
H |
N |
O |
Fe |
Ti |
|
CP Ti |
0.023 |
<0.015 |
0.0009 |
0.0028 |
0.170 |
Bal. |
Microstructural and mechanical characterization
The samples for X-ray diffraction (XRD) analysis were prepared using conventional metallography, ending with a final polish with 1 μm diamond paste. Afterward, the samples were removed from the mounting material. The analysis was conducted using a Panalytical Empyrean diffractometer with Cu(Kα) radiation (λ=0.15418 nm), scanning angles from 20° to 100° with a reading time of 0.01 s-¹.
The Future Tech FM700 instrument was used for Vickers microhardness tests. Twenty indentations per sample were performed, applying a load of 500 gf for 10 s. For microstructural characterization, SEM analysis was performed on samples that underwent conventional metallographic preparation and were etched with Kroll's etchant. Representative samples were analyzed via electron backscatter diffraction (EBSD). The data were post-processed using EDAX OIM Analysis™ software. EBSD examinations were conducted using a JEOL JSM 7100F FEG SEM.
The micro and substructure after cold-rolled and annealing was examined by TEM (JEOL JEM-2100Plus) with a potential of 200 kV. The TEM foils were prepared, in the rolling plane, by mechanical thinning followed by conventional twinjet electropolishing Strüers® Tenupol-5 working at a voltage of 20 V under liquid nitrogen cooling, close to -20°C. The electrolyte contained 5 vol.% of perchloric acid and 95 vol.% of ethanol.
Electrochemical tests
Samples were mounted in epoxy resin after establishing electrical contact with a copper wire. Prior to analysis, the working electrodes were prepared by sequentially grinding with abrasives of 100, 240, 320, 400, and 600 mesh, followed by cleaning with alcohol and rinsing with water. The junction between the sample and resin was carefully sealed with Araldite epoxy glue to avoid crevice formation.
Electrochemical tests were conducted using a conventional three-electrode cell. The reference electrode was saturated Ag/AgCl, and the counter electrode was platinum. Three independent specimens were used for each experimental condition (n = 3), and the electrochemical tests were performed individually on each specimen. The parameters obtained from the polarization curves and electrochemical impedance spectroscopy measurements were determined for each replicate, and the results are reported as mean ± standard deviation. Measurements were carried out using an AUTOLAB PGSTAT302N potentiostat coupled with an FRA32M frequency response analyzer. Before the tests, each sample was exposed to a fluorinated agent-topical application of 1.23% fluoride gel (pH 3.5) for 8 min and then immersed in artificial saliva solution pH 5.8. Table 2 below presents the composition of the artificial saliva solution.
|
Components |
Concentration (g/L) |
|
NaCl |
0.40 |
|
KCl |
0.40 |
|
CaCl2.2H2O |
0.795 |
|
NaH2PO4.2H2O |
0.780 |
|
Na2S.9H2O |
0.005 |
|
CO(NH2)2 |
1.0 |
For potentiodynamic polarization (PP) tests, the open circuit potential (OCP) was determined after 1 h of immersion, and the scan was performed in the range of -500mVAg/AgCl to 1200 mVAg/AgCl at a scan rate of 1 mV/s. The polarization tests were conducted at 25°C. In the case of electrochemical impedance spectroscopy (EIS) tests, the samples were immersed for 0, 24, 48, and 72 h in artificial saliva at 37°C, and, after each immersion time, the samples were subjected to EIS test in the frequency range of 10 kHz to 10 mHz, with a perturbation potential of 10 mV and 10 points per decade. The temperature of 37°C was selected to represent a condition close to physiological temperature. Therefore, the polarization and EIS results were considered complementary evaluations of the electrochemical behavior, considering the difference in temperature between the experimental protocols. The impedance data were modeled using NOVA software, version 2.1.
Results and Discussion
X-Ray diffraction analysis
The diffraction patterns for the CP Ti sample in the as-received condition and another cold-rolled 66% (CR) as well as annealed at 900°C for 30 min are presented in Figures 1a and 1b.
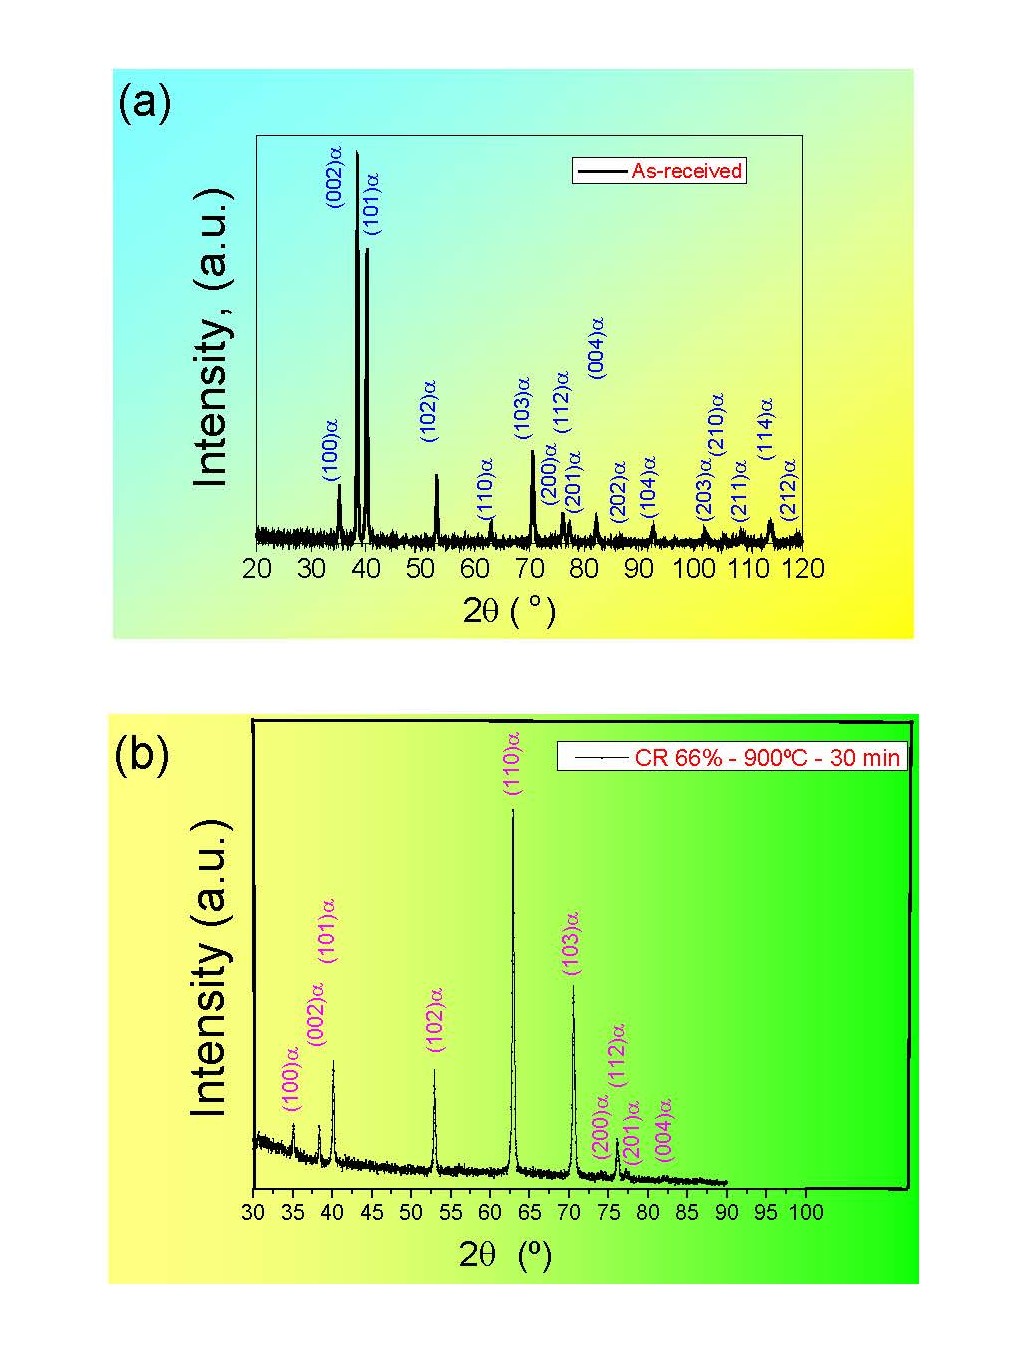
Figure 1. X-ray diffraction pattern referring to the sample of CP Ti (a) as-received, (b) cold rolled 66% and annealed at 900°C for 30 min.
Only the α phase of the metal was identified, whose crystalline structure is defined as hexagonal close-packed (HCP). The β phase (CCC), if present in the alloy, does not appear in the X-ray diffraction pattern due to its low volume fraction. Along this line, the martensite phase (α′) has a crystalline structure very similar to the α phase and did not appear in the XRD pattern.
Microstructural analysis
Scanning electron microscopy-EBSD analysis
The inverse pole figure (IPF) and image quality (IQ) maps shown in Figures 2a–2d illustrate the microstructure of CP titanium in as-received condition (a,b) and after cold rolling with 66% reduction (c,d).The α phase constitutes the entire microstructure and exhibits equiaxed grain morphology, as seen in Figures 2a and 2b. Upon applying cold deformation, the grains become elongated and flattened along the rolling direction (RD), gradually transitioning into a fibrous microstructure, as depicted in Figures 2c and 2d [27].
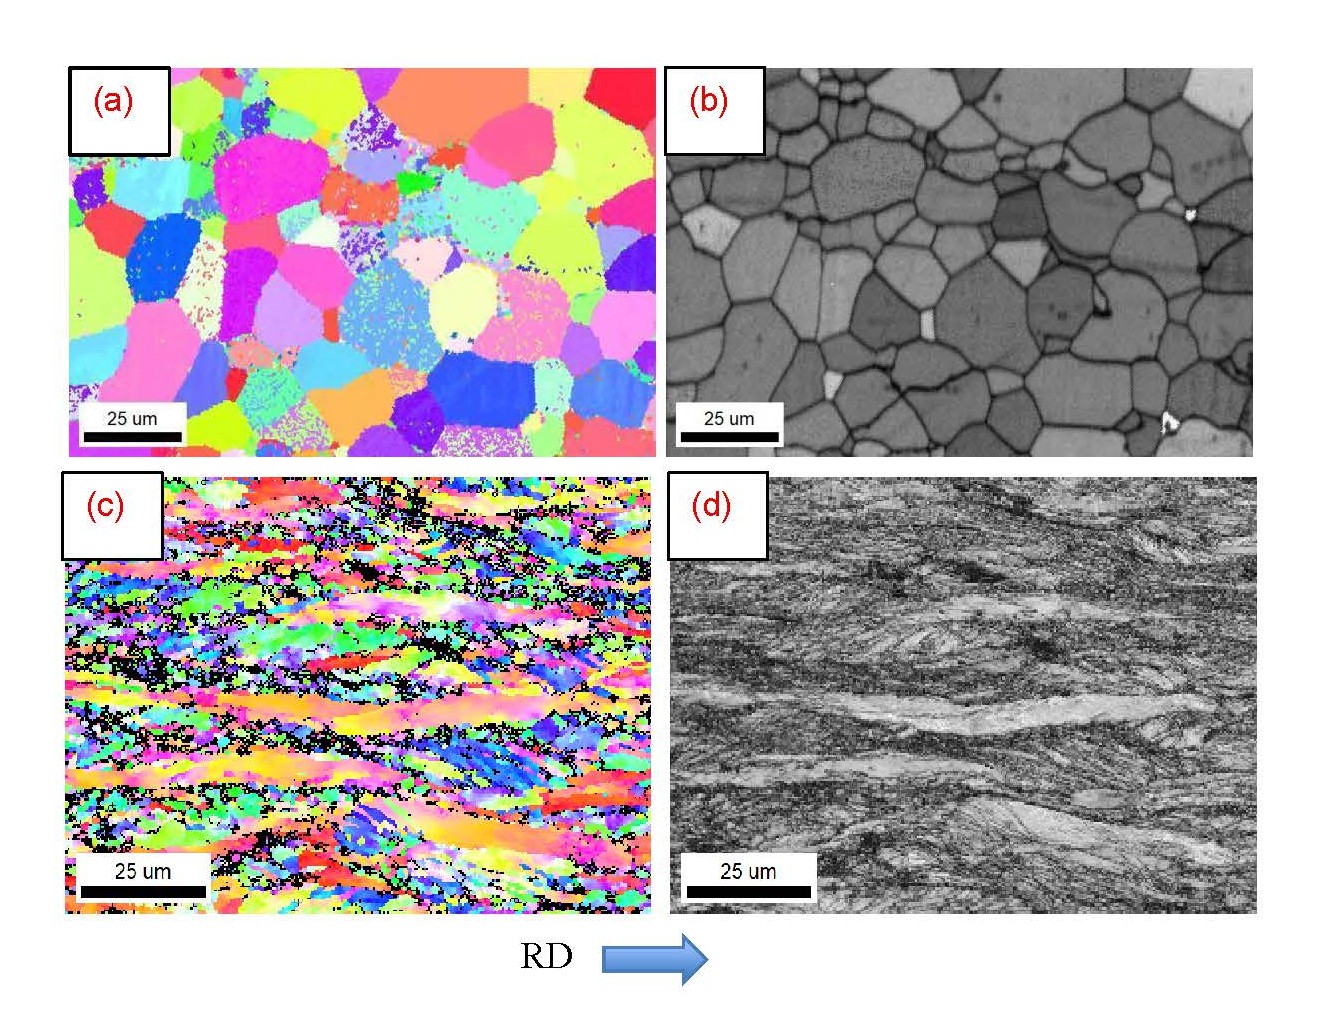
Figure 2. SEM-EBSD micrographs (IPF, IQ) of CP Ti samples: (a,b) as-received, (c,d) cold-rolled 66% (RD: Rolling Direction).
Figures 3a–3f present SEM micrographs of samples as-received (OM), and cold-rolled 66% and annealed for 30 min at 400°C, 600°C, 700°C, and 900°C. A very fine distribution of α-phase grains is observed after annealing at 400°C. Considering that the micrographs in Figures 3b–3d are shown at the same magnification, the recrystallization and grain growth of the metal are evident. In this context, the ease of grain growth is clear, as highlighted in Figures 3e and 3f. Recrystallized nuclei are already visible at annealing temperature of 400°C, as shown in Figure 3b evidenced by red circles.
Figures 3d and 3e provide a closer look at the microstructure of samples annealed at 700°C using higher magnification. Additionally, Figure 3c, 3e, and 3f illustrates the microstructure of the sample after annealing containing the α′-martensite.
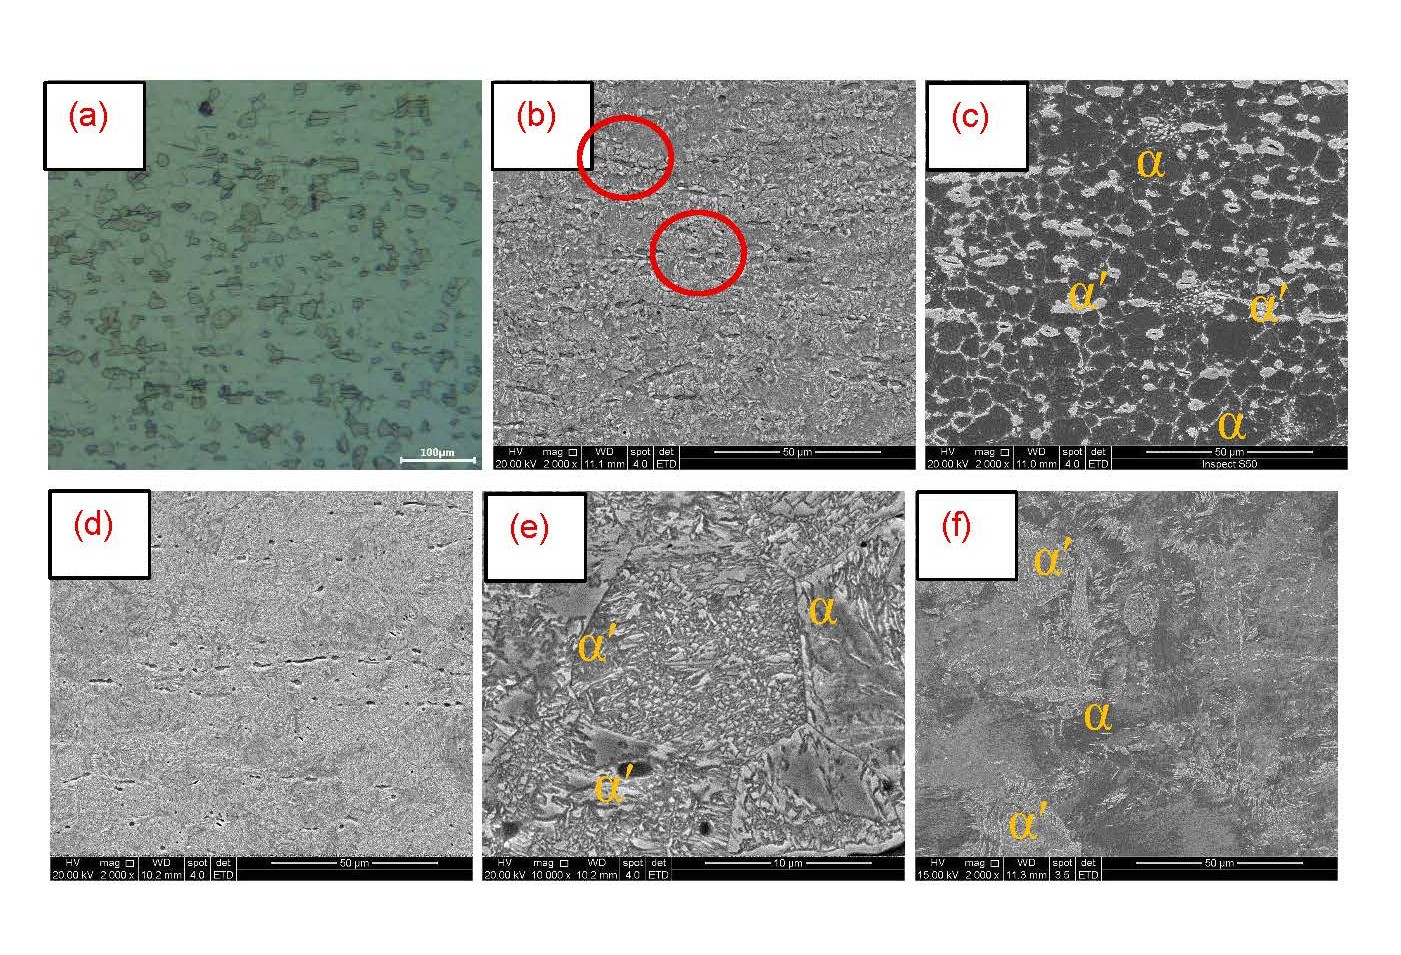
Figure 3. (a) Optical micrograph of the sample as-received. SEM micrographs of CP Ti samples cold-rolled 66% and annealed for 30 min at (b) 400°C, (c) 600°C, (d,e) 700°C, and (f) 900°C.
In view of the potential precipitation of the β phase above 600°C (Figure 4), the SEM micrographs in Figures 3, 5, and 6 can be interpreted in terms of the massive transformation β → α′, which occurred during quenching of the material annealed above 600°C, as illustrated in Figure 4, region where the phases (α + β) coexist. According to Table 1, the Fe content in the metal is 0.17%. This 600°C condition (Figure 4) exceeded the initial temperature for β phase formation and, therefore, water quenching resulted in a martensitic transformation (Figures 3c). In Ti, the differences in crystalline structure between the α and α′ phases are relatively small, making them difficult to distinguish using EBSD or X-ray diffraction techniques. This explains some possible indexing errors between the two phases in the EBSD maps shown in Figures 2, 5 and 6 [28]. In this context, Figure 1 (XRD) confirms that no β phase is present, even in the sample annealed at 900°C.
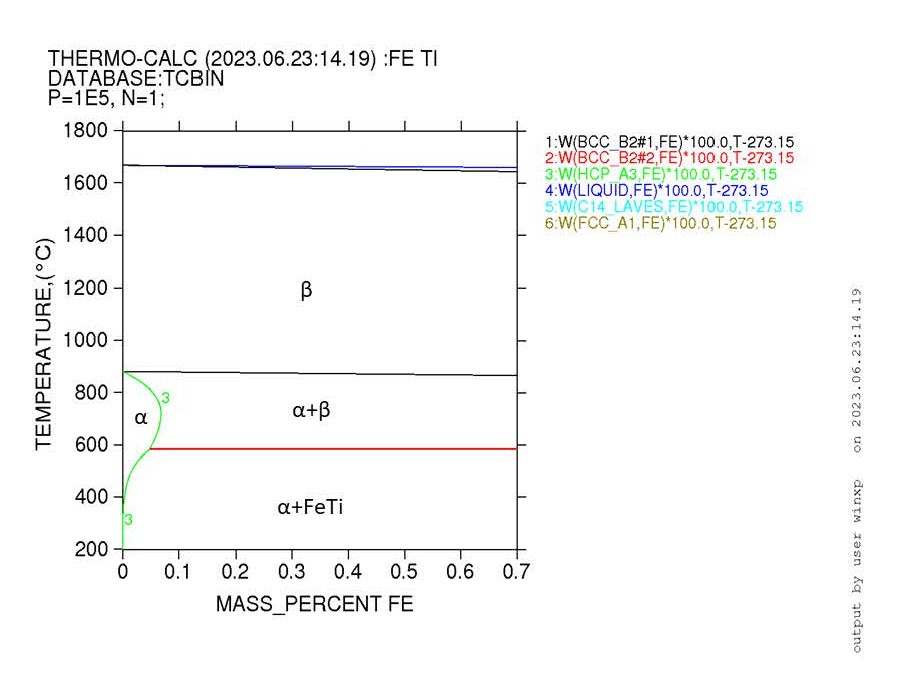
Figure 4. Phase diagram calculated using ThermoCalcTM software based on the chemical composition of the metal (Table 1).
Figure 5a-cillustrate images obtained via the EBSD technique for CP Ti after annealing. Very fine grains were generated due to cold deformation and annealing at a low temperature of 400°C and 500°C for 30 min, Figure 5a and b. This thermomechanical treatment allowed the onset of recovery and recrystallization, with equiaxed grains (black circle) shown in Figure 5b. Many shear bands are observed in Figures 2d, 5a, and 5b, and white areas, Figure 2d. These regions correspond to areas of lower plastic deformation during cold rolling [27] and exhibit delayed recrystallization. A heterogeneous microstructure is observed. Furthermore, deformation twins were not detected after cold rolling. These can be formed at the beginning of the rolling process, that is with a reduction lower than 40% [27].
Annealing at higher temperatures, 600°C (Figure 5c), reveals a recrystallized microstructure, while at 700°C to 900°C, significant grain growth occurs, as shown in Figures 6a–6c.
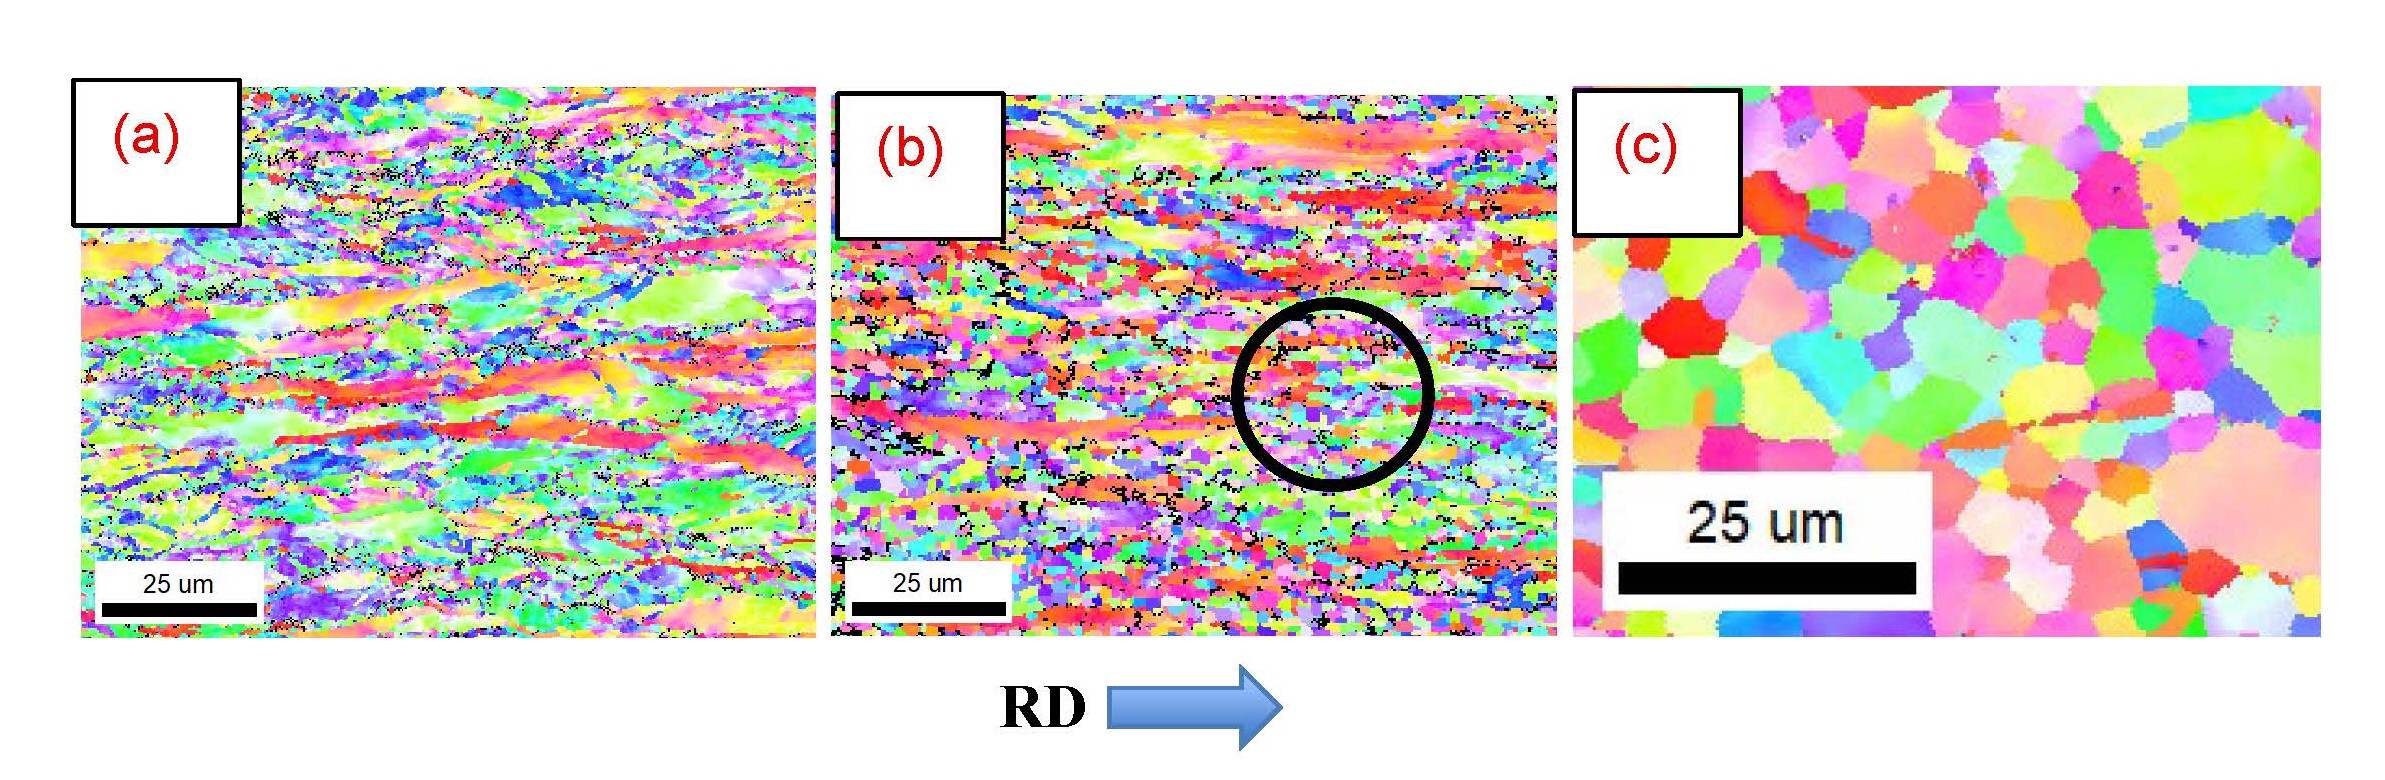
Figure 5. EBSD images of CP titanium. (a,b) IPF. Sample cold-rolled 66% and annealed for 30 min at (a) 400°C, (b) 500°C, (c) 600°C.
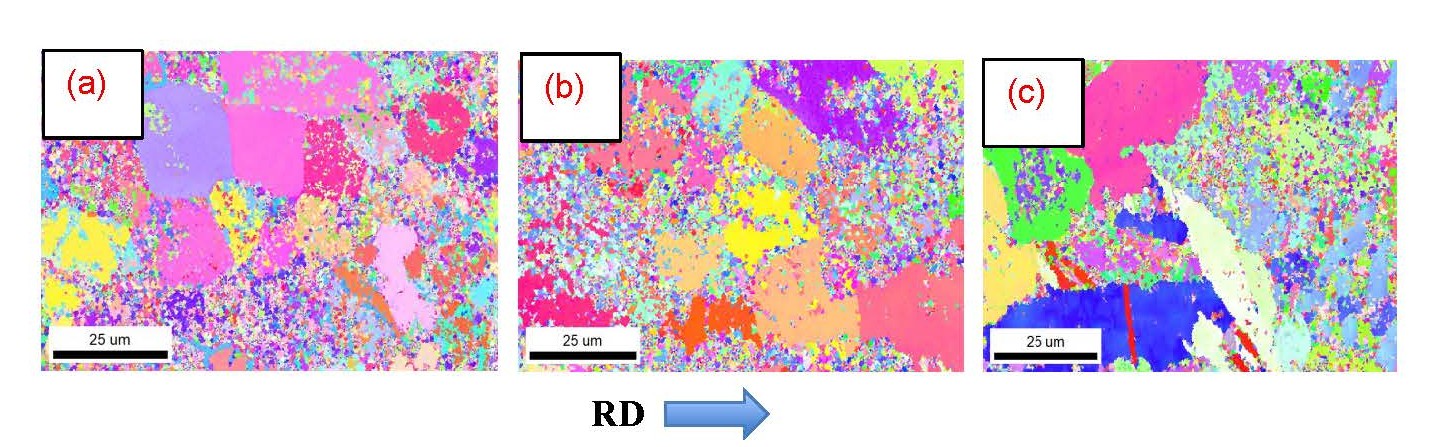
Figure 6. EBSD images (IPF maps) of CP Ti for samples in the as-received condition, cold-rolled, and annealed for 30 min at (a) 700°C, (b) 800°C, and (c) 900°C. Grains containing annealing twins appear in (c).
Substructure analysis by transmission electron microscopy
Figures 7a–7f depicted the TEM micrographs (bright field image in the rolling plane of the sheet) corresponding to CP Ti cold-rolled 66% and annealed samples at 400°C, 600°C, and 800°C for 30 min.
Dislocations in high concentration were observed in the microstructure of cold-rolled CP Ti sample in Figure 7a. Grains were not very well defined, and grain boundaries were not sharp due to internal stress after cold deformation, but a cellular substructure and even subgrains were formed. Figure 7b shows circles of diffraction spots observed in diffraction patterns. The rings in the diffraction patterns were quite broken, indicating the presence of subgrains with low-angle grain boundaries (Figure 7b). The selected area diffraction pattern showed elongated spots or arcs for the (0002) reflection, indicating a preferential (0002) orientation [29].
The application of cold deformation of coarse-grained Ti was accompanied by the formation of dislocation substructures such as dislocation clusters, dense dislocations walls and cellular network, and fragmented substructures [30], as illustrated in Figures 7b. For the sample, annealed at 400°C, the substructure is only recovered, Figure 7c, so the cold-rolled state still remains. A specific feature of this structure is a significant density of dislocations and small angle sub boundaries, which ensure a high level of the long range fields of internal stresses.
After annealing at 600°C for 30 min, most equiaxed subgrains of 200 nm reveal the characteristics of recrystallized and dislocation free fine grains, but some of them still retain a high dislocation density (Figure 7d).
There were significant changes in the substructure after annealing at 600°C when compared to cold-rolled and annealed at 400°C conditions. In this sense, the decrease of spreading of diffraction spots in the SAED patterns with the increase of annealing temperature suggested a decrease of internal stresses, which means ordering of the defect substructure [30]. This decrease meant the removal of dislocations into sinks at grain boundaries and annihilation of opposite sign dislocations, while the ordering of the defect structure means the arrangement of dislocations in subgrains structure (Figure 7b).
Micrographs obtained by TEM of the sample cold-rolled 66% and annealed at 800°C for 30 min are illustrated in Figures 7e and 7f. Some dislocation arrangements persist in the substructure after annealing. A triple junction of high-angle grain boundaries is shown in Figure 7e. The crystal lattice is identified in Figure 7. These correspond to (HCP) α+α’ phases.
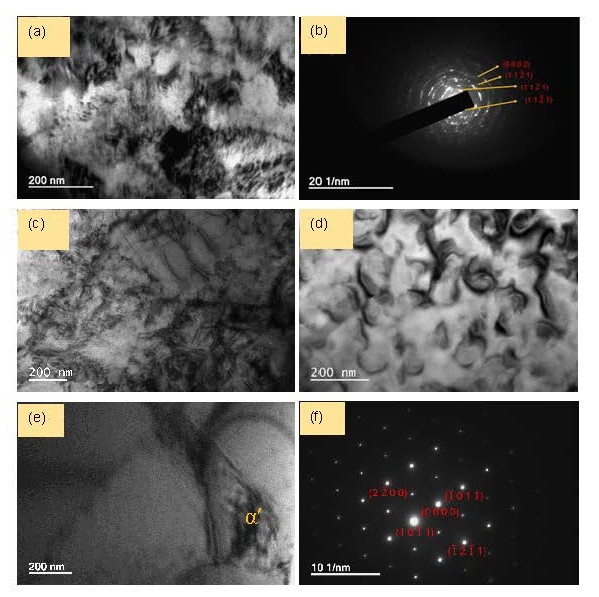
Figure 7. Micrographs obtained in TEM of the sample (a) cold-rolled with 66% reduction, (b) electron diffraction pattern of central region showed in (a). Sample of cold-rolled 66% and annealed at (c) 400°C, (d) 600°C, (e) 800°C for 30 min, (f) SADP of central region showed in (e).
Mechanical property evaluation
Figure 8 shows the Vickers microhardness (HV) values for CP Ti samples annealed between 400°C and 1000°C for 30 min. The results indicate that CP Ti exhibits higher hardness in the annealed condition compared to the as-received sample. The first increase in hardness occurred due to the plastic deformation imposed on the metal during cold rolling 66%. Hardening was observed from the as-received condition, 167HV, to cold rolling with 66% reduction, 239HV. This work hardening was caused by an increase in crystal lattice defects, such as dislocations, vacancies, and lattice distortion [27–30]. At the initial annealing temperature of 400°C (224 HV), the primary process observed is static recovery. However, some nuclei of incipient recrystallization were found, as shown in Figure 3b. Recrystallization of the metal increases at 600°C (Figure 5c) and becomes more pronounced at 700°C (Figure 6a). At temperatures above 800°C, significant grain growth occurs, as seen in Figures 6a–6c, and hardness values are leveled (Figure 8). The microhardness values should decrease as a function of the increase in temperature due to recrystallization and grain growth that occur in the alloy. However, these values stabilize and increase drastically for higher temperatures, 1000°C (Figure 8). The sample annealed at 1000°C was used as a reference, since its microstructure is basically formed by α′-martensite. Its microhardness corresponds to 200HV. That is, the hardness of the martensitic alloy is greater than that of the dual-phase alloy (α+α′). The increase in the volume fraction of α′-martensite as the annealing temperature increases can be seen in Figure 3, i.e., the areas of light gray tone increase with this temperature.
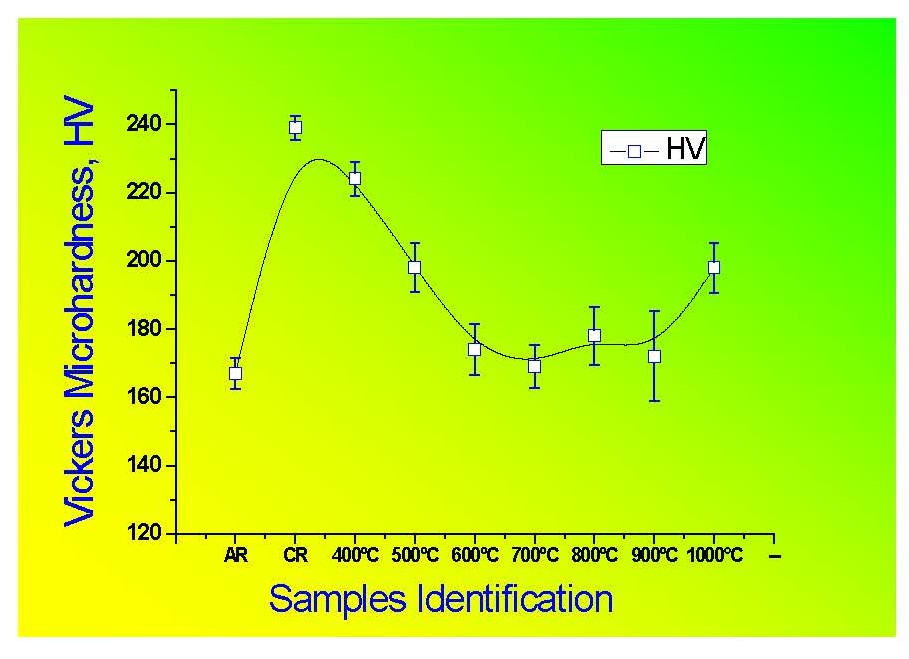
Figure 8. Vickers microhardness of CP titanium for samples annealed between 400°C and 1000°C for 30 min, after cold rolling with 66% reduction. The hardness of the samples as-received (AR) and cold-rolled (CR) were also included in the results.
Electrochemical behavior
Table 3 and Figure 9 present the results of the polarization tests performed on the samples. Based on the obtained curves, Tafel extrapolation was performed to estimate electrochemical parameters, including corrosion potential (Ecorr), corrosion current density (Icorr), and passivation current density (Ipass).
|
SAMPLE |
Icorr (µA/cm2) |
ECORR (V) |
IPASS(µA/cm2) |
|
AR |
3.10 ± 0.42 |
-0.52 ± 0.15 |
19.0 ± 10 |
|
CR |
2.10 ± 0.25 |
-0.489 ± 0.066 |
15.4± 3.2 |
|
CR400 |
8.30 ± 1.1 |
-0.25 ± 0.15 |
21.0 ± 8.4 |
|
CR500 |
2.46 ± 0.32 |
-0.47 ± 0.12 |
19.7 ± 7.5 |
|
CR600 |
2.80 ± 0.18 |
-0.495 ± 0.071 |
8.9 ± 0.20 |
|
CR700 |
7.30 ± 1.0 |
-0.48 ± 0.12 |
14.8 ± 1.0 |
|
CR800 |
3.76 ± 0.51 |
-0.46 ± 0.11 |
9.1 ± 1.1 |
|
CR900 |
1.40 ± 0.18 |
-0.559 ± 0.073 |
19.9 ± 1.5 |
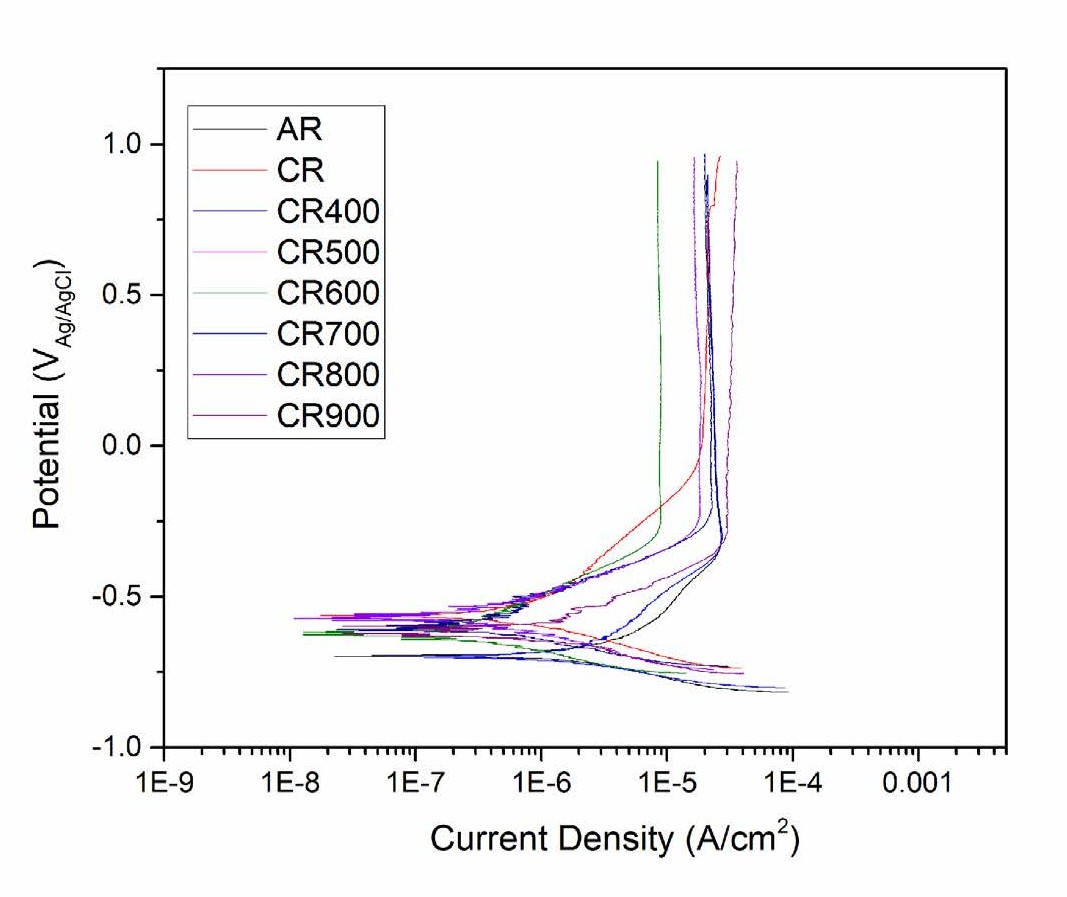
Figure 9. Potentiodynamic polarization curves.
The electrochemical behavior of commercially pure titanium (CP Ti) is influenced by its microstructure, which is modified by cold rolling and subsequent annealing treatments. In this study, samples subjected to heat treatments between 400 and 900°C were evaluated in order to correlate the microstructural changes with the parameters obtained from the polarization tests. The results demonstrate that the electrochemical response depends on the parameter considered. Among the investigated conditions, CR900 exhibited the lowest mean Icorr value (1.40 ± 0.18 µA/cm²), whereas CR600 and CR800 presented the lowest Ipass value (8.95 ± 0.20 µA/cm² and 9.1 ± 1.1 µA/cm², respectively). Therefore, the Icorr and Ipass results do not indicate a single condition as superior with respect to all aspects of the electrochemical response.
The lower passivation current density observed for CR600 and CR800 suggests a favorable response of the material within the passive region. This behavior may be related to the microstructural evolution promoted by annealing, which reduces the density of defects introduced during cold deformation and promotes recrystallization. The reduction in defects, such as dislocations and high-energy regions, may modify the electrochemical activity of the surface, since these regions can act as preferential sites for corrosion-related processes [9,29].
The microstructural evolution observed between 400 and 900°C is associated with recovery, recrystallization, and subsequent grain-size evolution, phenomena that modify the defect density and grain-boundary configuration. The formation and evolution of recrystallized structures in deformed titanium depend on the deformation history and heat-treatment temperature [26,30]. The CR400 and CR700 conditions exhibited the highest mean Icorr values, 8.3 ± 1.1 and 7.3 ± 1.0 µA/cm², respectively, whereas CR900 presented the lowest value, 1.40 ± 0.18 µA/cm². This behavior indicates that the reduction in Icorr does not follow a monotonic trend with increasing annealing temperature and, therefore, cannot be attributed exclusively to the degree of recrystallization or grain growth.
The microstructural evolution during annealing should therefore be considered together with the electrochemical response. At lower temperatures, such as 400°C, recovery and partial recrystallization may preserve part of the deformed structure and the defects associated with cold rolling. With increasing temperature, greater recrystallization and changes in grain size and morphology occur. In agreement with this evolution, annealing for 30 min between 400 and 900°C resulted in a reduction in microhardness compared with the cold-rolled condition, although the values remained slightly higher than those of the as-received condition. The most pronounced reduction in microhardness occurred at 700°C, associated with the formation of new recrystallized grains and subsequent changes in grain size, as shown in Figures 6a and 7e [26,30].
In addition to the thermal variations investigated, partial recrystallization plays an important role in modifying the microstructure, including changes in grain-boundary configuration. These microstructural modifications may affect both the mechanical properties and the electrochemical response of CP Ti [26,29].
The observed electrochemical response is also related to the ability of CP Ti to form and maintain a passive oxide film. In environments simulating oral conditions, prolonged interaction between the titanium surface and the electrolyte may modify the electrochemical response of the material [15,32]. In this context, the lower Ipass values observed for CR600 and CR800 indicate a favorable response within the passive region, whereas the lowest Icorr observed for CR900 does not follow the same trend as Ipass. Therefore, the effect of the heat treatment (largest volume fraction of α¢) should be interpreted by considering the polarization parameters together with the EIS results.
Control of the annealing conditions is therefore important for modifying the microstructure of CP Ti and its electrochemical response. Changes in grain structure, recrystallization state, and defect density promoted by heat treatment may modify the interaction between the metallic surface and the electrolyte and, consequently, the formation and stability of the passive film [9,15,29,32]. In this context, the polarization and EIS results should be considered together, since they provide complementary information regarding the electrochemical response of the material.
The analysis and fitting of the EIS spectra were performed using Nova 2.1.7 software. The equivalent electrical circuit (EEC) proposed in Figure 10 was used to physically model the alloy/electrolyte interface. In this circuit, Rs represents the solution resistance (electrolyte) and Rf represents the passive film resistance (oxide film). A Constant Phase Element (CPE) was introduced to describe the capacitive response of the film, replacing an ideal capacitor to compensate for surface inhomogeneities and the non-ideal nature of the passive film.

Figure 10. Equivalent electrical circuit.
Table 4 and Figure 11 present the impedance data obtained from electrochemical impedance spectroscopy (EIS) measurements. The modeling of the EIS data allowed for the determination of the film resistance (Rf), which represents the protective capacity of the passive layer formed on the surface of CP Ti. The evolution of Rf over different immersion times provided information on the stability and degradation mechanisms of the passive film.
|
TIME |
0 h |
24 h |
48 h |
72 h |
|
AR |
0.088 ± 0.0060 |
4.88 ± 0.65 |
3.650 ± 0.051 |
4.01 ± 0.056 |
|
CR |
2.38 ± 0.38 |
1.93 ± 0.29 |
3.05 ± 0.32 |
2.87 ± 0.39 |
|
CR400 |
0.098 ± 0.0040 |
7.16 ± 0.94 |
14.40 ± 0.14 |
25.10 ± 0.38 |
|
CR500 |
0.076 ± 0.0070 |
3.52 ± 0.36 |
13.70 ± 0.14 |
42.10 ± 0.58 |
|
CR600 |
0.156 ± 0.084 |
1.60 ± 2.2 |
0.76 ± 0.93 |
1.26 ± 0.15 |
|
CR700 |
1.39 ± 0.96 |
9.02 ± 0.29 |
10.60 ± 1.3 |
17.8 ± 2.3 |
|
CR800 |
0.209 ± 0.011 |
5.62 ± 0.50 |
7.20 ± 1.0 |
102 ± 12 |
|
CR900 |
0.847 ± 0.022 |
0.751 ± 0.013 |
0.532 ± 0.062 |
0.293 ± 0.010 |
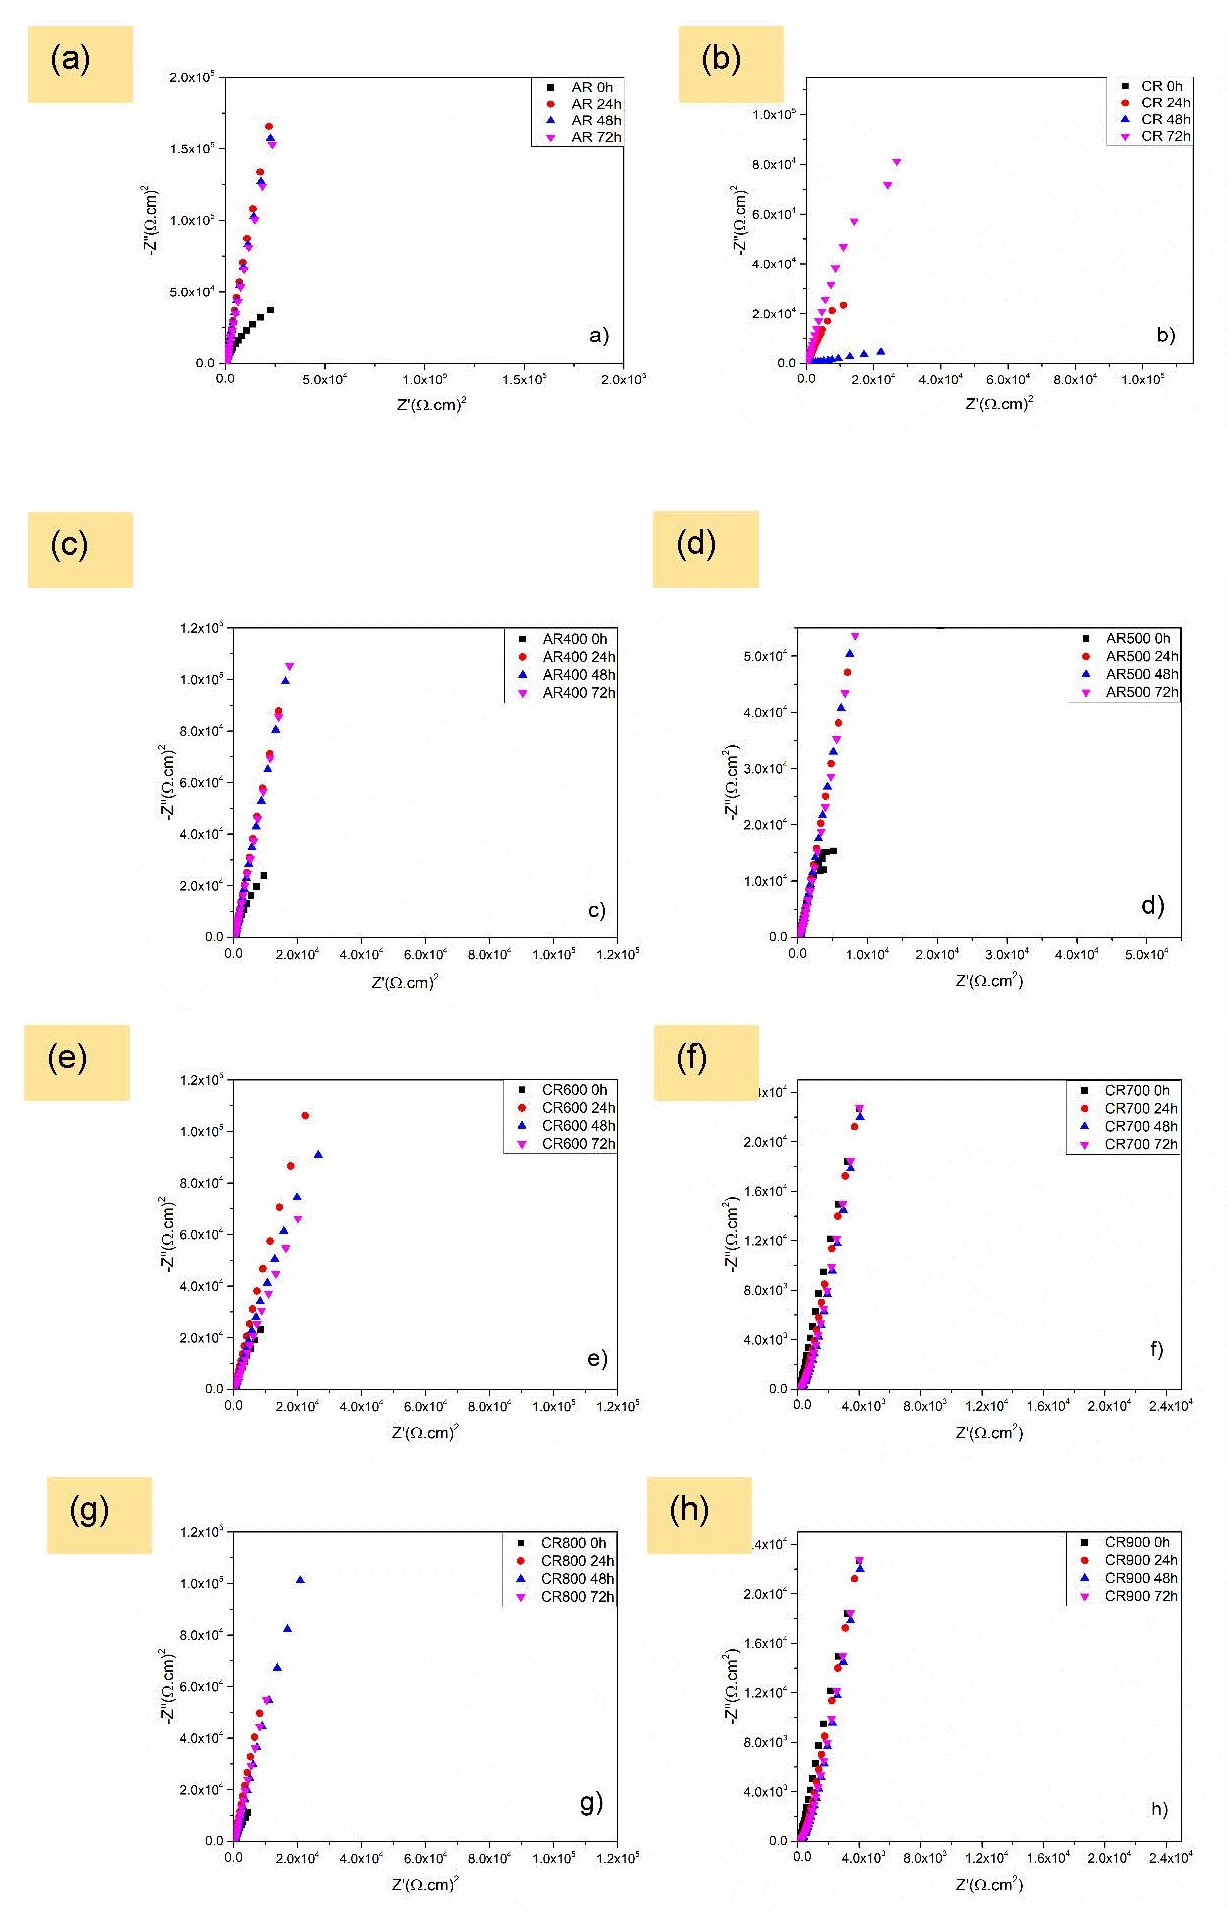
Figure 11. Nyquist diagrams obtained from EIS tests: (a) AR, (b) CR, (c) CR 400, (d) CR 500, (e) CR 600, (f) CR 700, (g) CR 800, and (h) CR 900.
The influence of immersion on the electrochemical behavior of CP Ti is a determining factor in its application for medical and dental devices, particularly in simulated physiological environments. Electrochemical impedance spectroscopy (EIS) analysis provides a detailed understanding of corrosion mechanisms, and the stability of the passive layer formed on the material’s surface [32].
The microstructural evidence indicates that the 1000°C reference sample has a predominantly α′-martensitic structure. In addition, the acicular morphologies observed in samples annealed at higher temperatures (Figures 3 and 8) are consistent with an increased fraction of this phase. Overall, these findings indicate that the evolution of α′ martensite plays an important role in the electrochemical response observed under higher-temperature annealing conditions. Among the samples evaluated electrochemically, CR900 exhibited the lowest Icorr (1.40 ± 0.18 µA/cm²). However, its Ipass (19.9 ± 1.5 µA/cm²) was higher than those of CR600 and CR800, while Rf decreased from 0.847 ± 0.022 MΩ·cm² at the beginning of immersion to 0.293 ± 0.010 MΩ·cm² after 72 h. This combination of results indicates that the electrochemical performance of CR900 depends on the parameter being considered. While CR900 exhibited the lowest corrosion current density, suggesting reduced corrosion kinetics, its passive-film resistance decreased during immersion, indicating a less favorable evolution of the passive layer. The microstructure developed at higher temperatures, including the possible contribution of α′-martensite, may be related to this behavior, which also reflects the interaction between phase morphology and passive-film stability. This interpretation is consistent with studies of laser-welded CP-Ti joints tested in simulated saliva [37], in which α′-martensite morphology was related to Icorr and charge-transfer resistance. In that system, the martensite-containing fusion zone exhibited better corrosion performance than the base material. Taken together, these results indicate that the influence of α′ depends on its morphology and the microstructural context; therefore, it cannot be described as a uniform decrease in corrosion resistance or assessed using a single electrochemical parameter.
Prolonged immersion of CP Ti in biological media, such as artificial saliva and bodily fluids, significantly influences its electrochemical response. Initially, the formation of a titanium oxide (TiO2) layer contributes to a high degree of passivation, reducing corrosion current density and increasing polarization resistance [15]. However, over time, continuous interaction with ions in the medium can lead to structural modifications of this layer, making it more susceptible to electrochemical degradation processes.
The film resistance (Rf) was used to evaluate the evolution of the metal/electrolyte interface during immersion in artificial saliva. The evolution of this parameter is directly related to the microstructural modifications promoted by cold deformation and subsequent annealing treatments. As observed in the microstructural characterization (Figures 3, 5, and 6), cold rolling produced a highly deformed structure, whereas increasing the annealing temperature promoted progressive changes in grain morphology, recrystallization state, and defect density. These microstructural modifications are relevant to the electrochemical response because regions associated with a high density of defects and increased internal energy may exhibit greater electrochemical activity and influence the formation and stability of the passive layer [9,26,29,30].
The Rf values obtained at the different immersion times (0, 24, 48, and 72 h) revealed that the electrochemical response was not static and exhibited distinct behaviors depending on the microstructural condition resulting from the annealing treatment. At the initial stage (0 h), the cold-rolled condition (CR) presented an Rf of 2.38 ± 0.38 MΩ·cm², whereas CR400, CR500, CR600, CR700, CR800, and CR900 presented lower values of 0.0980 ± 0.0040, 0.0760 ± 0.0070, 0.156 ± 0.084, 1.39 ± 0.96, 0.209 ± 0.011, and 0.847 ± 0.022 MΩ·cm², respectively. This initial difference indicates that the microstructural state produced by the thermomechanical processing already affects the electrochemical response of the interface prior to prolonged exposure to the electrolyte.
This behavior can be related to the microstructural evolution observed after annealing. At lower temperatures, the microstructures still exhibit features associated with the deformed condition, whereas increasing the temperature promotes progressive recovery and recrystallization, accompanied by changes in grain size and morphology, as observed in Figures 5 and 6. The reduction in defect density associated with recovery and recrystallization may modify the electrochemically active sites present at the surface, thereby affecting the interaction between the metal and the electrolyte [9,26,29,30]. Thus, the differences in the initial Rf values may be associated not only with the treatment temperature itself, but primarily with the microstructural state resulting from each annealing condition.
As the exposure time increased, a distinct evolution of the interfacial resistance was observed for the different conditions. After 24 h, the highest Rf values were obtained for CR700 (9.02 ± 0.29 MΩ·cm²) and CR400 (7.16 ± 0.94 MΩ·cm²), followed by CR800 (5.62 ± 0.50 MΩ·cm²). After 48 h, the values increased further for CR400 (14.40 ± 0.14 MΩ·cm²), CR500 (13.70 ± 0.14 MΩ·cm²), CR700 (10.60 ± 1.38 MΩ·cm²), and CR800 (7.2 ± 1.0 MΩ·cm²). This increase in Rf during immersion suggests an evolution of the metal/electrolyte interface toward a condition with greater resistance to charge transfer and/or conduction through the passive region. In Ti systems, this behavior is consistent with the ability of the material to form and maintain a passive oxide layer when exposed to an aqueous electrolyte [15,32].
The CR800 condition exhibited the most pronounced behavior during immersion, reaching an Rf of 102 ± 12 MΩ·cm² after 72 h. This result is associated with the microstructure obtained after heat treatment at 800°C, which presents a higher degree of recrystallization and a grain structure distinct from those of the conditions treated at lower temperatures, as observed in the microstructural characterization (Figures 5 and 6). The evolution toward a predominantly recrystallized microstructure, together with the reduction in deformation-related defects, may favor a more homogeneous surface response during exposure to the electrolyte. Therefore, the high Rf observed for CR800 after 72 h may be related to the combination of its recrystallization state and the evolution of the passive interface during immersion.
The CR500 condition also deserves attention, since its Rf increased from 0.0760 ± 0.0070 MΩ·cm² at 0 h to 42.10 ± 0.59 MΩ·cm² after 72 h. This pronounced increase occurred even though its microstructure still exhibited features associated with recovery and partial recrystallization, as observed in Figures 5 and 6. This result demonstrates that a partially recrystallized microstructure does not necessarily result in low interfacial resistance during prolonged exposure. Rather, the evolution of the surface in contact with the electrolyte may contribute to the progressive increase in Rf over time.
CR600 exhibited a distinct evolution of Rf, with values of 0.156 ± 0.084, 1.6 ± 2.2, 0.76 ± 0.93, and 1.26 ± 0.15 MΩ·cm² after 0, 24, 48, and 72 h, respectively. Although this condition presented the lowest Ipass value in the potentiodynamic polarization tests (8.95 ± 0.20 µA/cm²), its EIS response did not follow the same trend. This behavior reinforces that Ipass and Rf represent different aspects of the electrochemical response. The lower Ipass indicates a lower current density within the passive region during polarization, whereas Rf describes the resistive response of the interface during prolonged exposure to the electrolyte. Therefore, the combined interpretation of the results is necessary to establish the relationship between microstructure and electrochemical behavior.
The CR900 condition exhibited a different behavior from the other samples, with a continuous decrease in Rf during the immersion period, from 0.847 ± 0.022 MΩ·cm² at 0 h to 0.751 ± 0.013, 0.532 ± 0.062, and 0.293 ± 0.010 MΩ·cm² after 24, 48, and 72 h, respectively. This evolution may be associated with the microstructural changes promoted by the high-temperature treatment, including grain-size evolution and the structure obtained after cooling, as observed in the microstructural characterization. The high temperature treatment produces a microstructural condition significantly different from those obtained at intermediate temperatures, which may modify the interaction between the surface and the electrolyte and the evolution of the passive interface during immersion.
The relationship between the EIS results and the mechanical properties is also relevant. As shown in Figure 7, annealing promoted a reduction in microhardness relative to the cold-rolled condition, associated with recovery and recrystallization of the deformed microstructure. The decrease in hardness therefore accompanies the evolution of the deformation state of the matrix and the reduction in defect density. However, the electrochemical response did not exhibit a monotonic trend with either microhardness or annealing temperature, indicating that the corrosion behavior results from the interaction among different microstructural characteristics and the evolution of the interface during electrolyte exposure [26,29].
When the EIS results are analyzed together with the polarization tests, different heat-treatment conditions exhibit distinct responses depending on the electrochemical parameter considered. CR900 presented the lowest Icorr (1.40 ± 0.18 µA/cm²), whereas CR600 presented the lowest Ipass (8.95 ± 0.20 µA/cm²). On the other hand, CR800 exhibited the highest Rf after 72 h of immersion (102 ± 12 MΩ·cm²), followed by CR500 (42.10 ± 0.59 MΩ·cm²) and CR400 (25.10 ± 0.38 MΩ·cm²). These differences demonstrate that annealing temperature affects different mechanisms associated with the electrochemical response and that no single parameter is sufficient to describe the corrosion behavior of CP Ti.
Overall, the results indicate that the microstructural evolution promoted by annealing plays an important role in the electrochemical response of CP Ti. Recovery, recrystallization, changes in grain morphology and size, and the reduction in defect density modify the surface and interfacial conditions of the material, which is reflected in the evolution of Rf during immersion [9,26,29,30]. The formation and maintenance of the passive layer also play a fundamental role in this behavior, since titanium exhibits a high ability to passivate in aqueous environments [15,32]. Thus, the combined analysis of polarization, EIS, microstructural, and mechanical data demonstrates that the electrochemical behavior of CP Ti is governed by the interplay between the microstructural state generated by heat treatment and the evolution of the metal/electrolyte interface during exposure.
Conclusions
This study demonstrated that the electrochemical behavior of commercially pure titanium (CP Ti) in a simulated oral environment is influenced by the microstructural modifications promoted by cold rolling and subsequent annealing treatments. The electrochemical analysis revealed distinct responses depending on the parameter considered. In the potentiodynamic polarization tests, CR900 exhibited the lowest mean Icorr value (1.40 ± 0.18 µA/cm²), whereas CR600 and CR800 showed the lowest Ipass values (8.95 ± 0.20 and 9.1 ± 1.1 µA/cm², respectively). In the EIS measurements, CR800 exhibited the highest Rf after 72 h of immersion (102 ± 12 MΩ·cm²), followed by CR500 and CR400.
From a metallurgical perspective, these differences are associated with the evolution of the deformation state, recovery and recrystallization, as well as changes in grain morphology and size. The microstructural evidence also indicates the formation of a predominantly α′-martensite structure in the 1000°C reference sample, together with acicular morphologies in the higher-temperature conditions. The response of CR900 illustrates the interaction between these changes and the electrochemical behavior: although it exhibited the lowest Icorr, this condition showed higher Ipass values than CR600 and CR800 and a decrease in Rf during immersion. Thus, the microstructural evolution associated with α′ may contribute to the passive-film response, together with recovery, recrystallization, grain growth, and defect density.
The results demonstrate that no annealing condition simultaneously maximized all the electrochemical parameters evaluated. CR600 and CR800 presented the lowest Ipass, CR900 the lowest Icorr, and CR800 the highest Rf after 72 h of immersion. Therefore, the selection of a heat treatment condition should consider the electrochemical parameter of interest and the intended application, based on a combined analysis of the polarization, impedance, and microstructural results. Taken together, the findings show that α′-martensite formation is part of the microstructural evolution relevant to corrosion response, whose effect depends on the interaction between the phases present and passive-film stability.
CRediT Authorship Contribution Statement
Sthefanny Ferreira S. Marcelino: Investigation, Methodology, Data curation, Visualization, Writing – original draft. Maria Eduarda Fonseca: Investigation, Data curation, Writing – original draft. Dagoberto Brandão Santos: Project administration, Supervision, Conceptualization, Methodology, Resources, Writing – review & editing. Dalila C. Sicupira: Supervision, Methodology, Formal analysis, Writing – review & editing.
Declaration of Competing Interest
The authors declare that they have no known competing financial interests or personal relationships that could have appeared to influence the work reported in this paper.
Data Availability
Data will be made available on request.
Acknowledgments
The authors would like to thank the support of FAPEMIG, CNPq, CAPES, and PROPPI/UFOP. We thank SENAI Institute of Innovation in Metallurgy and Special Alloys – CIT for support in EBSD and Transmission Electron Microscopy examination.
References
2. Prasad S, Ehrensberger M, Gibson MP, Kim H, Monaco Jr EA. Biomaterial properties of titanium in dentistry. Journal of oral biosciences. 2015 Nov 1;57(4):192–9.
3. Albrektsson T, Wennerberg A. On osseointegration in relation to implant surfaces. Clin Implant Dent Relat Res. 2019 Mar;21 Suppl 1:4–7.
4. Jorge JR, Barão VA, Delben JA, Faverani LP, Queiroz TP, Assunção WG. Titanium in dentistry: historical development, state of the art and future perspectives. J Indian Prosthodont Soc. 2013 Jun;13(2):71–7.
5. Shim HM, Oh KT, Woo JY, Hwang CJ, Kim KN. Corrosion resistance of titanium-silver alloys in an artificial saliva containing fluoride ions. J Biomed Mater Res B Appl Biomater. 2005 May;73(2):252–9.
6. Nakagawa M, Matsuya S, Shiraishi T, Ohta M. Effect of fluoride concentration and pH on corrosion behavior of titanium for dental use. J Dent Res. 1999 Sep;78(9):1568–72.
7. Bhola M, Jena AK, Sethy M, Sharan J. Effect of fluoride toothpaste and mouthwash on the cytotoxicity of buccal mucosa cells in the presence of nickel-titanium archwires during comprehensive orthodontic treatment: A randomized clinical trial. J Oral Biol Craniofac Res. 2025 Jul-Aug;15(4):830–6.
8. Li X, Wang L, Fan L, Zhong M, Cheng L, Cui Z. Understanding the effect of fluoride on corrosion behavior of pure titanium in different acids. Corrosion Science. 2021 Nov 1;192:109812.
9. Cheng H, Luo H, Wang X, Dong C, Li X. Effect of fluoride ion concentration and fluctuating conditions on titanium bipolar plate in PEM water electrolyser environment. Corrosion Science. 2023 Sep 1;222:111414.
10. Mareci D, Bolat G, Cailean A, Santana JJ, Izquierdo J, Souto RM. Effect of acidic fluoride solution on the corrosion resistance of ZrTi alloys for dental implant application. Corrosion science. 2014 Oct 1;87:334–43.
11. Kakaa F, Ferkhi M, Khaled A, Amira S, Eyraud M. Corrosion behavior of electrochemical and thermal treated titanium into artificial saliva: Effect of pH and fluoride concentration. Corrosion and Materials Degradation. 2025 Oct 15;6(4):52.
12. Tredwin CJ, Georgiou G, Kim HW, Knowles JC. Hydroxyapatite, fluor-hydroxyapatite and fluorapatite produced via the sol-gel method: bonding to titanium and scanning electron microscopy. Dent Mater. 2013 May;29(5):521–9.
13. Batebi K, Khazaei BA, Afshar A. Characterization of sol-gel derived silver/fluor-hydroxyapatite composite coatings on titanium substrate. Surface and Coatings Technology. 2018 Oct 25;352:522–8.
14. Chen L, Liang M, Wan W, Tang J, Lin B, Yang X, et al. Corrosion of commercial pure titanium and two titanium alloys in extremely high-chloride and high-alkali seawater electrolysis environment. Journal of Alloys and Compounds. 2025 Mar 15;1020:179431.
15. Faria AC, Rodrigues RC, Rosa AL, Ribeiro RF. Experimental titanium alloys for dental applications. J Prosthet Dent. 2014 Dec;112(6):1448–60.
16. Toniollo MB, Tiossi R, Macedo AP, Rodrigues RC, Ribeiro RF, Mattos Mda G. Effect of fluoride-containing solutions on the surface of cast commercially pure titanium. Braz Dent J. 2009;20(3):201–4.
17. Sailer I, Makarov NA, Thoma DS, Zwahlen M, Pjetursson BE. All-ceramic or metal-ceramic tooth-supported fixed dental prostheses (FDPs)? A systematic review of the survival and complication rates. Part I: Single crowns (SCs). Dent Mater. 2015 Jun;31(6):603–23.
18. Sivakumar B, Kumar S, Narayanan TS. Fretting corrosion behaviour of Ti–6Al–4V alloy in artificial saliva containing varying concentrations of fluoride ions. Wear. 2011 Jan 12;270(3-4):317–24.
19. Ambartsumov MG, Tarala VA, Sizonenko MN, Piskov SI, Chapura OM, Kolodkin MA, et al. Effect of titanium alkoxide on structure, morphology, and biocompatible properties of sol-gel synthesized TiO2 films. Thin Solid Films. 2024 Jul 30;801:140420.
20. de Souza IR, Souza SD, Santos DB. Work-hardening stages and deformation mechanisms during tensile tests of commercially pure titanium containing α′-martensite. Journal of Materials Research. 2025 Sep 15;40(17):2575–92.
21. Lavrys S, Pohrelyuk I, Tkachuk O, Danyliak MO, Shliakhetka K, Skrebtsov A, et al. Microstructure and corrosion resistance of PM titanium doped by TiO2. Corrosion Communications. 2025 Sep;19:129–37.
22. Nichul U, Kumar V, Hiwarkar V. Electrochemical performance of heat-treated beta titanium alloy in artificial saliva: Key role of grain size. Materials Today Communications. 2023 Dec 1;37:106981.
23. Gurao NP, Manivasagam G, Govindaraj P, Asokamani R, Suwas S. Effect of texture and grain size on bio-corrosion response of ultrafine-grained titanium. Metallurgical and Materials Transactions A. 2013 Dec;44(12):5602–10.
24. Balakrishnan A, Lee BC, Kim TN, Panigrahi BB. Corrosion behaviour of ultra fine grained titanium in simulated body fluid for implant application. Trends Biomater. Artif. Organs. 2008 Jul 1;22(1):58–64.
25. Kim WJ, Yoo SJ, Lee JB. Microstructure and mechanical properties of pure Ti processed by high-ratio differential speed rolling at room temperature. Scripta Materialia. 2010 Apr 1;62(7):451–4.
26. Hoseini M, Shahryari A, Omanovic S, Szpunar JA. Comparative effect of grain size and texture on the corrosion behaviour of commercially pure titanium processed by equal channel angular pressing. Corrosion Science. 2009 Dec 1;51(12):3064–7.
27. Bozzolo N, Dewobroto N, Wenk HR, Wagner F. Microstructure and microtexture of highly cold-rolled commercially pure titanium. Journal of materials science. 2007 Apr;42(7):2405–16.
28. Dyakonov GS, Mironov S, Enikeev N, Semenova IP, Valiev RZ, Semiatin SL. Annealing behavior of severely-deformed titanium Grade 4. Materials Science and Engineering: A. 2019 Jan 10;742:89–101.
29. Gu Y, Ma A, Jiang J, Li H, Song D, Wu H, et al. Simultaneously improving mechanical properties and corrosion resistance of pure Ti by continuous ECAP plus short-duration annealing. Materials Characterization. 2018 Apr 1;138:38–47.
30. Yang DK, Cizek P, Hodgson PD, Wen CE. Microstructure evolution and nanograin formation during shear localization in cold-rolled titanium. Acta Materialia. 2010 Aug 1;58(13):4536–48.
31. Shtefan V, Kanunnikova N, Zuyok V. Comparative evaluation of microstructure and electrochemical, high-temperature corrosion rates of titanium-and aluminum-modified black chromium coatings on AISI 304 stainless steel. Surface and Coatings Technology. 2025 Feb 1;497:131706.
32. AlOtaibi AA, Sherif ES, Zinelis S, Al Jabbari YS. Corrosion behavior of two cp titanium dental implants connected by cobalt chromium metal superstructure in artificial saliva and the influence of immersion time. International Journal of Electrochemical Science. 2016 Jul 1;11(7):5877–90.
33. Gao Y, Zhang C, Zhang J, Lu X. Optimization on microstructure and mechanical properties of powder metallurgy TA15 titanium plates by annealing treatment. Materials Characterization. 2025 Mar 1;221:114720.
34. Li DF, Li N, Bai CG, Wang H, Zhang ZQ, Zhao J, et al. Manipulating the orthorhombicity of α" martensite: A novel strategy to tailor yield ratio and break strength–ductility trade-off in titanium alloys. Materialia. 2025 Jun 1;41:102436.
35. Seo DI, Lee JB. Influence of heat treatment parameters on the corrosion resistance of additively manufactured Ti–6Al–4V alloy. Journal of The Electrochemical Society. 2020 Jan 6;167(10):101509.
36. Zhan Z, Zhang Q, Wang S, Liu X, Zhang H, Sun Z, et al. Comparison on the Electrochemical Corrosion Behavior of Ti6Al4V Alloys Fabricated by Laser Powder Bed Fusion and Casting. Materials (Basel). 2024 Jul 4;17(13):3322.
37. Li Z, Zhao W, Yu K, Guo N, Gao S. Effect of heat input on microstructure and corrosion resistance of CP-Ti laser beam welded joints. Metals. 2022 Sep 21;12(10):1570.