Abstract
Genome-wide association studies (GWAS) have identified multiple genetic loci associated with anorexia nervosa (AN); however, the genetic architecture of AN remains largely unknown and many causal genes have not yet been discovered. To prioritize genes associated with AN, we applied metaXcan to integrate summary statistics available from the largest PGC-AN GWAS (3,495 cases and 10,982 controls) with eQTLs (expression quantitative trait loci) of 13 GTEx brain tissues, and identified a total of 133 associations (tagged by 57 unique genes), including multiple potentially promising candidate genes such as SUOX. These identified genes were further validated using an external AN dataset from UK Biobank (770 cases and 135,177 controls) and nine of them were replicated. Moreover, it was found that 72.7% of the identified genes demonstrated pleiotropic effects on at least one of nine other psychiatric disorders. The function analysis revealed these genes were involved in multiple AN-relevant pathways such as synapse organization. Overall, our study identified three candidate genes associated with AN, and would advance our understanding towards the genetic foundation of AN.
Keywords
Anorexia nervosa, Expression quantitative trait loci, Gene expression, Genome-wide association study, Integrative analysis, Summary statistics
Introduction
Anorexia nervosa (AN) is a neuropsychic syndrome characterized by restriction of energy intake relative to requirements, abnormally low body weight and fear of weight gain, resulting in extreme emaciation and even death [1]. AN has an approximately 1% lifetime prevalence [2,3] and has the highest mortality rate among all psychiatric disorders [4].
One of the greatest challenges with regard to AN is that few effective therapeutic interventions have been confirmed in the clinic [5]. Prior evidence has indicated there exists a high genetic component in the susceptibility to AN. For instance, it is shown the AN risk is ten times greater among the first degree relatives compared to the general population [6]. As another example, twin studies estimated that the heritability of AN was 58-74% in the United States [2], 56% in Sweden [2], and 75% in Denmark [7]; and linkage studies also identified multiple genetic loci (e.g., OPRD1 and HTR1D) which were associated with AN [8-10]. Furthermore, genome-wide association studies (GWASs) have detected a lot of single nucleotide polymorphisms (SNPs) related to the risk of AN [11,12], including rs6894268 (RUFY1), rs7624327 (CCNL1) and rs10519201 (SHC4) (Supplementary Table 1).
However, the genetic architecture of AN remains largely unknown and the functional influences of these genetic variants are also not completely clear. For instance, using the linkage disequilibrium (LD) score regression (LDSC) method [13], the SNP-based heritability of AN is estimated only to be 0.12 (se=0.01), which is much smaller than that reported in previous studies [2,7], implying a large amount of causal genetic loci have not yet been discovered and the effort to discover causative genes for AN should continue. Importantly, although GWAS often mapped SNPs to the nearest genetic region, the causal genes that really mediate the influence of SNPs on AN can be rarely ascertainable from GWAS alone [14]. In contrast, due to the utilization of disease-relevant tissues and the availability of both gene expression levels and genotypes, transcriptome studies can identify more interpretable biologically relevant associations and bridge the gap between putatively causal genes and complex diseases [15].
Recently, many integrative analysis methods have been proposed as powerful tools to prioritize causal genes by integrating transcriptome profiles [16-19], such as the Genotype-Tissue Expression (GTEx) [19], with genetic variants and diseases [15,20]. Furthermore, these methods, including metaXcan [21] and FUSION [20], can be implemented with only summary statistics of GWAS and expression quantitative trait loci (eQTLs); therefore, they can be applied to a wide range of fields in genetic studies. In the present work we performed a multiple-tissue integrative analysis with metaXcan to identify AN-associated genes by integrating eQTLs from the GTEx brain tissues with summary statistics of AN GWAS including 3,495 cases and 10,982 controls [22]; we discovered multiple genes that were likely associated with AN. We validated our results in another AN dataset available from UK Biobank (770 cases and 135,177 controls) [23]. We further revealed that these genes had wide pleiotropic associations with nine other psychiatric disorders and that they were involved in multiple AN-related pathways such as synapse organization. In conclusion, these findings would advance our understanding towards the genetic foundation of AN.
Materials and Methods
PGC and UKB GWAS dataset for anorexia nervosa
We obtained the largest summary statistics of AN GWAS published to date from Duncan et al., 2017 [22]. This study was part of the Eating Disorders Working Group of the Psychiatric Genomics Consortium (PGC) with 12 case-control cohorts and comprised of 14,477 individuals of European ancestry (3,495 cases and 10,982 controls, the effective sample size Neff=4/(1/ ncase+1/ncontrol)=10,605 [24]. There were 10,641,224 SNPs left after quality control (i.e., imputation quality scores >0.6 and minor allele frequency (MAF) >0.01) (Supplementary Figure 1A). In each sub-study the first ten principal components were included in the association analysis as covariates besides study-specific covariate factors. Finally, METAL was employed to conduct the inverse-variance weighted fixed-effects metaanalysis across individual sub-studies [24]. In brief, let αi and si be the effect size and standard error for study i, respectively; then, the pooled effect size 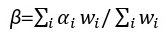 , with
  and its standard error
 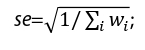 finally, the P value can be available by assuming the combined effect size followed a standard normal distribution. We observed the original test statistics of AN appeared to be inflated, the ratio of the observed median χ2 statistic to the expected median χ2 statistic was 1.219, the standardized genomic inflation factor was close to one (λ1000=1.041, SE=0.009), which was consistent with the polygenic nature of genetic background underlying AN [25-27].
We primarily used the PGC-AN dataset described above in the discovery stage and further validated our results using summary statistics of another AN obtained from the UK Biobank (UKB) [23]. The UKB-AN dataset included 135,947 individuals of European ancestry (770 cases and 135,177 controls;Neff=3,063) and 20,882,955 SNPs after quality control (i.e., imputation quality scores >0.8, allele count at least 20 and minor allele count less than 20) (Supplementary Figure 1B). The association in the UKB-AN dataset was analyzed through the SAIGE method [28], which implemented the logistic mixed model with a kinship matrix as random effects and age, sex, age×sex, age2, age2×sex as well as the first ten principal components as fixed-effects covariates.
Integrating GWAS summary statistics and eQTL with metaXcan
In our integrative analysis we carried out metaXcan to identify potentially causal genes that were associated with AN by integrating GWAS summary statistics and eQTL weights [21]. Briefly, assume there are m cis-SNPs located within a given gene of focus, with m varying gene by gene. Then, for each gene in turn we construct
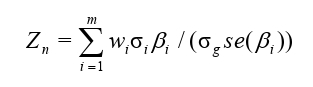
where wi stands for the eQTL wight, βi and se(βi) the marginal effect size and the standard error of a single cis- SNP, respσectively; σg and σg are the standard deviations of the cis-SNP or the genetically regulated expression (GReX), respectively, both of which can be effectively estimated from ancestry-matched reference panels such as the 1000 Genomes project. The test statistic Zk asymptotically follows a standard normal distribution; thus, its P value can be easily available for evaluating the significance.
In addition, because AN is a disorder pathologically relevant to the brain and integrating eQTLs from tissues that are mechanistically unrelated to the disease of interest might lead to spurious associations [29], we therefore only selected eQTL weights that were previously trained with genotypes and gene expressions in 13 brain tissues from the GTEx Project when performing metaXcan (Table 1) [19]. These pre-calculated eQTL weights for all cis-heritable genes were publicly available at http://predictdb.org/.
| Tissues | N | M (PGC/UKB) |
|---|---|---|
| amygdala | 88 | 2,310/2,347 |
| anterior cingulate cortex (BA24) | 109 | 3,234/3,285 |
| caudate (basal ganglia) | 144 | 4,099/4,148 |
| cerebellar hemisphere | 125 | 4,657/4,728 |
| cerebellum | 154 | 5,966/6,059 |
| cortex | 136 | 4,247/4,304 |
| frontal cortex (BA9) | 118 | 3,520/3,572 |
| hippocampus | 111 | 2,758/2,799 |
| hypothalamus | 108 | 2,772/2,804 |
| nucleus accumbens (basal ganglia) | 130 | 3,547/3,615 |
| putamen (basal ganglia) | 111 | 3,099/3,158 |
| spinal cord (cervical c-1) | 83 | 2,455/2,501 |
| substantia nigra | 80 | 1,987/2,027 |
| Note: N: the total number of samples; M: the number of genes that converged when estimating the cis-SNP based heritability of gene expression level: PGC: Psychiatric Genomics Consortium; UKB: UK Biobank. | ||
Table 1: Summary information of tissues in GTEx data sets for two AN GWAS data sets.
Colocalization analysis for discovered genes
We further implemented the colocalization analysis with the COLOC package (version 3.2-1) to determine whether these associations were driven by colocalized genetic variants causally associated with both expression levels and AN or by eQTLs in LD with distinct causal genetic variants independently affecting expression levels and AN [30]. The eQTL association results were publicly obtained from GTEx (version 7) [19]. For each identified gene, we selected its cis-SNPs and abstracted their P values from the eQTL studies and the AN GWAS, and used the approximated Bayes factor method to calculate four posterior probabilities for five hypotheses: P0 corresponds to the absence of eQTL and GWAS association; P1 and P2 correspond to the presence of eQTL association but the absence of GWAS association or vice-versa; P3 corresponds to the presence of eQTL and GWAS associations with independent association signals; and P4 corresponds to the presence of eQTL and GWAS associations with shared association signal. P3 quantifies the linkage association which indicates the possible contamination due to LD confounding, while P4 measures the colocalization association which is also known as pleiotropy and is often more biological interest in practice [31].
Pleiotropic effects of associated genes with nine other psychiatric disorders
We detected a total of 57 unique genes significantly associated with AN. To explore the pleiotropy of these genes to understand the common genetic background of psychiatric disorders, we examined their associations with nine other psychiatric disorders including schizophrenia (SCZ; N=77,096) [32], Bipolar disorder (BIP; N=51,710) [33], obsessive compulsive disorder (OCD; N=9,725) [34], posttraumatic stress disorder (PTSD; N=174,659) [35], Tourette’s syndrome (TS; N=14,307) [36], anxiety disorders (AD; N=17,526) [37], autism spectrum disorder (ASD; N=46,350) [38], major depression disorder (MDD; N=480,359) [39] and attentiondeficit/ hyperactivity disorder (ADHD; N=53,293) [40]. We first obtained summary statistics of these disorders from PGC. For each disorder in turn, we implemented metaXcan with eQTLs available from the 13 GTEx brain tissues and yielded a set of P values for each gene across these tissues.
To combine tissue-specific association evidence, we applied the aggregated Cauchy association test (ACAT) [41,42] and generated a final P value for the gene for each of the nine other psychiatric disorders. Specifically, assume there are multiple P values for each gene obtained by integrating eQTLs of K tissues after the use of metaXcan; we leveraged ACAT and had
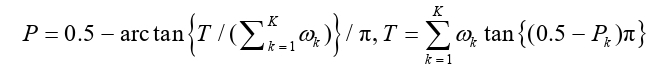
where ωk denotes non-negative weights for Pk with 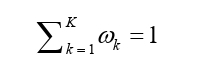 . In our analysis equal weights were used. Note that, as these P values of a given gene were generated with the similar strategy of integrative analysis; therefore, they were often highly correlated. Compared with the traditional Fisher’s combination method which is only suitable for independent test statistics from various experiments, ACAT has an appealing strength that it is robust against positive correlation among test statistics can thus generate a wellcalibrated P value [41,42].
Enrichment analysis and protein-protein interaction network
In order to understand biological processes and molecular functions of the genes of focus and differential expression, we conducted a functional enrichment analysis (e.g., gene ontology (GO) and KEGG pathway) to explore functional features for these identified genes using the clusterProfiler package and DAVID (version 6.8; at https://david.ncifcrf.gov/). We also carried out protein-protein interaction (PPI) analysis for these genes to detect interaction and association in terms of the Search Tool for the Retrieval of Interacting Genes/ Proteins database (STRING 11.0 at https://string-db.org/) [43]. In the PPI analysis, each node represents one gene; the undirected link between two nodes was an edge, denoting the interaction between two genes. We determined signaling pathways of significant genes through the Cytoscape software and visualized them using CluePedia [44].
Results
Associated genes identified by integrating eQTLs
Using metaXcan by integrating eQTLs from 13 GTEx brain tissues, we identified a total of 133 (57 unique) associated genes with FDR (false discover rate) adjusted P value <0.05 after correcting multiple comparisons across all genes and tissues (Supplementary Table 2). It should be first highlighted that, with the current sample sizes of the GTEx study (Table 1), the expressions of some associated genes were shown to be cis-heritable across all the 13 brain tissues (e.g., HAUS4, MGMT, NCKIPSD, RBM6, RPS26 and ZSCAN31), whereas other were only cis-heritable in a few tissues or even a single tissue, including MAP1LC3B2 in the brain caudate basal ganglia, SHISA5 in the brain cerebellum, SPINK8 in the brain hippocampus, SLC26A6 in the brain hippocampus, UBA7 in the brain spinal cord cervical c-1 and ZNF394 in the brain cerebellum.
Among these genes, 16 associations were detected in the brain caudate basal ganglia, followed by the brain frontal cortex BA9 and the brain hippocampus (both are 14 associations) (Supplementary Table 2). RPS26 had the highest discovery frequency and was consistently identified to be significant in the all 13 brain tissues (FDR-adjusted P value ranging from 5.69×10⁻³ in the brain nucleus accumbens basal ganglia to 4.61×10⁻² in the brain spinal cord cervical c-1), followed by MGMT in ten brain tissues (FDR-adjusted P value ranging from 3.21×10⁻⁴ in the brain caudate basal ganglia to 2.61×10⁻² in the brain substantia nigra). Most of these identified genes were located within chr3 (53.4%=71/133), followed by chr12 (18.0%=24/133). Functionally, most of these genes were protein coding genes (86.5%=115/133).
We discovered that the Pearson’s correlation among the Z-scores across the 13 brain tissues was not high (with an average of 0.64 and ranging from 0.44 to 0.74), implying a substantial functional heterogeneity in genetic foundation of AN in distinct brain regions (Figure 1A). More than half of these genes (e.g., ARIH2OS, BSN-AS2, CCDC71, MST1, SEMA3F, SLC26A6, and WDR6) were associated with an increasing risk of AN (because of positive Z-scores) (Figure 1B). The direction of effect sizes of the 57 unique genes was largely consistent across tissues, except AMT, FAM212A, FBXO27, RP11-804H8.6, and TAP2; whereas for these significant genes (FDR-adjusted P<0.05), the direction of effect sizes was nearly the same in different brain tissues, suggesting the consistent influence of these genes across various brain regions. Among these, we confirmed three genes (i.e., RPS26, NCKIPSD, and MGMT) that were discovered in previous studies (Supplementary Table 1). In addition, six genes on chr3 (i.e., ARIH2OS, BSN-AS2, CCDC71, SHISA5, SLC26A6 and WDR6) were close to rs9821797 (mapped to NCKIPSD) (Supplementary Figure 3), which was a genome-wide significant genetic variant identified previously [26].

Figure 1: (A) Pearson’s correlation of Z-scores across the 13 brain tissues in the PGC-AN dataset. The color and the number in each cell indicate the magnitude of correlation coefficients; (B) Heatmap of the Z-scores for the 57 significant genes. The color indicates the magnitude of the Z-value and the star indicates whether it is significant.
Result of the colocalization analysis
In our colocalization analysis result (Supplementary Table 2), we found that there was only one LD-contaminated association having P3 larger than 50% (i.e., MGMT discovered in Brain Cerebellum with P3=60.8%). This finding indicated that the rest associations were less likely driven by distinct genetic loci in high LD and the resulting genes might be functional genes underlying the AN relevant association. To be more conservative, following the suggestion given in [21], we could only keep the most promising genes with explicit evidence of colocalization (P4>50%) for follow-up functional investigation. Particularly, we observed that SUOX had P4>95% across discovered tissues. In addition, two previous genes mentioned above also had large a P4 value (96.3% for RPS26 and 64.4% for MGMT). The P4 value for other remaining associations ranged from 1.2% to 44.6% with an average of 4.9%.
Validating associations using GWAS summary statistics of UK Biobank
We validated these identified genes in the PGC-AN dataset using the UKB-AN summary statistics (Supplementary Table 3). Note first that, we did not observe a substantial inflation in the summary statistics of the UKB-AN dataset (λ1000=1.01) (Supplementary Figure 2B). In the UKB-AN dataset we found the Pearson’s correlation of the Z-scores across these brain tissues was slightly lower than that in the PGC-AN dataset (ranging from 0.37 between spinal cord cervical c-1 and amygdala to 0.69 between cerebellar hemisphere and cerebellum, with an average of 0.58), again implying the distinction in genetic foundation of AN among diverse brain regions (Figure 2A). Moreover, we calculated Pearson’s correlation of Z-scores between PGC-AN and UKB-AN in each of the 13 brain tissues. The Pearson’s correlations were low to moderate (the average correlation was only 0.21 across the 13 brain tissues, ranging from 0.19 in nucleus accumbens basal ganglia to 0.23 in amygdala), suggesting the weak ability to replicate the association signals discovered in the PGC-AN dataset with the UKB-AN dataset (Figure 2B). Nevertheless, we observed that the direction of effect sizes of significant genes (e.g., HAUS4, RPS26, VAMP2, and ZNF394) was generally consistent in the same brain tissue between the two datasets (Figure 2C). Totally, based on the UKB-AN dataset, we replicated 16 associations (9 unique) (P<0.05), including one novel gene VAMP2 (Figure 2C). Note that, a significance level of 0.05 was employed in the validation stage where a more relaxed criterion was often recommended.
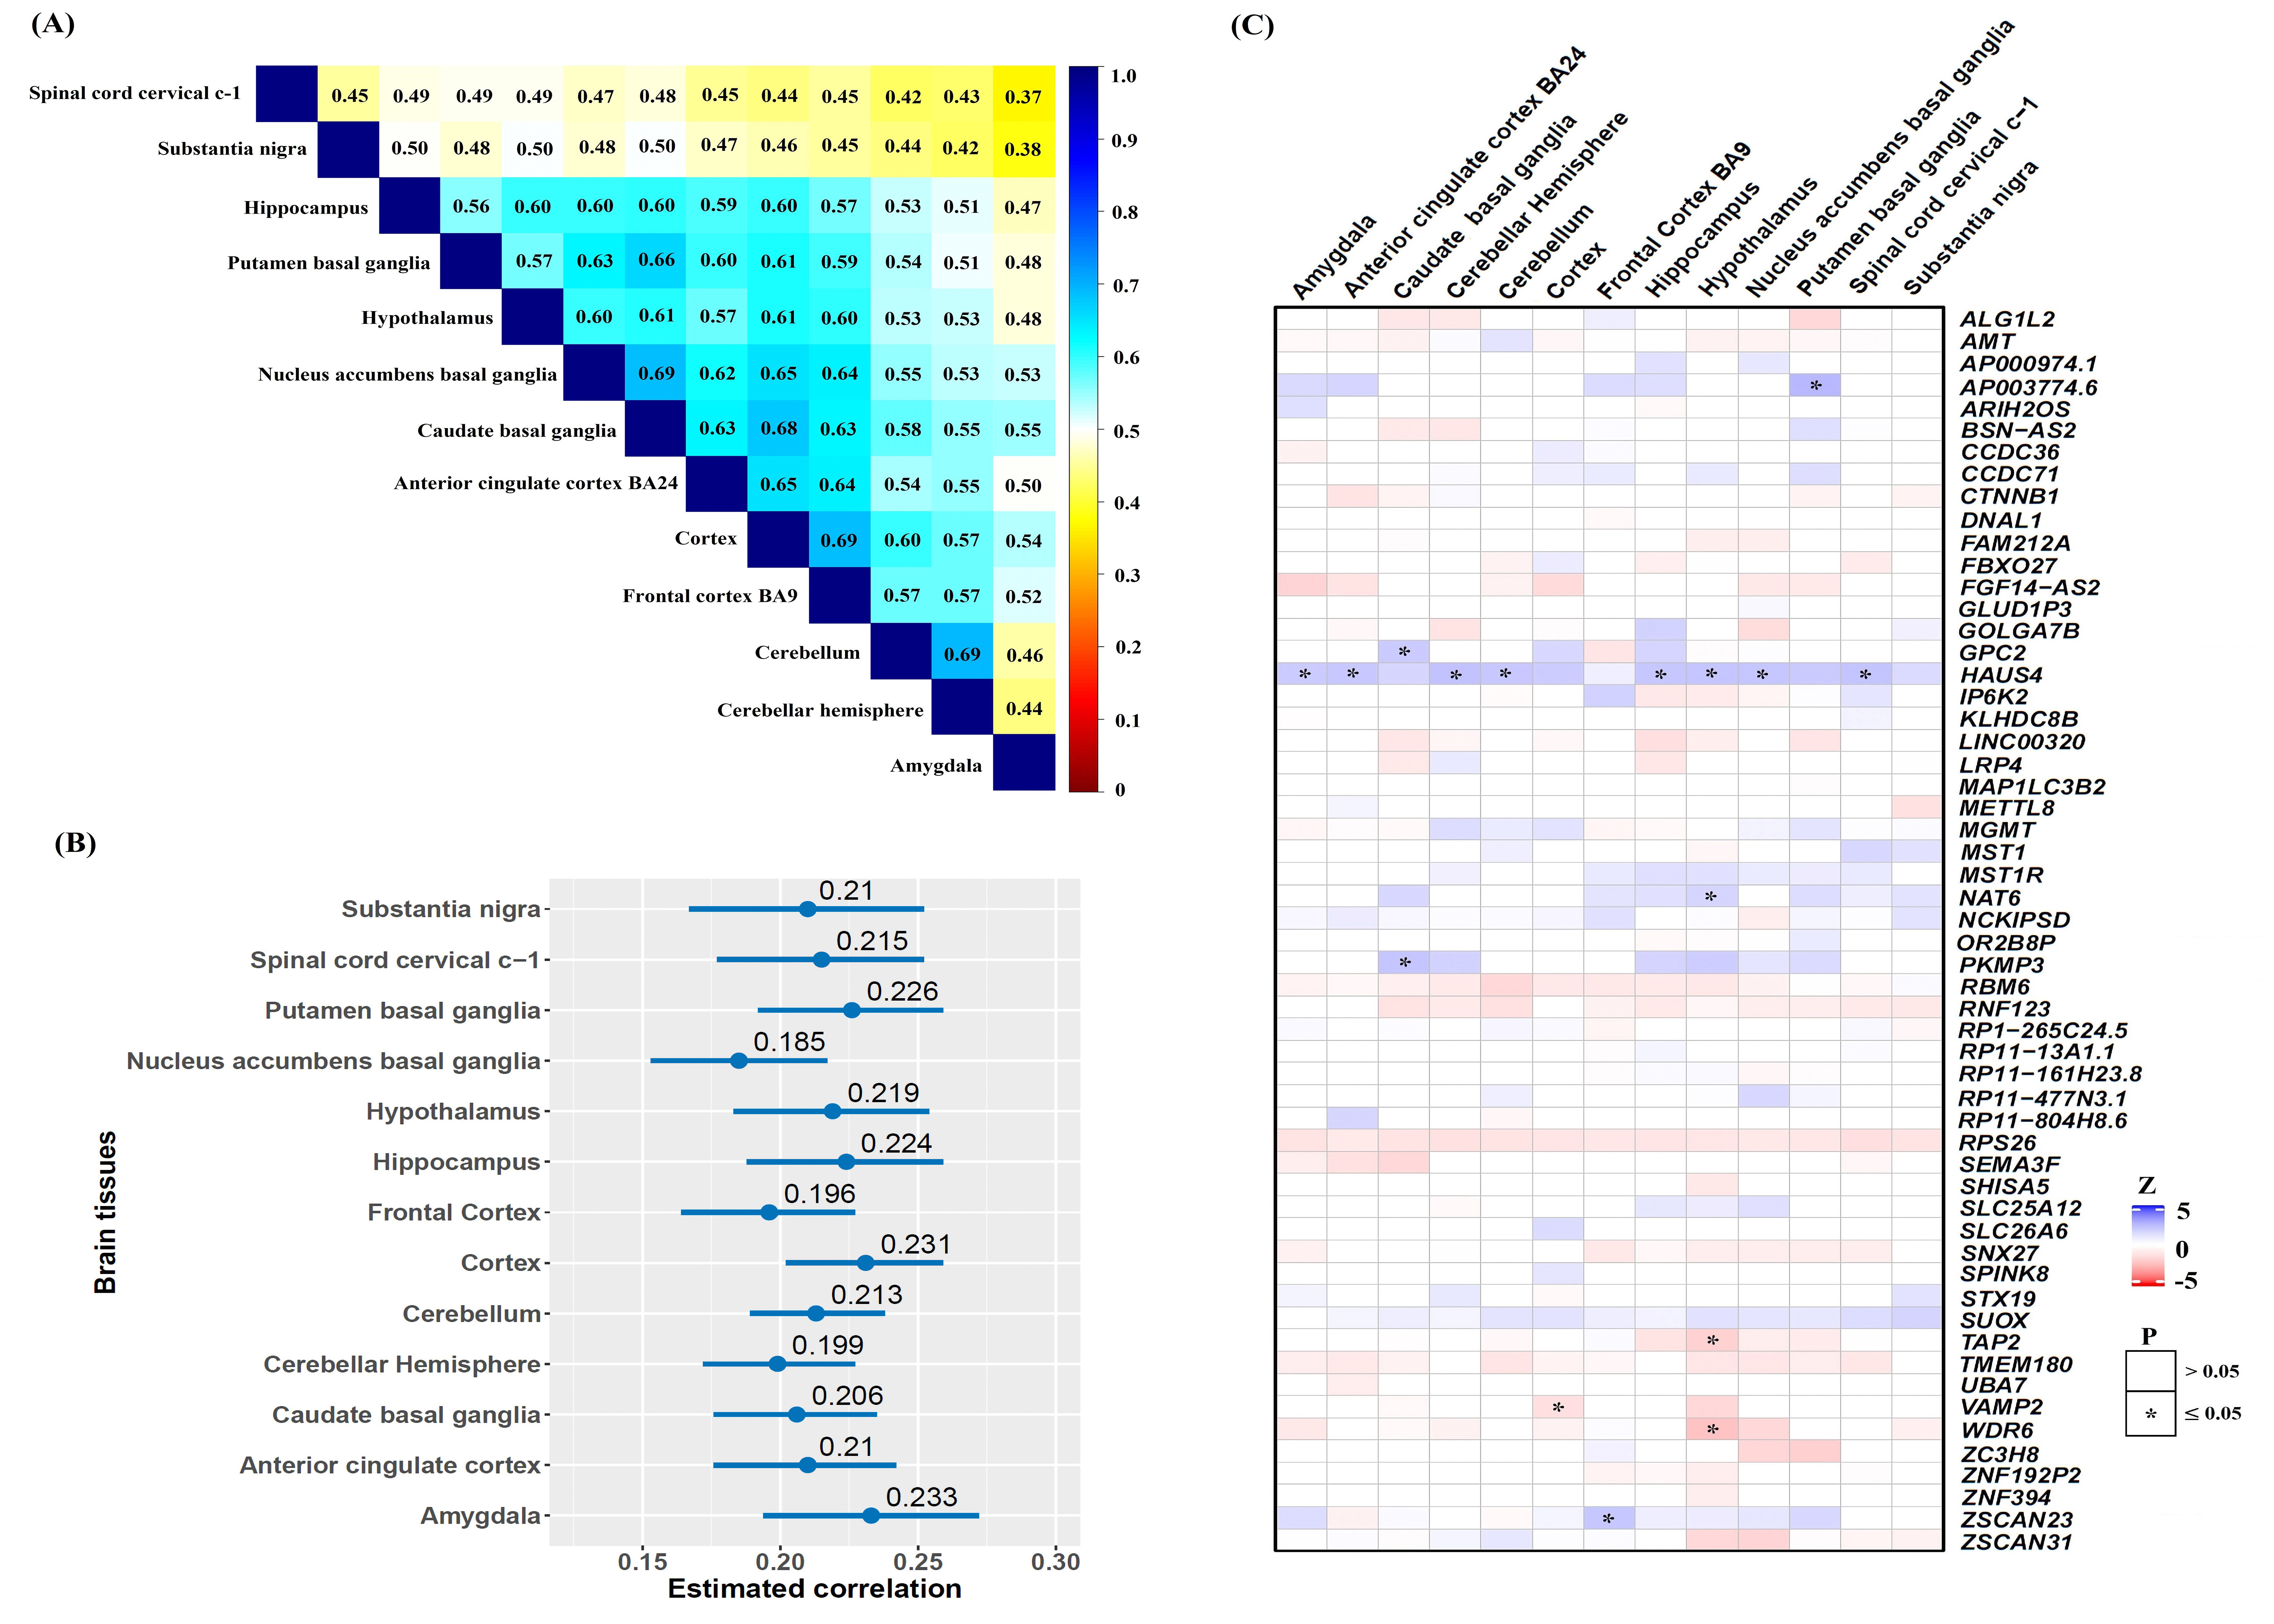
Figure 2: (A) Pearson’s correlation of Z-scores across the 13 brain tissues for the UKB-AN dataset. The color and the number in each cell indicate the magnitude of correlation coefficients; (B) Pearson’s correlation of Z-scores of the 13 brain tissues between PGC-AN and UKB-AN datasets. (C) Heatmap of the Z-score of the UKB-AN dataset for the 57 genes identified in the PGC-AN dataset. The color of each cell indicates the magnitude of the Z value and the star indicates whether it is significant.
Pleiotropic effects of these identified genes on nine other psychiatric disorders
In order to examine the pleiotropic effects of these identified genes identified from the PGC-AN dataset, we performed another integrative analysis for nine other psychiatric disorders and aggregated association evidence from multiple brain tissues into an overall association signal with ACAT [41,42]. Of note, except for two genes (i.e., CTBP2 and SHISA5), all other genes were present in at least one of the nine psychiatric disorders. We discovered that 72.7% (=40/55) of associated genes were also related to at least one of the nine psychiatric disorders (P<0.05) (Supplementary Table 4 and Figure 3A). For example, BSN-AS2 and CCDC71 were associated with six psychiatric disorders (i.e., BSN-AS2 was also associated with ADHD (P=6.84×10⁻⁶), ASD (P=1.01×10⁻²), BIP (P=4.09×10⁻³), MDD (P=2.22×10⁻³), SCZ (P=6.72×10⁻³) and TS (P=2.18×10⁻²)), and MST1 and RBM6 were related to five psychiatric disorders.
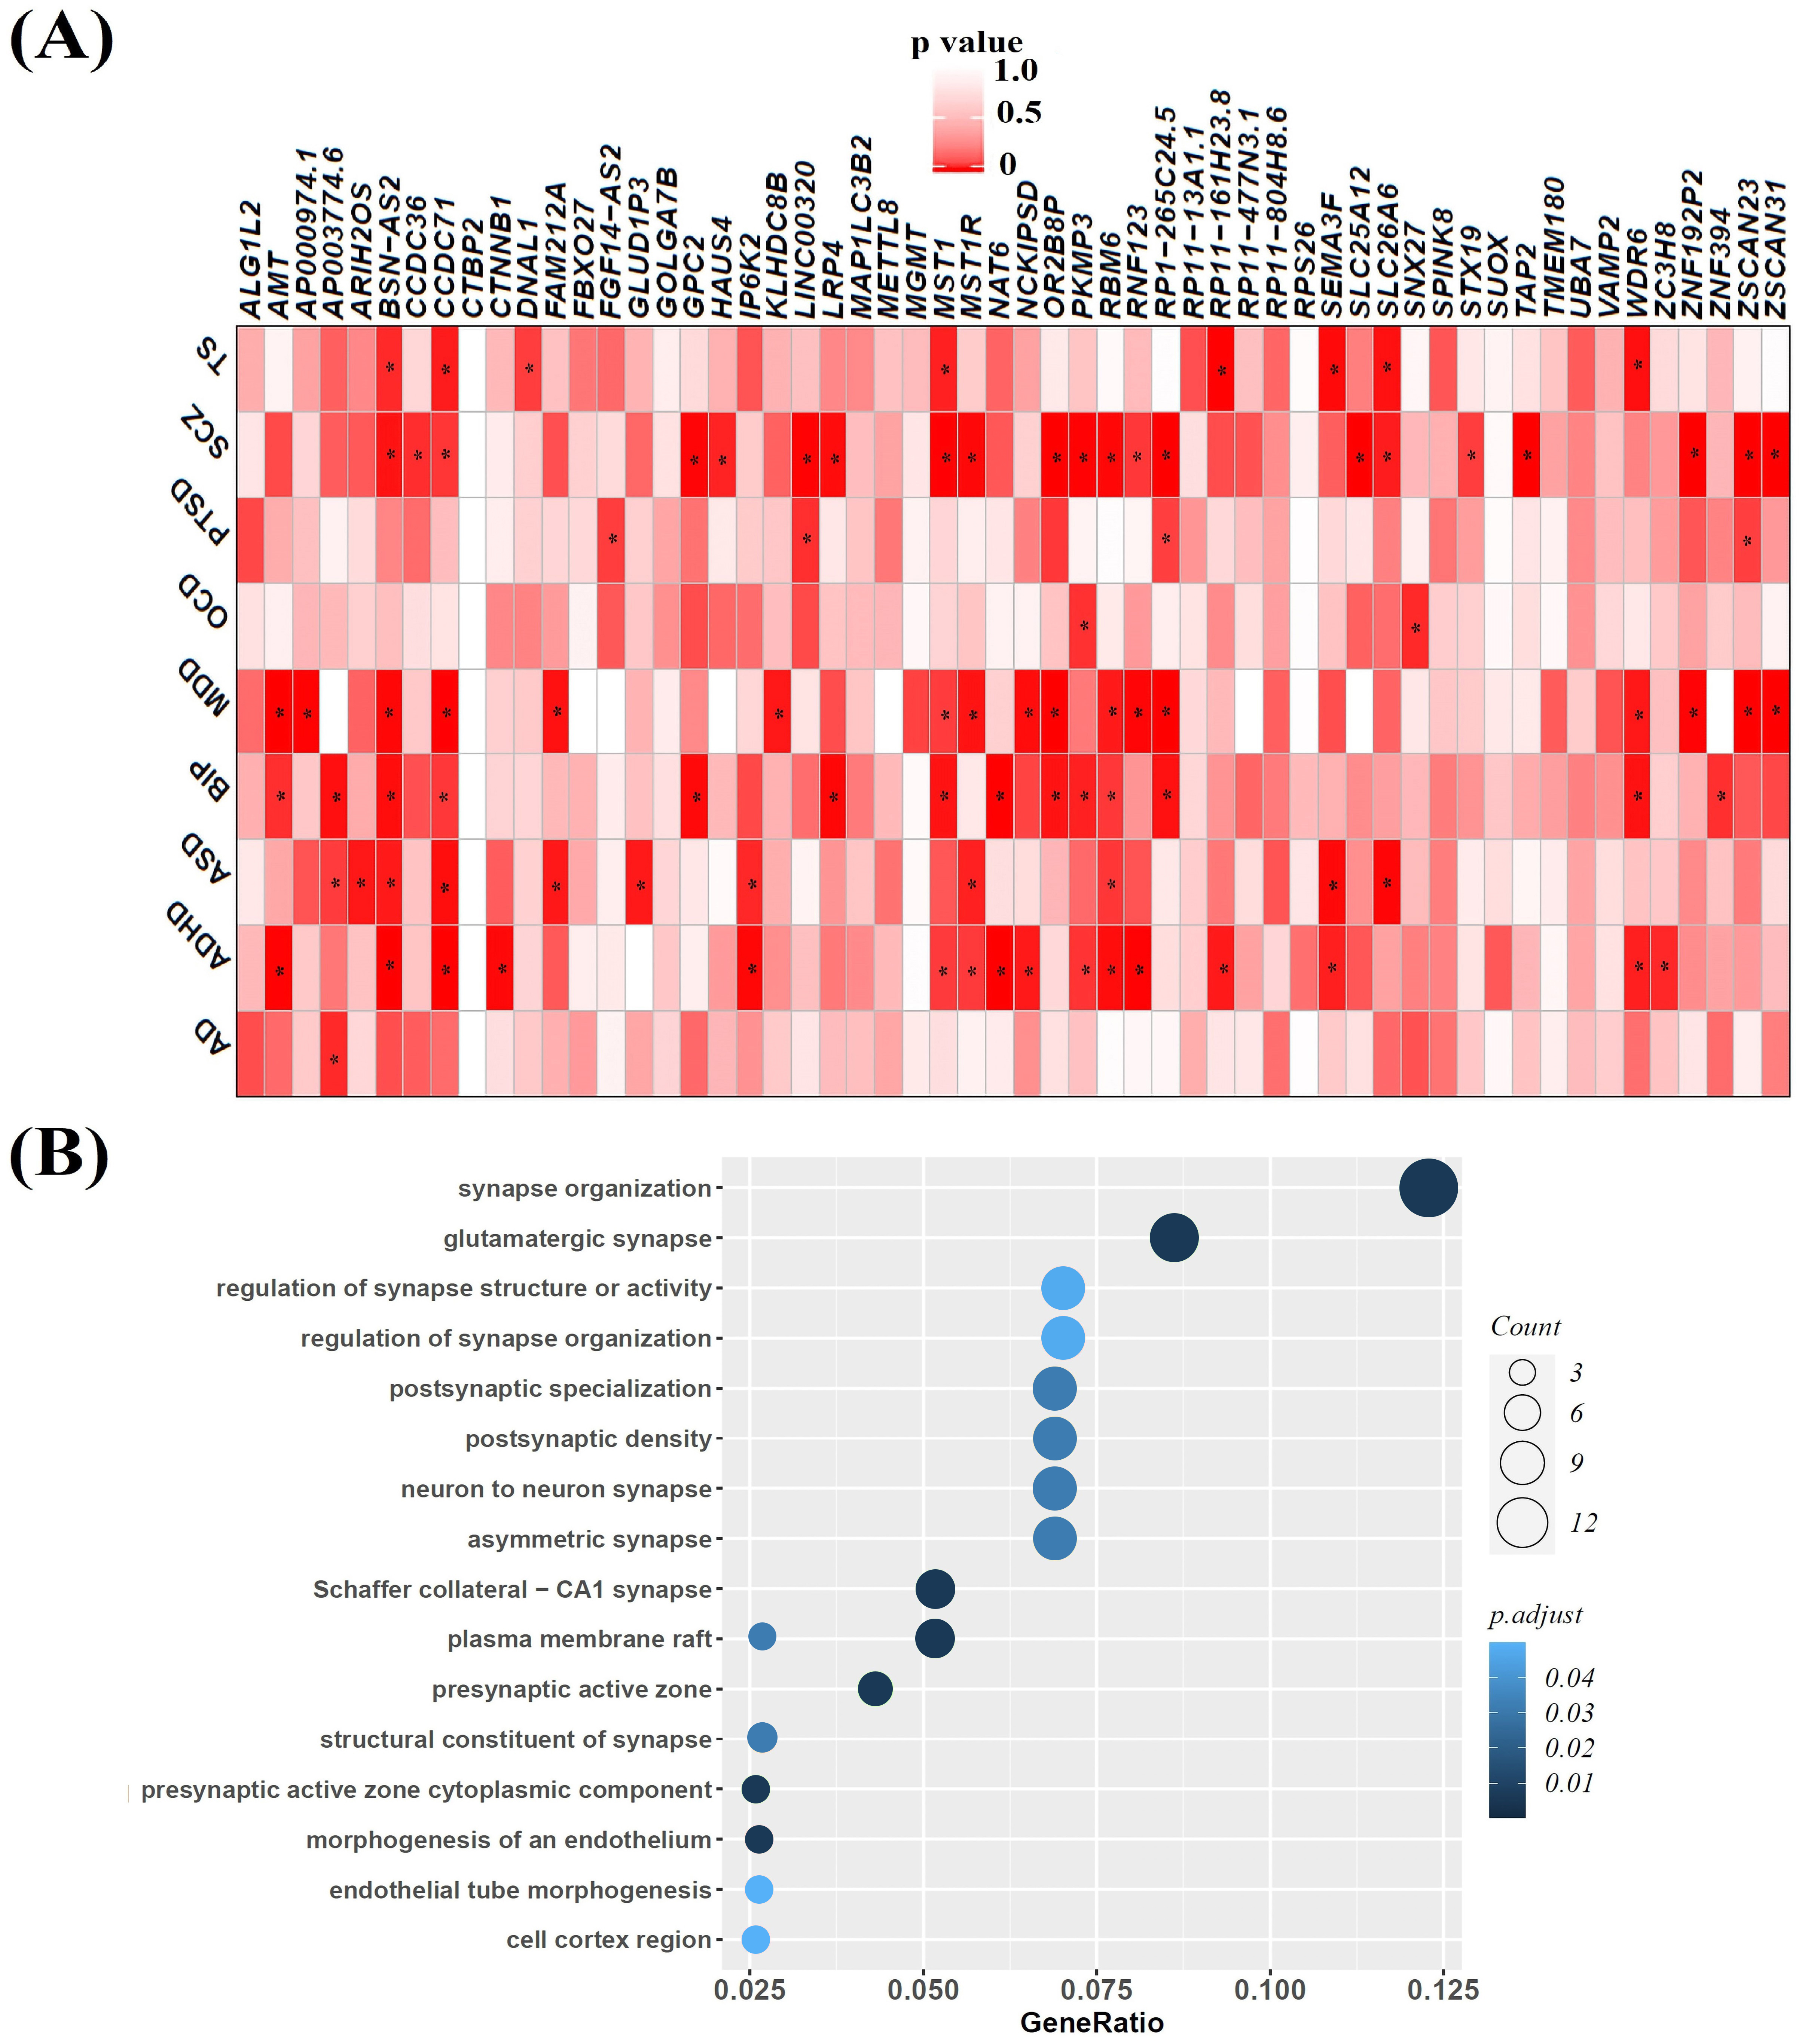
Figure 3: (A) Heatmap of P values of pleiotropic genes between AN and nine other psychiatric disorders. The star indicates P<0.05; (B) Gene ontology (GO) analysis for these identified genes, Count: Number of genes related to the enriched GO pathway. The color of the dot denotes P values. AD: Anxiety Disorders; ADHD: Attention-Deficit/Hyperactivity Disorder; AN: Anorexia Nervosa; ASD: Autism Spectrum Disorder; BIP: Bipolar Disorder; MDD: Major Depression Disorder; OCD: Obsessive Compulsive Disorder; PTSD: Posttraumatic Stress Disorder; SCZ: Schizophrenia; TS: Tourette’s Syndrome.
Gene enrichment analysis and protein-protein interaction network
According to the result of DAVID, these identified genes were enriched in 16 GO terms (Supplementary Table 5 and Figure 3C). Some genes were enriched in “synapse organization”, “regulation of synapse organization”, “regulation of synapse structure or activity” and “morphogenesis of an endothelium”. Almost all the GO enrichments were associated to the synapse function which was closely related to the pathology of AN [43-45]. In addition, strong interactions were observed in the PPI analysis, including VAMP2, STX19, and MST1, MST1R, SEMA3F, RNF123, UBA7, and FBXO27 (Supplementary Figure 4), indicating the existence of complex functional network among these genes.
Discussion and Conclusion
In the present work we implemented a multiple-tissue integrative analysis for anorexia nervosa to prioritize causal genes. In total, 57 unique genes were identified to be associated with AN. Particularly, in terms of the colocalization analysis, SUOX could serve as a promising candidate gene for further functional study. SUOX included a significant GWAS hit rs2271194 with P=1.64×10⁻⁸ [22]. Functionally, SUOX encodes sulfite oxidase and it was recently found that the isolated sulfite oxidase deficiency was associated with prenatal neurodevelopment of brain disruption [48]. Several genetic variants located within SUOX were also identified to be associated with schizophrenia [49]. These observations provide evidence supporting the validity of our integrative results.
The subsequent functional analyses for these identified genes showed that they had wide pleiotropic effects, implying that there existed similar genetic components underlying these psychiatric disorders, in line with previous findings [50]. We also found that these discovered genes were involved in important biologically functional pathways that were relevant to AN, suggesting that they could be treated as potential biomarkers for early diagnosis or drug therapeutic targets. We further validated our finding in an independent UKB-AN dataset and replicated nine genes. The low repeatability may be due to the much smaller effective sample size of the UKBAN dataset, which can undermine the power of our integrative analysis.
Several limitations of our work should be mentioned. First, the GTEx project cannot accurately account for cellular heterogeneity and have small sample size [16-19], which may reduce the power of the integrative analysis. Second, it has been shown leveraging gene expression reference panels from tissues that are less mechanistically related to diseases of interest can lead to bias or spurious associations [29]; however, the true mechanism and tissues that are relevant to AN are not completely known although we carefully selected brain tissues in our integrative analysis. Third, more studies are needed to evaluate the biological functions of these genes on the risk of AN in the future.
In conclusion, our study identified multiple candidate genes associated with AN by integrating eQTLs and summary statistics, and would advance our understanding towards the genetic foundation of AN.
Acknowledgements
We thank Psychiatric Genomics Consortium (PGC) and UK Biobank for making the summary statistics of anorexia nervosa GWAS publicly available and are grateful of all the investigators and participants contributed to the studies. We also thank the GitHub repository (https://github.com/hakyimlab) which contains the implementations of metaXcan described in this manuscript and provides a step-by-step guideline on running the metaXcan analysis. The data analyses in the present study were carried out with the high-performance computing cluster that was supported by the special central finance project of local universities for Xuzhou Medical University
Funding
The research of Ping Zeng was supported in part by the National Natural Science Foundation of China (82173630 and 81402765), the Youth Foundation of Humanity and Social Science funded by Ministry of Education of China (18YJC910002), the Natural Science Foundation of Jiangsu Province of China (BK20181472), the China Postdoctoral Science Foundation (2018M630607 and 2019T120465), the QingLan Research Project of Jiangsu Province for Academic Leaders, the Six-Talent Peaks Project in Jiangsu Province of China (WSN-087), the Training Project for Youth Teams of Science and Technology Innovation at Xuzhou Medical University (TD202008), the Postdoctoral Science Foundation of Xuzhou Medical University, and the Statistical Science Research Project from National Bureau of Statistics of China (2014LY112). The research of Ting Wang was supported in part by the Social Development Project of Xuzhou City (KC20062). The research of Lihong Huang was supported in part by the National Natural Science Foundation of China (81903407).
Conflict of Interests
The authors declare that the research was conducted in the absence of any commercial or financial relationships that could be construed as a potential conflict of interest.
Supplementary Materials
Supplementary Results.
Author Contributions
PZ and LH conceived the idea for the study. PZ and LH obtained the genetic data. TW, JQ and HC performed the data analyses. PZ, TW and HC interpreted the results of the data analyses. PZ, TW and HC wrote the manuscript with suggestions from other authors.
References
2. Aoki C, Chowdhury TG, Wable GS, Chen YW. Synaptic changes in the hippocampus of adolescent female rodents associated with resilience to anxiety and suppression of food restriction-evoked hyperactivity in an animal model for anorexia nervosa. Brain Research. 2017 Jan 1;1654:102-15.
3. Artmann H, Grau H, Adelmann M, Schleiffer R. Reversible and non-reversible enlargement of cerebrospinal fluid spaces in anorexia nervosa. Neuroradiology. 1985 Jul;27(4):304-12.
4. Attia E. Anorexia nervosa: current status and future directions. Annual Review of Medicine. 2010 Feb 18;61:425-35.
5. Barbeira AN, Dickinson SP, Bonazzola R, Zheng J, Wheeler HE, Torres JM, et al. Exploring the phenotypic consequences of tissue specific gene expression variation inferred from GWAS summary statistics. Nature Communications. 2018 May 8;9(1):1825.
6. Battle A, Mostafavi S, Zhu X, Potash JB, Weissman MM, McCormick C, et al. Characterizing the genetic basis of transcriptome diversity through RNA-sequencing of 922 individuals. Genome Research. 2014 Jan 1;24(1):14-24.
7. Bergen AW, Van Den Bree MB, Yeager M, Welch R, Ganjei JK, Haque K, et al. Candidate genes for anorexia nervosa in the 1p33–36 linkage region: serotonin 1D and delta opioid receptor loci exhibit significant association to anorexia nervosa. Molecular Psychiatry. 2003 Apr;8(4):397-406.
8. Bindea G, Mlecnik B, Hackl H, Charoentong P, Tosolini M, Kirilovsky A, et al. ClueGO: a Cytoscape plug-in to decipher functionally grouped gene ontology and pathway annotation networks. Bioinformatics. 2009 Apr 15;25(8):1091-3.
9. Boraska V, Davis OS, Cherkas LF, Helder SG, Harris J, Krug I, et al. Genome?wide association analysis of eating disorder?related symptoms, behaviors, and personality traits. American Journal of Medical Genetics Part B: Neuropsychiatric Genetics. 2012 Oct;159(7):803-11.
10. Bulik-Sullivan B, Finucane HK, Anttila V, Gusev A, Day FR, Loh PR, et al. An atlas of genetic correlations across human diseases and traits. Nature Genetics. 2015 Nov;47(11):1236-41.
11. Bulik CM, Berkman ND, Brownley KA, Sedway JA, Lohr KN. Anorexia nervosa treatment: a systematic review of randomized controlled trials. International Journal of Eating Disorders. 2007 May;40(4):310-20.
12. Bulik CM, Sullivan PF, Tozzi F, Furberg H, Lichtenstein P, Pedersen NL. Prevalence, heritability, and prospective risk factors for anorexia nervosa. Archives of General Psychiatry. 2006 Mar 1;63(3):305-12.
13. Bycroft C, Freeman C, Petkova D, Band G, Elliott LT, Sharp K, et al. The UK Biobank resource with deep phenotyping and genomic data. Nature. 2018 Oct;562(7726):203-9.
14. Demontis D, Walters RK, Martin J, Mattheisen M, Als TD, Agerbo E, et al. Discovery of the first genome-wide significant risk loci for attention deficit/hyperactivity disorder. Nature Genetics. 2019 Jan;51(1):63-75.
15. Devlin B, Bacanu SA, Klump KL, Bulik CM, Fichter MM, Halmi KA, et al. Linkage analysis of anorexia nervosa incorporating behavioral covariates. Human Molecular Genetics. 2002 Mar 15;11(6):689-96.
16. Duncan L, Yilmaz Z, Gaspar H, Walters R, Goldstein J, Anttila V, et al, Eating Disorders Working Group of the Psychiatric Genomics Consortium, Thornton L, Hinney A. Significant locus and metabolic genetic correlations revealed in genome-wide association study of anorexia nervosa. American Journal of Psychiatry. 2017 Sep 1;174(9):850-8.
17. Frintrop L, Trinh S, Liesbrock J, Leunissen C, Kempermann J, Etdöger S, et al. The reduction of astrocytes and brain volume loss in anorexia nervosa—the impact of starvation and refeeding in a rodent model. Translational Psychiatry. 2019 Jun 4;9(1):159.
18. Gallagher MD, Chen-Plotkin AS. The post-GWAS era: from association to function. The American Journal of Human Genetics. 2018 May 3;102(5):717-30.
19. Gamazon ER, Wheeler HE, Shah KP, Mozaffari SV, Aquino- Michaels K, Carroll RJ, et al. A gene-based association method for mapping traits using reference transcriptome data. Nature Genetics. 2015 Sep;47(9):1091-8.
20. Giambartolomei C, Vukcevic D, Schadt EE, Franke L, Hingorani AD, Wallace C, et al. Bayesian test for colocalisation between pairs of genetic association studies using summary statistics. PLoS Genetics. 2014 May 15;10(5):e1004383.
21. Grice D, Halmi KA, Fichter MM, Strober M, Woodside DB, Kaplan AS, et al. Evidence for a susceptibility gene for restricting anorexia nervosa on chromosome 1. American Journal of Medical Genetics. 2001 Oct 8;105(7):585-586.
22. Grove J, Ripke S, Als TD, Mattheisen M, Walters RK, Won H, et al. Identification of common genetic risk variants for autism spectrum disorder. Nature Genetics. 2019 Mar;51(3):431-44.
23. GTEx Consortium, Laboratory, D.A.C.C.L.A.W.G., Statistical Methods groups—Analysis Working Group, Enhancing GTEx (eGTEx) groups, and Fund., N.C. (2017). Genetic effects on gene expression across human tissues. Nature 550(7675), 204-213.
24. Gusev A, Ko A, Shi H, Bhatia G, Chung W, Penninx BW, et al. Integrative approaches for large-scale transcriptome-wide association studies. Nature Genetics. 2016 Mar;48(3):245-52.
25. Hudson JI, Hiripi E, Pope Jr HG, Kessler RC. The prevalence and correlates of eating disorders in the National Comorbidity Survey Replication. Biological Psychiatry. 2007 Feb 1;61(3):348-58.
26. International Obsessive Compulsive Disorder Foundation Genetics Collaborative and OCD Collaborative Genetics Association Studies. Revealing the complex genetic architecture of obsessivecompulsive disorder using meta-analysis. Molecular Psychiatry. 2018 May 1;23(5):1181-1188.
27. Kortegaard LS, Hoerder K, Joergensen J, Gillberg C, Kyvik KO. A preliminary population-based twin study of self-reported eating disorder. Psychological Medicine. 2001 Feb;31(2):361-5.
28. Kousta S. Genetics of anorexia nervosa. Nature Human Behaviour. 2019 Sep;3(9):896.
29. Lappalainen T, Sammeth M, Friedländer MR, t Hoen PA, Monlong J, Rivas MA, et al. Transcriptome and genome sequencing uncovers functional variation in humans. Nature. 2013 Sep;501(7468):506-11.
30. Lee HF, Chi CS, Tsai CR, Chen HC, Lee I. Prenatal brain disruption in isolated sulfite oxidase deficiency. Orphanet Journal of Rare Diseases. 2017 Dec;12(1):115.
31. Lee PH, Anttila V, Won H, Feng YC, Rosenthal J, Zhu Z, et al. Genomic relationships, novel loci, and pleiotropic mechanisms across eight psychiatric disorders. Cell. 2019 Dec 12;179(7):1469-82.
32. Liu Y, Chen S, Li Z, Morrison AC, Boerwinkle E, Lin X. ACAT: a fast and powerful p value combination method for rare-variant analysis in sequencing studies. The American Journal of Human Genetics. 2019 Mar 7;104(3):410-21.
33. Liu Y, Xie J. Cauchy combination test: a powerful test with analytic p-value calculation under arbitrary dependency structures. Journal of the American Statistical Association. 2020 Jan 2;115(529):393-402.
34. Lonsdale J, Thomas J, Salvatore M, Phillips R, Lo E, Shad S, et al. The Genotype-Tissue Expression (GTEx) project. Nature Genetics. 2013;45(6):580-585.
35. Lu H, Qiao J, Shao Z, Wang T, Huang S, Zeng P. A comprehensive gene-centric pleiotropic association analysis for 14 psychiatric disorders with GWAS summary statistics. BMC Medicine. 2021 Dec;19(1):314.
36. Nievergelt CM, Maihofer AX, Klengel T, Atkinson EG, Chen CY, Choi KW, et al. International meta-analysis of PTSD genome-wide association studies identifies sex-and ancestry-specific genetic risk loci. Nature Communications. 2019 Oct 8;10(1):4558.
37. Otowa T, Hek K, Lee M, Byrne EM, Mirza SS, Nivard MG, et al. Metaanalysis of genome-wide association studies of anxiety disorders. Molecular Psychiatry. 2016 Oct;21(10):1391-9
38. Pardiñas AF, Holmans P, Pocklington AJ, Escott-Price V, Ripke S, Carrera N, et al. Common schizophrenia alleles are enriched in mutation-intolerant genes and in regions under strong background selection. Nature Genetics. 2018 Mar;50(3):381-9.
39. Pantelis C, Papadimitriou GN, Papiol S, Parkhomenko E, Pato MT, Paunio T, et al. Biological insights from 108 schizophrenia-associated genetic loci. Nature. 2014 Jul 22;511(7510):421-7.
40. Stahl EA, Breen G, Forstner AJ, McQuillin A, Ripke S, Trubetskoy V, et al. Genome-wide association study identifies 30 loci associated with bipolar disorder. Nature Genetics. 2019 May;51(5):793-803.
41. Strober M, Freeman R, Lampert C, Diamond J, Kaye W. Controlled family study of anorexia nervosa and bulimia nervosa: evidence of shared liability and transmission of partial syndromes. American Journal of Psychiatry. 2000 Mar 1;157(3):393-401.
42. Szklarczyk D, Gable AL, Lyon D, Junge A, Wyder S, Huerta-Cepas J, et al. STRING v11: protein–protein association networks with increased coverage, supporting functional discovery in genomewide experimental datasets. Nucleic Acids Research. 2019 Jan 8;47(D1):D607-13.
43. Wade TD, Gordon S, Medland S, Bulik CM, Heath AC, Montgomery GW, Martin NG. Genetic variants associated with disordered eating. International Journal of Eating Disorders. 2013 Sep;46(6):594-608.
44. Wainberg M, Sinnott-Armstrong N, Mancuso N, Barbeira AN, Knowles DA, Golan D, et al. Opportunities and challenges for transcriptome-wide association studies. Nature genetics. 2019 Apr;51(4):592-9.
45. Watson HJ, Yilmaz Z, Thornton LM, Hübel C, Coleman JR, Gaspar HA, et al. Genome-wide association study identifies eight risk loci and implicates metabo-psychiatric origins for anorexia nervosa. Nature Genetics. 2019 Aug;51(8):1207-14.
46. Willer CJ, Li Y, Abecasis GR. METAL: fast and efficient metaanalysis of genomewide association scans. BioInformatics. 2010 Sep 1;26(17):2190-1.
47. Wray NR, Ripke S, Mattheisen M, Trzaskowski M, Byrne EM, Abdellaoui A, et al. Genome-wide association analyses identify 44 risk variants and refine the genetic architecture of major depression. Nature Genetics. 2018 May;50(5):668-81.
48. Yu D, Sul JH, Tsetsos F, Nawaz MS, Huang AY, Zelaya I, et al. Interrogating the genetic determinants of Tourette’s syndrome and other tic disorders through genome-wide association studies. American Journal of Psychiatry. 2019 Mar 1;176(3):217-27.
49. Zhou W, Nielsen JB, Fritsche LG, Dey R, Gabrielsen ME, Wolford BN, et al. Efficiently controlling for case-control imbalance and sample relatedness in large-scale genetic association studies. Nature Genetics. 2018 Sep;50(9):1335-41.
50. Zhu Z, Zhang F, Hu H, Bakshi A, Robinson MR, Powell JE, et al. Integration of summary data from GWAS and eQTL studies predicts complex trait gene targets. Nature Genetics. 2016 May;48(5):481-7.