

Abstract
Background: Assessment of cardiac output (CO) in pulmonary hypertension (PH) relies on the thermodilution (TD) and Fick methods using invasively derived data. Echocardiography (echo) enables quick, noninvasive assessment of CO. We assessed the correlation and agreement among TD, Fick, and echo methods.
Methods: Indirect Fick, TD, and echo CO were compared in 89 subjects (age 55 ± 16 yrs, 66% Group 1 PH) using linear regression and Bland-Altman methods. The agreement among the methods for classifying subjects with low cardiac index (CI < 2.5) and elevated pulmonary vascular resistance (PVR ≥ 3) was assessed. For assessment of PVR by echo, invasively derived pressures were used.
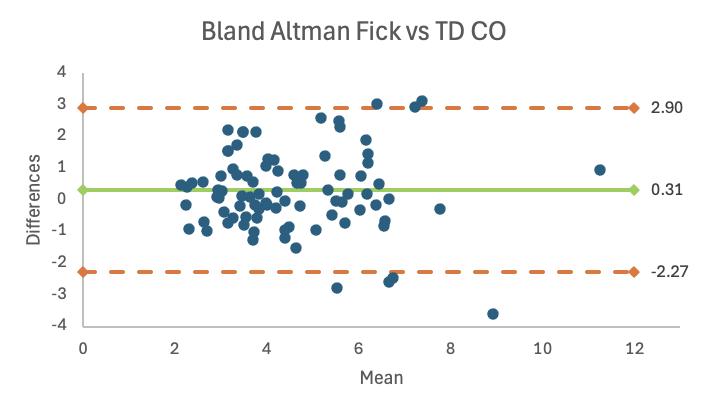
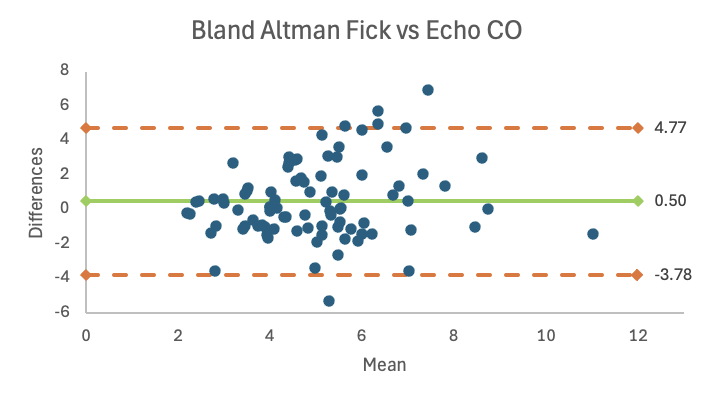
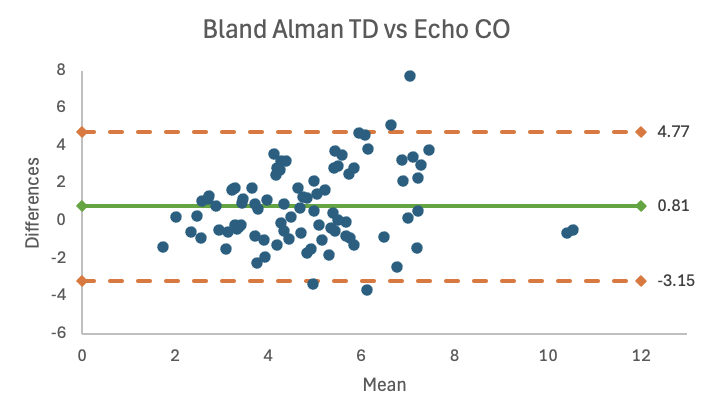
Results: Fick and TD demonstrated fair correlation (r = 0.72, p < 0.001) and modest agreement (bias of +0.31 l/min for Fick, limits of agreement –2.27 to 2.90). Echo CO had weak correlation with TD CO (r = 0.46, p < 0.001) and inferior agreement (bias of +0.81 l/min for echo, -3.15 to 4.77). Echo CO also had weak correlation and inferior agreement with Fick CO (r = 0.37, p < 0.001) (bias of +0.50 l/min for echo, -3.78 to 4.77). The agreement by kappa for identifying CI < 2.5 for Fick and TD, Fick and echo, and TD and echo were 0.55, 0.30, 0.27, respectively. TD classified more patients with CI < 2.5 than Fick or echo. The agreement by kappa for identifying PVR ≥ 3 between Fick and TD, Fick and echo, and TD and echo were 0.81, 0.57, 0.54, respectively. Ninety percent of those with PVR≥3 were still classified as such by substitution of echo CO for Fick or TD CO.
Conclusion: Fick and TD CO had fair correlation and agreement. Echo showed bias towards higher CO and had weaker correlation with Fick and TD. Echo and Fick classified fewer patients with low CI than TD, and all three methods had good agreement for distinguishing those with and without elevated PVR.
Keywords
Cardiac output, Pulmonary hypertension, Echocardiography, Fick, Thermodilution, Low cardiac index, Elevated pulmonary vascular resistance
Introduction
Right heart catheterization is the technique relied upon for accurate assessment of cardiac output (CO) in patients with known or suspected pulmonary hypertension (PH). The Fick and TD methods are used for invasive assessment of CO. It has not been established which invasive method is optimal in PH. Studies comparing the two techniques have shown variable levels of agreement with some concluding that there are significant disparities in identifying patients with low CO [1–3]. Transthoracic two-dimensional and Doppler echocardiography is universally employed in the initial assessment and subsequent monitoring of treatment effects in PH patients. In patients without PH, small studies have shown that echocardiographic assessment of CO correlates well with invasive measurement of CO. In previous studies of PH patients, echocardiography derived CO has been compared to either Fick or thermodilution CO [3–5]. These studies have shown that CO derived by echo and one invasive method have reasonable correlation. However, there is little information regarding the correlation and agreement among all three methods of assessment of CO. It remains uncertain if echocardiography can provide reasonably accurate assessment of CO compared with Fick and TD methods. Reliance on right heart catheterization for ongoing risk assessment and treatment of PH patients may be lessened if noninvasive assessment of CO can accurately identify patients at higher risk with low cardiac index (CI), and elevated pulmonary vascular resistance (PVR) compared with invasive measures. The purpose of this study is to assess the correlation and agreement among the three methods for assessment of CO and to compare the performance of the three methods to identify higher risk subjects with low cardiac index (CI) and elevated PVR.
Methods
Patient selection
The study is a single center retrospective investigation conducted at IU Health Methodist Hospital, Indianapolis, IN. The study was considered exempt from requiring informed consent by the Indiana University Institutional Review Board. The study group was enrolled from 116 consecutive patients with known or suspected PH who had transthoracic echocardiograms within 48 hours of right heart catheterization. Twenty-seven patients on intravenous inotropic therapy at the time of catheterization, changes in pulmonary vasodilator therapy, or changes in diuretic therapy between the procedures were excluded. There were no patients with moderate or worse uncorrected left heart valve disease. The final study population was comprised of 89 patients.
Echocardiography
Complete two-dimensional echocardiographic and Doppler exams were performed using commercially available equipment (Phillips Epiq-5, GE Healthcare Vivid E9, Vivid S70 machines). Echo CO was calculated by the formula: CO = heart rate x LV outflow tract area x LV outflow tract velocity time integral (VTI). LV outflow tract dimension and VTI measurements were performed by highly experienced investigators blinded to the results of cardiac catheterization. LV outflow tract dimension was assessed in the long axis view by measurement from trailing edge to leading edge of the outflow tract wall in close proximity to the aortic valve. After initial measurements were performed, the measurements were audited and revised by one investigator to ensure that LVOT measurements were in line with dimensions predicted by nomograms relating LVOT size to BSA. LV outflow tract VTI was assessed by planimetry of pulsed spectral Doppler envelopes acquired with the sample volume in close proximity to the aortic valve. For the majority of studies, including patients with atrial fibrillation or flutter, one representative Doppler envelope was traced. For selected studies, more than one envelope was traced and VTI measurements were averaged.
Right heart catheterization
Procedures were performed in the supine position using a 7F balloon-tipped catheter with a PA temperature sensor and port for TD. Hemodynamic measurements of right atrial pressure, right ventricular pressure, pulmonary artery (PA) pressure, and PA wedge pressure were made at end-expiration. Following hemodynamic assessment, blood was obtained from the distal port for measurement of mixed venous oxygen saturation. Arterial oxygen saturation was obtained by pulse oximetry or by direct assessment of femoral or radial arterial blood oxygen saturation in patients also undergoing left heart catheterization. Indirect Fick CO was calculated using the following formula (VO2 of 125 ml/min/m2) / (13.6 x hemoglobin g/dL x (arterial oxygen saturation – mixed venous oxygen saturation)). TD measurements were obtained by injection of 10 mL room temperature sterile saline in the proximal port. Three to five values were averaged. PVR was calculated according to the formula: (Mean PA pressure – mean PA wedge pressure)/CO. CI was calculated using body surface area. Echo assessment of PVR utilized the invasively derived pressures with substitution of echo CO for invasively derived CO.
Statistical analysis
Continuous variables are expressed as mean ± one standard deviation. Linear regression of scatterplots was used to assess correlation coefficients (r) for comparisons of TD, Fick, and echo CO. Significant differences in r were assessed by Williams test. The average percentage difference for pairwise comparisons of indirect Fick versus TD, Fick vs echo, and TD vs echo for the 89 patients in the study were calculated using the following formula: Average Percentage Difference = Mean {[(Method A CO – Method B CO) / ((Method A CO + Method B CO)/2)] * 100%. Linear regression and percentage difference were used to assess the reproducibility of VTI measurements.
The Bland-Altman method was employed to assess agreement between two different methods of determining CO by calculating the difference between measurements for each patient and plotting the differences against the average of the two methods. The normality of differences in CO for pairwise comparisons was assessed by the Shapiro-Wilk test and regression was used to assess for proportional bias in the Bland-Altman analysis. Cohen’s kappa statistic and McNemar test were used to assess the agreement between CO methods for categorization of patients with low (CI < 2.5) and normal (CI ≥ 2.5), and for categorization of patients with elevated PVR (PVR ≥ 3) and not elevated PVR (< 3). P values < 0.05 were considered significant.
Results
Patient population
A total of 89 patients were included in the study group. Echocardiography and catheterization were performed on the same day in 32 patients. Clinical characteristics, and selected catheterization and echocardiographic variables in the whole population are shown in Table 1. Fifty-nine patients (67%) were women and 59 (66%) had isolated group I pulmonary hypertension. Fifty-seven (64%) patients had NYHA functional class III or higher. There were 51 patients (57.3%) not taking group I PAH-targeted therapies during both studies. There were 6 patients that had atrial fibrillation or flutter at the time of echocardiography. Three patients had small right to left shunts, all intrapulmonary. Nineteen subjects had moderate to severe tricuspid regurgitation.
|
Variable |
Value |
|
Age, years |
54.8 ± 16.4 |
|
Sex, Females No. (%) |
59 (66.3%) |
|
pHTN group 1 No. (%) |
59 (66.3%), 2 (2.3%), 5 (5.6%), 8 (9%), 10 (11.2%) |
|
Number of pHTN meds (0, 1, 2, 3) |
57.3%, 20.2%, 16.9%, 5.6% |
|
Functional Class # (I, II, III, IIIb, IV, not listed) |
5.6%, 10.1%, 28.1%, 31.5%, 12.4%, 11.2% |
|
Mean nt-proBNP |
4340 ± 10848 |
|
Mean EF |
64.9 ± 8.6 |
|
Mean TAPSE |
1.6 ± 0.5 |
|
RA pressure |
10 ± 7 |
|
Mean PA pressure |
41 ± 15 |
|
PAWP |
13 ± 8 |
|
Indirect Fick CO |
4.8 ± 1.8 |
|
TD CO |
4.4 ± 1.8 |
|
Echo CO |
5.3 ± 2.1 |
|
Fick PVR |
7.3 ± 5.9 |
|
TD PVR |
7.9 ± 6.3 |
|
Echo PVR* |
6.8 ± 6.2 |
|
Table 1 displays the values for demographic, catheterization, and echocardiographic data for 89 patients. Values are presented as mean ± standard deviation or number (percentage), as appropriate. Functional class refers to WHO functional class. Cardiac output (CO) was measured using indirect Fick (Fick CO), thermodilution (TD CO), and echocardiographic (echo CO) methods. Pulmonary vascular resistance (PVR) is reported in Wood units (WU). a) *PVR for echo was calculated using invasive mean PAP and wedge with echo CO substitution for invasively derived CO. b) Abbreviations: pHTN: Pulmonary Hypertension; nt-proBNP: N-terminal pro-B-type Natriuretic Peptide; EF: Ejection Fraction; TAPSE: Tricuspid Annular Plane Systolic Excursion; RA: Right Atrium, PA: Pulmonary Artery; PAWP: Pulmonary Artery Wedge Pressure; CO: Cardiac Output; TD: Thermodilution; PVR: Pulmonary Vascular Resistance |
|
Reproducibility of echocardiographic assessment of velocity time integral
In a subset of patients, two investigators performed measurements of VTI. The r value for the correlation of these measurements was 0.99, with a percentage difference of 3.1%. In a subset of patients with regular rhythm, the VTI obtained from a single systolic envelope was compared with an average of multiple systolic envelopes. The r value for the correlation was 0.99 with a percentage difference of 3.4%. In the 6 patients who had atrial fibrillation or flutter, the percentage difference between VTI obtained from a single representative envelope and an average of VTI measurements from multiple cardiac cycles was 8%.
Relationship and agreement of Fick, TD, and echo CO
The mean CO for Fick, TD, and Echo were 4.8 ±1.8, 4.4 ± 1.8, and 5.3 ± 2.1. The plots in Figure 1 show the relationship between indirect Fick, TD, and echo values for CO using linear regression. There was a fair correlation between Fick and TD (r=0.72, 95% CI 0.60-0.81, p < 0.001). The correlation between Indirect Fick CO adjusted using the LaFarge equation and TD (r = 0.73, 95% CI 0.61-0.81, p < 0.001) was nearly identical to the correlation of unadjusted indirect Fick and TD [6]. Therefore, LaFarge adjusted Fick CO was not included in subsequent analyses. The correlation between Fick and echo (r = 0.37, 95% CI 0.17-0.54, p < 0.001) was significantly weaker (p < 0.001) compared to the correlation for Fick and TD. The correlation between TD and echo (r = 0.46, 95% CI 0.27-0.61, p < 0.001) was also significantly weaker (p = 0.003) compared to the correlation between the invasive methods.
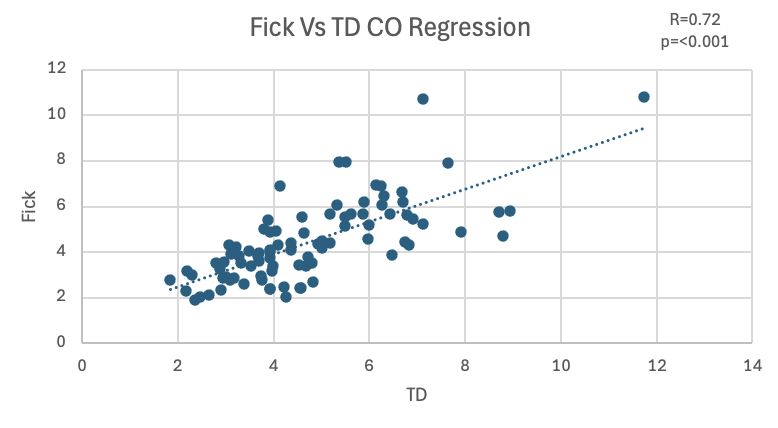
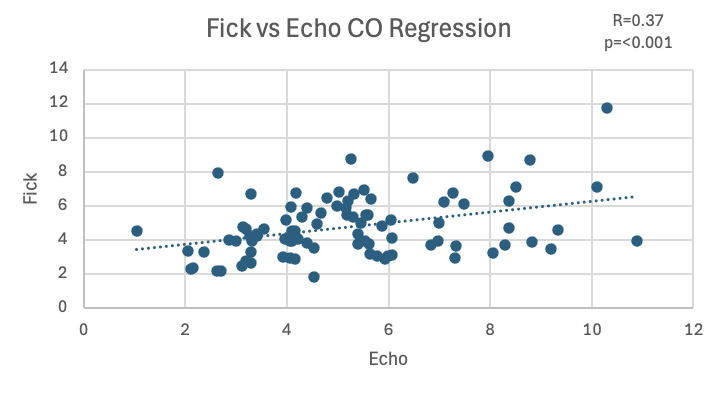
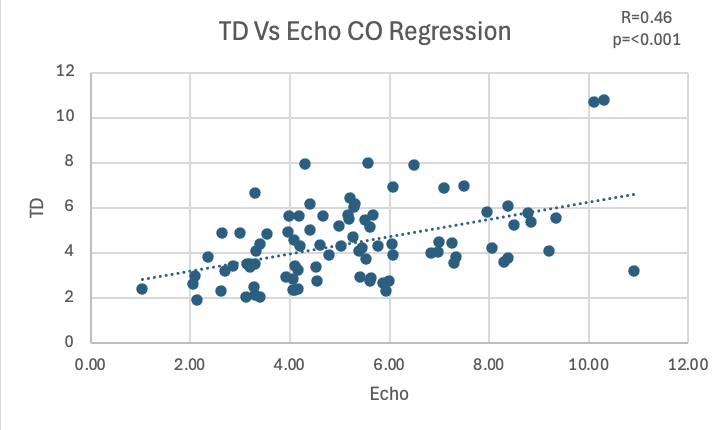
Figure 2 shows the agreement among the three methods of CO determination using Bland-Altman plots. All three pairwise differences (Fick vs TD, Fick vs echo, and TD vs echo) were found to be normally distributed and no proportional bias was found. In the comparison of CO by Fick and TD, there was a mean bias of +0.31 l/min (95% CI, 0.04 and 0.58) for Fick. The limits of agreement (–2.27 to 2.90, 95% CI -2.7 to -1.8 and 2.5 to 3.3) were wide. The percentage difference for Fick and TD CO was 21.9% ± 17.4% which is equivalent to 1 l/min. Echo overestimated CO compared to Fick (mean bias +0.50 for echo, 95% CI between 0.05 and 0.95) with relatively wide limits of agreement ( -3.78 to 4.77, 95% CI -4.5 to -3.1 and 4.1 to 5.5). The percentage difference for Fick and echo CO was 33.2% ± 26.7% which is equivalent to 1.7 l/min. Echo also overestimated CO compared to TD (bias +0.81 for echo, 95% CI between 0.39 and 1.23) with wide limits of agreement (-3.15 to 4.77, 95% CI -3.8 to -2.5 and 4.1 to 5.4). The percentage difference for TD and echo CO was 34.7% ± 24.1% which is equivalent to 1.7 l/min.
Agreement for categorizing CI and PVR
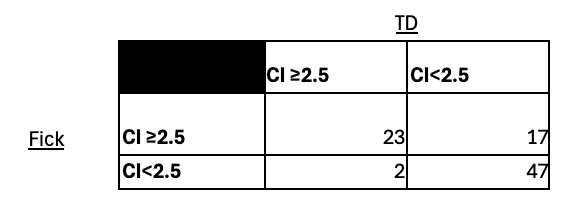
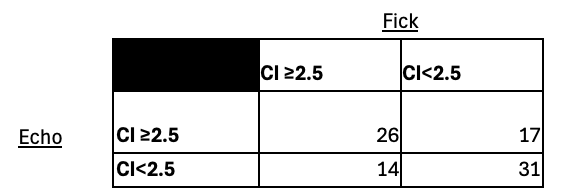
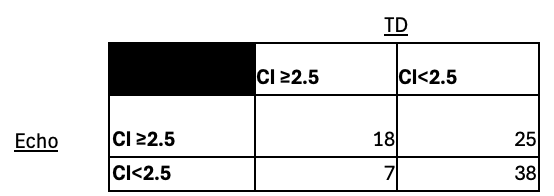
The proportion of patients identified as having CI < 2.5 by Fick, TD, and echo were 55%, and 72%, and 52% respectively. The agreement of the methods for categorizing patients with low and normal CI are shown in Figure 3. There was moderate agreement between Fick and TD (k=0.55, 95% CI 0.38 to 0.73) for CI, with TD classifying more subjects with CI < 2.5 compared to Fick (p= 0.003). The agreement between Fick and echo (k = 0.30, 95% CI 0.10 to 0.50) was modest, with neither method more likely to assign patients to the low CI group (p=0.72). The agreement between TD and echo was also modest (k = 0.27, 95% CI 0.06 to 0.47) with TD classifying more subjects as having low CI (p = 0.001).
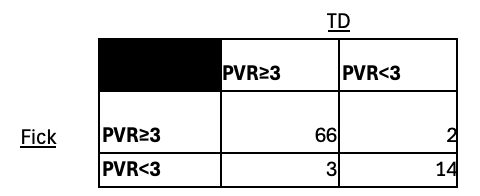
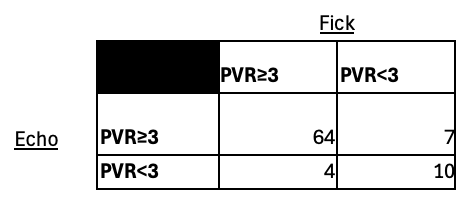
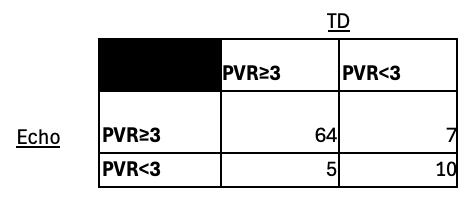
The proportion of patients identified as having PVR ≥ 3 by Fick, TD, and echo were 80%, 80%, and 81% respectively. The PA mean – PAWP difference derived by catheterization was used for the calculation of PVR by echo to see if echo CO could be substituted for invasively derived CO for differentiating patients with and without elevated PVR. The agreement of the methods for categorizing patients according to PVR are shown in Figure 4. Fick and TD had excellent agreement for identification of patients with high PVR (k=0.81, 95% CI 0.65 to 0.97) with neither method more likely to assign patients as having high PVR (p = 0.65). Fick and echo had moderate agreement (k = 0.57, 95% CI 0.33 to 0.81) with no statistically significant discordance in assignment of patients as having normal versus normal PVR (p = 0.37). TD and echo also had moderate agreement (k= 0.54, 95% CI 0.30 to 0.78) and no statistically significant discordance in assignment of patients as having normal versus normal PVR (p = 0.78). Despite the overestimation of CO by echo relative to Fick and TD (Figure 2b and 2c), substitution of echo CO for Fick CO or for TD CO would still have identified over 90% of those with PVR ≥ 3 determined by either invasive method (see Figure 4).
Due to the known impact of heart rate on CO, we reviewed the heart rate data at the time of echo and right heart catheterization. Thirty patients had a ≥10 beat/min or more difference in heart rate between procedures. A subgroup analysis was performed in the 59 subjects with lesser differences in heart rate between procedures to determine if the correlation and agreement between echo and invasive measures could be improved by excluding subjects with substantial heart rate differences. There was a fair correlation between echo and invasive modalities (Fick vs echo, r=0.42, 95% CI between 0.19 and 0.61, p < 0.001) (TD vs echo, r=0.55, 95% CI between 0.34 and 0.71, p < 0.001), which was not significantly improved compared to the correlations in the whole study population (Fick vs echo r = 0.37, TD vs echo, r = 0.46). In the subgroup of patients with heart rate difference < 10 beats/min, echo overestimated CO compared to Fick (mean bias +0.62 for echo) with wide limits of agreement -3.76 to 5). In this subgroup, echo also overestimated CO compared to TD (bias +1.15 for echo) with wide limits of agreement -2.68 to 4.99.
We also investigated the impact of timing of the catheterization and echo procedures on our results by assessing the correlation of invasive CO and echo CO in the subset of patients who had the procedures on the same day. The correlations between Fick and echo (r = 0.34, 95% CI between 0.02 and 0.60), and between TD and echo (r=0.43, 95% CI between 0.13 and 0.66) in those with same day procedures were similar to the whole population (Fick vs echo (r = 0.37), TD vs echo (r=0.46).
Discussion
Comparison of Fick and thermodilution methods for CO assessment
In our study, indirect Fick and TD methods had fair correlation (r = 0.72) which is similar to the results of previously published investigations comparing direct Fick and TD assessment of CO [2,3,7–9]. Although the correlation of invasive methods was reasonable, Bland-Altman analysis demonstrated wide limits of agreement -2.27 to 2.90 l/min with a percentage difference of 21.9% which was equivalent to 1 l/min. The limits of agreement between indirect Fick and TD found in our study are at the upper range of limits found in prior investigations comparing direct Fick and TD methods in patients with pulmonary hypertension [2]. In individual studies, the limits of agreement have ranged from a low of -0.72 to 0.92 to a high of -2.93 to 2.03 [2,3,7]. A limitation of our study was the use of the indirect Fick method. A prior investigation comparing indirect Fick and TD methods in patients with pulmonary hypertension showed both a similar correlation (0.61) between the methods and comparably wide limits of agreement -3.3 to 2.1 l/min [10]. Although it is acknowledged that the direct Fick method is more accurate than the indirect method, the latter is more commonly used. It has been argued that in patients with pulmonary hypertension direct Fick should be used because of variability in resting oxygen consumption. However, at least one study demonstrated no significant difference in resting oxygen consumption in pulmonary hypertension patients compared to normal subjects [11].
The majority of prior investigations have also shown a modest bias (ranging up to 0.64 l/min) towards larger CO using direct Fick compared to TD. Our study also demonstrated a small mean bias towards higher CO by indirect Fick (+ 0.31 l/min). Various explanations have been given for the suboptimal agreement between the Fick and TD methods and the bias towards higher CO with the Fick method in patients with pulmonary hypertension. CO may be underestimated by TD in patients with tricuspid regurgitation [12]. However, other studies have not shown a significant impact of tricuspid regurgitation on TD measurements of CO [13,14]. The optimal invasive method for assessment of CO in pulmonary hypertension may be open to debate. If the Fick method is used, resting oxygen consumption should be measured.
Comparison of echocardiography and invasive methods for CO assessment
To our knowledge, there is limited information comparing echo CO with both invasive measures of CO in PH patients. In our study, echo CO was weakly correlated with both indirect Fick (r = 0.37) and TD (r = 0.46) methods. Two prior studies, comparing TD and echo derived CO showed better correlation (r = 0.72, and r = 0.82) [5,15]. A single study comparing direct Fick and echo CO in PH also showed a better correlation (0.72) than was demonstrated in our study [4]. Two of the investigations utilized TD, and one direct Fick for invasive assessment of CO. These prior investigations showed relatively wide limits of agreement for echo and invasive methods from a low of -1.8 to 1.8 l/min to a high of -2.81 to 2.92 l/min. In our study, Bland-Altman analysis showed poor agreement between echo and Fick (limits of agreement -3.78 to 4.77 l/min, average difference in CO of 1.7 l/min) and between echo and TD methods (-3.15 to 4.77 l/min, average difference in CO 1.7 l/min). Explanations for the weaker correlation of echo CO with invasively derived measures may include the large proportion of patients with low CI, lack of simultaneous acquisition of echocardiography and catheterization data, changes in hemodynamics between the two procedures, and fundamental differences between assessment of CO between echo and the invasive techniques. In our study, more than 50% of patients had low CI as measured by both echo and the invasive methods. There may also be lessened accuracy in assessment of CO by both Fick and TD methods in the setting of low CO. The variability of echo calculation of CO by measurement of velocity time integrals is expected to increase when the magnitude of Doppler flow velocity profiles is reduced in those with low stroke volumes.
Previous studies in both PH and non-PH cohorts showing high correlation between echo CO and invasively derived CO have obtained echo and catheterization data as close in time as possible [16]. In our study, the correlation between invasively determined CO and echo CO was not improved in the subset of patients with same day procedures. Since hemodynamic changes can quickly occur for various reasons such as sedation for the invasive procedure, environmental temperature changes, and patient positioning, optimizing the correlation of echo and invasive measurement of CO might require near simultaneous performance of both procedures. In our study, the correlation of echo and invasive measurements of CO was not improved in those with minimal heart rate differences between procedures. Two-dimensional echo and Doppler determination of CO is fundamentally different compared to invasive methods of assessment of CO. Stroke volume is determined by multiplication of the velocity time integral of the pulsed Doppler systolic envelope by the cross-sectional area of the left ventricular outflow tract. Measurement requires both accurate tracing of the Doppler flow envelope and measurement of the diameter of the outflow tract. In our study, these measurements were performed by highly experienced investigators. The interobserver reproducibility of measurement of VTI was excellent. Some confounding factors such as significant aortic regurgitation were minimized in our study. Early, small studies in patients without pulmonary hypertension have shown high correlation between invasive and echo derived CO using the Doppler echo method employed in this study [16,17]. However, other studies, including one meta- analysis, have shown weaker correlation and agreement between echo and TD assessment of CO with several investigations showing limits of agreement >±3 l/min [18].
The bias towards larger CO by echo compared to Fick (0.50 l/min) and TD (0.81 l/min) in our study is unexplained. Common errors such as placement of Doppler sample volumes apical to the LV outflow tract, suboptimal alignment of the Doppler beam with the direction of blood flow, and underestimation of LVOT area in patients with noncircular outflow tracts would lead to under- rather than overestimation of CO by echo. Previous investigations comparing echo and invasive methods have not shown a consistent bias towards larger CO by echo versus the invasive methods [4,5,15].
Echo, Fick and thermodilution CO for identification of low CI and elevated PVR
We attempted to assess the clinical impact of the bias towards larger CO by echo and Fick compared to TD, and the suboptimal agreement among the three methods by assessing the agreement of the methods for identifying subjects with low cardiac index and those with elevated PVR. Cardiac index (CI) < 2.5 l/min is used as a marker of increased risk in the ESC/ERS risk scoring algorithm for PH, and threshold values of CI in this range identify patients with worse outcomes in other cardiovascular disorders [19]. In our study, over 50% of subjects were classified with low CI by all three methods. The classification of the majority of patients in our study as having low CI is somewhat surprising and the clinical implications are unknown. Perhaps the finding of low CI in most of our patients does reflect the advanced level of illness of our population as the majority were functional class III or above. Echo and Fick classified a similar proportion of patients as having low CI. However, TD classified significantly more patients as having low CI. The clinical significance of this finding in patients with pulmonary hypertension is uncertain. Prognostic studies in patients with a broad range of cardiovascular disorders suggest that CO determined by TD may have greater accuracy than the Fick method in identifying patients with low CI that have poor outcomes [20,21].
Elevation of PVR, defined in our study as PVR ≥ 3 Wood units, identifies patients with pulmonary arterial hypertension. We investigated the question of whether echo CI could be used as a substitute for Fick or TD CI for identifying patients with elevated PVR despite the poor agreement between echo CO and the invasive measures. The agreement between invasive and noninvasive classification of patients based on the PVR cutoff value was moderate (k > 0.50 for the comparisons) and there was no statistically significant discordance between echo and Fick and echo and TD in the classification of patients with elevated PVR. This result may in part be due to the large proportion of patients found to have elevated PVR. In spite of the bias towards higher CO by echo, substitution of echo CO for invasively derived CO still “correctly” identified 90% of patients who had elevated PVR by catheterization.
Limitations
Our study is a single-center retrospective investigation with a relatively limited number of subjects. As was previously discussed, use of the indirect Fick method is a limitation of our study and may explain why the limits of agreement between invasive methods were larger than in most studies comparing the direct Fick method and TD. We included a small number of patients with moderate or worse tricuspid regurgitation. As previously discussed, inaccuracies of the TD method have been linked in some studies to the presence of significant tricuspid regurgitation. We did not exclude these patients from our study as a number of other studies have shown a nonsignificant impact of tricuspid regurgitation on TD measurement of CO and in clinical practice these patients are not excluded from assessment by TD [12,16]. Catheterization and echocardiography were not performed simultaneously, and there were differences in heart rate at the time of performance of the two procedures. In our study, the correlation between invasively measured CO and echo CO were not improved by performance of the two procedures on the same day or by excluding subjects who had substantial differences in heart rate between the two procedures. It is acknowledged that hemodynamic changes occurring between the performance of echo and catheterization may have contributed to the poor agreement between echo and the invasive methods.
Conclusion
Indirect Fick and TD methods had fair correlation and suboptimal agreement for assessment of CO in patients with pulmonary hypertension. As has been recommended for patients with other cardiovascular disorders, the Fick method should be performed with measurement of resting oxygen consumption [22]. It is unclear which invasive method should be relied upon when Fick and TD are discordant. TD assessment yielding low CI and high PVR may identify higher risk patients. Echo yielded higher values for CO and in this particular study had poor agreement with invasive methods. Although it is clear that echo CO is not a substitute for Fick or TD CO, echo classified a similar proportion of patients with low CI as did indirect Fick. Assessment of the classification of patients with PVR > 3 by echo was “artificial” in that pulmonary pressures and pulmonary capillary wedge pressure was not assessed at the time of echo. However, our findings would suggest that despite the bias towards higher CO by echo, identification of patients with elevated PVR may not be negatively impacted by the use of echo CO. Some of the poor agreement between echo and the invasive methods may be due to inherent limitations of the two-dimensional echo Doppler method. Three-dimensional color Doppler quantitation of stroke volume has been shown to be superior to the standard echo technique [23].
Conflicts of Interest
None.
Funding Statement
N/A.
Acknowledgements
None.
References
2. Hoeper MM, Maier R, Tongers J, Niedermeyer J, Hohlfeld JM, Hamm M, et al. Determination of cardiac output by the Fick method, thermodilution, and acetylene rebreathing in pulmonary hypertension. Am J Respir Crit Care Med. 1999;160(2):535–41.
3. Brownstein AJ, Cooper CB, Jasuja S, Sherman AE, Saggar R, Channick RN. Hemodynamic risk assessment by thermodilution and direct Fick measurement of cardiac output in pulmonary hypertension. CHEST Pulm. 2024 Sep 1;2(3):100059.
4. Doutreleau S, Canuet M, Enache I, Di Marco P, Lonsdorfer E, Oswald-Mammoser M, et al. Right Heart Hemodynamics in Pulmonary Hypertension - An Echocardiography and Catheterization Study. Circ J. 2016;80(9):2019–25.
5. D'Alto M, Romeo E, Argiento P, D'Andrea A, Vanderpool R, Correra A, et al. Accuracy and precision of echocardiography versus right heart catheterization for the assessment of pulmonary hypertension. Int J Cardiol. 2013;168(4):4058–62.
6. LaFarge CG, Miettinen OS. The estimation of oxygen consumption. Cardiovasc Res. 1970;4(1):23–30.
7. Yung GL, Fedullo PF, Kinninger K, Johnson W, Channick RN. Comparison of impedance cardiography to direct Fick and thermodilution cardiac output determination in pulmonary arterial hypertension. Congest Heart Fail. 2004;10(2 Suppl 2):7–10.
8. Khirfan G, Ahmed MK, Almaaitah S, Almoushref A, Agmy GM, Dweik RA, et al. Comparison of Different Methods to Estimate Cardiac Index in Pulmonary Arterial Hypertension. Circulation. 2019;140(8):705–7.
9. Sahay S, Lane J, Sharpe MG, Toth D, Paul D, Siuba MT, et al. Impact on Pulmonary Hypertension Hemodynamic Classification Based on the Methodology Used to Measure Pulmonary Artery Wedge Pressure and Cardiac Output. Ann Am Thorac Soc. 2023;20(12):1752–9.
10. Alkhodair A, Tsang MYC, Cairns JA, Swiston JR, Levy RD, Lee L, et al. Comparison of thermodilution and indirect Fick cardiac outputs in pulmonary hypertension. Int J Cardiol. 2018;258:228–31.
11. D'Alonzo GE, Gianotti LA, Pohil RL, Reagle RR, DuRee SL, Fuentes F, et al. Comparison of progressive exercise performance of normal subjects and patients with primary pulmonary hypertension. Chest. 1987;92(1):57–62.
12. Cigarroa RG, Lange RA, Williams RH, Bedotto JB, Hillis LD. Underestimation of cardiac output by thermodilution in patients with tricuspid regurgitation. Am J Med. 1989;86(4):417–20.
13. Abualsaud R, Oro P, Harnegie MP, Hockstein MA, Tonelli AR, Siuba MT. Time to Calm the Fick Down? A Systematic Review and Meta-Analysis of Thermodilution Compared to Direct Fick in Tricuspid Regurgitation. CJC Open. 2024;6(9):1138–44.
14. Hamilton MA, Stevenson LW, Woo M, Child JS, Tillisch JH. Effect of tricuspid regurgitation on the reliability of the thermodilution cardiac output technique in congestive heart failure. Am J Cardiol. 1989;64(14):945–8.
15. Tian Z, Liu YT, Fang Q, Ni C, Chen TB, Fang LG, et al. Hemodynamic parameters obtained by transthoracic echocardiography and right heart catheterization: a comparative study in patients with pulmonary hypertension. Chin Med J. 2011 Jun 20;124(12):1796–801.
16. Lewis JF, Kuo LC, Nelson JG, Limacher MC, Quinones MA. Pulsed Doppler echocardiographic determination of stroke volume and cardiac output: clinical validation of two new methods using the apical window. Circulation. 1984;70(3):425–31.
17. Sahn DJ. Determination of cardiac output by echocardiographic Doppler methods: relative accuracy of various sites for measurement. J Am Coll Cardiol. 1985;6(3):663–4.
18. Wetterslev M, Moller-Sorensen H, Johansen RR, Perner A. Systematic review of cardiac output measurements by echocardiography vs. thermodilution: the techniques are not interchangeable. Intensive Care Med. 2016;42(8):1223–33.
19. Humbert M, Kovacs G, Hoeper MM, Badagliacca R, Berger RMF, Brida M, et al. 2022 ESC/ERS Guidelines for the diagnosis and treatment of pulmonary hypertension. Eur Heart J. 2022;43(38):3618–731.
20. Opotowsky AR, Hess E, Maron BA, Brittain EL, Baron AE, Maddox TM, et al. Thermodilution vs Estimated Fick Cardiac Output Measurement in Clinical Practice: An Analysis of Mortality From the Veterans Affairs Clinical Assessment, Reporting, and Tracking (VA CART) Program and Vanderbilt University. JAMA Cardiol. 2017;2(10):1090–9.
21. Pereira A, Santos JG, Loureiro MJ, Ferreira F, Almeida AR, Cale R, et al. Thermodilution vs indirect fick cardiac output measurement in clinical practice: insights from a tertiary centre. Eur Heart J. 2020 Nov;41(Supplement_2):ehaa946.2252.
22. Rajagopalan N, Borlaug BA, Bailey AL, Eckman PM, Guglin M, Hall S, et al. Practical Guidance for Hemodynamic Assessment by Right Heart Catheterization in Management of Heart Failure. JACC Heart Fail. 2024;12(7):1141–56.
23. Lodato JA, Weinert L, Baumann R, Coon P, Anderson A, Kim A, et al. Use of 3-dimensional color Doppler echocardiography to measure stroke volume in human beings: comparison with thermodilution. J Am Soc Echocardiogr. 2007;20(2):103–12.