Abstract
Guidelines-driven diagnostic investigations for suspicion of functionally relevant coronary artery disease (fCAD) are complex and expensive. Therefore, we evaluated whether a previously validated proteomic residual cardiovascular risk (RCVR) model could complement existing fCAD detection strategies by accurately identifying patients at high risk for an event and safely ruling out fCAD in low-risk patients. Clinical assessments, single-photon emission computed tomography myocardial perfusion imaging, and RCVR proteomic predictions were available in 4106 BASEL VIII study participants previously evaluated for suspicion of fCAD. The ability of each measure to predict the occurrence of major adverse cardiovascular (CV) events were compared separately in participants without (primary) and with (secondary) a history of CV disease. Primary participants with a negative fCAD diagnosis had an unstratified 4-year CV event rate of 9.4%, comparable to the overall event rate of 10.7%, however, the event rate dropped to only 2.3% (p<0.001) when using the RCVR model to identify “low” risk individuals. Similarly, in secondary participants the event rate in “low” risk individuals was only 9.9% (p<0.001) compared to 20.5% in fCAD negative participants and a 26.4% overall event rate. These results suggest RCVR could be used to rule out low risk individuals and potentially eliminate unnecessary testing in 42.2% of primary and 27.6% of secondary participants. RCVR was also able to identify individuals with a negative fCAD diagnosis that were still at high risk of a CV event. Within primary and secondary participants respectively, 7.1% and 14.6% of participants were identified as “high” risk with an observed event rate of 39.9% and 52.0%. Together these results suggest prognostic protein testing in combination with cardiac imaging or clinical diagnostic assessments may provide a more comprehensive assessment of patient risk and aid in medical management and monitoring.
Keywords
Proteomics, Aptamers, Coronary heart disease, Cardiovascular disease, Cardiovascular imaging, Cardiovascular risk reduction, Cardiac biomarkers
Introduction
Coronary artery disease (CAD) is the most common type of heart disease and leading cause of death globally [1–3]. CAD often develops slowly over many years and may remain clinically silent or become functionally relevant (fCAD) by causing non-acute symptoms of myocardial ischemia, which often reduce the ability to exercise and the quality of life. The presence of myocardial ischemia is also strongly linked to catastrophic acute events including cardiovascular death and myocardial infarction (MI). Detection of fCAD is a guidelines-based process of seeking a confirmatory diagnosis through stress testing, nuclear imaging, computed tomography (CT) angiography and/or invasive angiography [4,5]. However, current screening techniques such as pretest probability scores and exercise electrocardiography stress testing have limited diagnostic accuracy and more sophisticated imaging techniques are not only expensive but also carry inherent risks due to substantial radiation exposure, intra-arterial or intravenous application of iodinated contrast media, and mechanical complications [4,6–8]. Additionally, cardiac imaging is increasingly used inappropriately in patients with a low probability for fCAD [9–11]. An estimated one-third of cardiac stress tests with imaging in the US are possibly unnecessary, with an annual cost of more than $500 million [12].
Correct diagnosis of fCAD is mandatory for the rapid initiation of disease-modifying secondary prevention measures in patients without known CAD, as well as anti-ischemic therapy with its proven symptomatic benefit. Differentiation of fCAD from the pure anatomical diagnosis of CAD is also important to ensure that coronary revascularization procedures, all associated with some inherent periprocedural risks, are restricted to coronary lesions that have functional relevance and cause myocardial ischemia, as only these revascularizations have been found to increase the quality of life. Previous pilot studies have suggested that blood-based biomarkers may complement cardiac imaging in the diagnostic and prognostic assessment of patients with suspected fCAD [13–16]. Given that medical therapy can be as effective as surgical interventions in many patients with stable CAD [13–15] and offers multi-factorial systemic benefits beyond the heart [16–19], prediction of a broader composite endpoint that captures the range of outcomes that could be mitigated by drugs becomes more relevant.
We previously developed a residual cardiovascular risk (RCVR) proteomic model that predicts four-year risk for a cardiovascular (CV) event (defined as MI, stroke, trans-ischemic attack, hospitalization for heart failure (HF) or all-cause death) in individuals ≥40 years with one or more known causes of elevated cardiovascular risk, including individuals with: stable cardiovascular disease (history of MI or stroke (>6 months prior), HF, peripheral artery disease, revascularization, abnormal stress test or imaging suggesting coronary heart disease), type 2 diabetes, chronic kidney disease, a history of cancer, symptoms consistent with chronic coronary syndromes, or over 65 years old without known elevated CV risk [17]. The RCVR model predicts CV risk with greater discrimination, broader dynamic range, and better risk reclassification than the ACC/AHA Pooled Cohort ASCVD risk score, and has been shown to be robust to differences in traditional risk factors across nine clinical studies and ~23,000 participants with a 4-year AUC of 0.73 and C-Index of 0.71 [17]. In this study we evaluated for the first time how well the RCVR model compared with existing clinical and imaging methods typically used in the evaluation of suspicion of fCAD.
The overarching goal of this study was to determine whether the RCVR model, a high sensitivity blood test, could complement existing fCAD detection strategies as a risk stratification tool to accurately identify patients at high risk for an event and safely rule out fCAD in low-risk patients, thereby reducing the need for unnecessary and costly procedures. This goal was broken out into three key aims to evaluate whether: 1) The need for cardiac imaging could be ruled-out by RCVR a-priori in a fraction of patients with very low event-rates 2) Unrecognized high cardiovascular risk could be identified by RCVR in a subset of patients without evidence of fCAD in nuclear imaging 3) A proteomic model trained specifically to predict future outcomes could match or exceed the prognostic performance of current diagnostic clinical and imaging procedures.
Materials & Methods
The pre-existing data availability policy for the BASEL VIII study specifies that research data requests can be submitted to their steering committee, will be promptly reviewed for consent, confidentiality, intellectual property restrictions, and privacy laws considerations, and will not unreasonably be refused.
Basel VIII study design
BASEL VIII is a large diagnostic and prognostic study aiming to advance the non-invasive diagnosis of fCAD as adjudicated by independent cardiologists using myocardial perfusion scanning and coronary angiography. The study enrolled over 4,200 consecutive participants with suspected fCAD referred for evaluation using single-photon emission computed tomography myocardial perfusion imaging (SPECT MPI) according to ESC guidelines [4,5]. There were 4,106 evaluable participants with available plasma samples: 1,688 participants without prior cardiovascular disease (CVD “primary”) and 2,418 with known prior CVD (“secondary”); these populations were evaluated separately because of their substantially different background event rates. The study recruited individuals between 2010 and 2016 at the University Hospital Basel and now has up to 8 years of clinical follow-up. It therefore informs the prevalence of fCAD and cardiovascular events in the region. Participants were excluded from the study if they were less than 18 years old, pregnant, or had acute symptoms. Additionally, participants were excluded from the proteomics analysis dataset if incident event follow-up information or censoring was missing, or their plasma samples did not meet standard QC and pre-analytic requirements for the SomaScanTM assay. Ethnicity was not recorded in the study, although study PIs report that the cohort was largely white. Fully informed consent for participation in the study and consent to the use of data for research was obtained from all evaluable participants, and the study was reviewed and approved by the local ethics committee. Characteristics of the BASEL VIII participants used in the proteomics analysis, and stratified by CVD history (primary = no history of CVD and secondary = known history of CVD) are described in Table 1.
|
Covariate |
Measure |
Primary |
Secondary |
|
Sample size |
Number of evaluable participants/samples |
1,688 |
2,418 |
|
CV Events (KM adjusted event rate) |
Event (%) |
10.7% |
26.4% |
|
Myocardial infarction |
0.7% |
10.1% |
|
|
Heart failure |
1.0% |
3.7% |
|
|
Stroke |
1.9% |
4.7% |
|
|
CV death |
3.6% |
8.3% |
|
|
All cause death |
8.1% |
14.4% |
|
|
Functional assessment |
Perfusion (SPECT) |
100% |
100% |
|
Invasive angiography |
221 (13.1%) |
1,058 (43.8%) |
|
|
Revascularizations |
fCAD positive |
0% |
634/1197 (53%) |
|
fCAD negative |
0% |
199/1,213 (16%) |
|
|
Follow-up time (days) |
Event Mean (SD) Range |
863 (679) 7–2,822 |
775 (647) 1–2,958 |
|
No Event Mean (SD) Range |
1,353 (695) 10–3,103 |
1,387 (701) 5–3,053 |
|
|
Age (years) |
Mean (SD) |
65.9 (11.8) |
68.1 (10.6) |
|
Range |
26–95 |
34–93 |
|
|
Sex |
Female (%) |
826 (49%) |
520 (21%) |
|
Male (%) |
862 (51%) |
1,898 (79%) |
|
|
Note that ethnicity/race was not reported. Primary: Participants with no known history of cardiovascular disease; Secondary: Participants with a known history of cardiovascular disease; CV: Cardiovascular; KM: Kaplan-Meier; SPECT: Single Photon Emission Computed Tomography; SD: Standard Deviation; fCAD: Functionally Relevant Coronary Artery Disease |
|||
The standard work-up measures prior to the final fCAD diagnosis (adjudicated by clinical expert consensus) included a “pretest” clinical assessment (the treating cardiologist performed a clinical assessment using an updated Diamond Forrester method considering all available medical information such as medical history, relevant symptoms, risk factors, and any prior imaging, etc. [18]), which estimates the probability of fCAD on a visual analogue scale from 0% to 100% (where scores of 30% and higher were considered positive), a combined pretest assessment with stress-testing electrocardiogram (EKG) score (which was also a continuous score from 0%-100%, where scores of 30% and higher were considered positive), and SPECT MPI (where summed difference scores of at least 2 were considered positive). Standard work-up measures and a final fCAD diagnosis were available for 1,645 primary and 2,329 secondary participants, who also had at least four-year follow-up with adjudicated cardiovascular outcomes (MI, stroke, hospitalization for HF, or all-cause death). Metrics for sensitivity, specificity and accuracy were calculated based on these observed event rates. While invasive angiography was performed in a subset of participants (221 primary and 1,058 secondary) we did not directly compare its prognostic performance metrics with the others because of selection bias; participants were selected for angiography based on the results of SPECT MPI. However, we did evaluate the observed event rates in positive (≥50% obstruction) vs. negative angiography results in this subset of participants because of its inclusion in current NICE guidelines [19].
Proteomic profiling
The modified aptamer binding reagents [20], SomaScanTM assay [21,22], and its performance characteristics [23] have been previously described. Briefly, the SomaScan assay begins as a mix of ~5,000 SOMAmerTM reagents labelled with a 5’ fluorophore, photocleavable linker, and biotin are immobilized on streptavidin (SA)-coated beads and incubated with 55 uL of EDTA plasma. Non-specific interactions are disrupted using a polyanionic competitor and SOMAmer reagents are hybridized to complementary sequences on a DNA microarray chip and quantified by fluorescence. SomaScan was run on EDTA plasma samples taken at rest (not during stress testing) from each of the 4106 evaluable participants in the BASEL VII study. Standard normalization procedures were conducted [24].
Residual cardiovascular risk model
The development and validation of The Residual Cardiovascular Risk – 4 years model utilized in these analyses has been described previously [17]. The RCVR model predicts the likelihood of a CV event (defined as a MI, stroke, HF hospitalization or all-cause death) within 4 years in individuals ≥40 years with one or more known causes of elevated cardiovascular risk, including individuals with: stable CVD (history of MI or stroke (>6 months prior), HF, peripheral artery disease, revascularization, abnormal stress test or imaging suggesting coronary heart disease), type 2 diabetes, chronic kidney disease, a history of cancer, symptoms consistent with chronic coronary syndromes, or over 65 years old without known elevated CV risk. The model consists of 27 proteins, the majority of which are known to be associated with CVD, a full list of the proteins with their proportionate contribution to the model output, along with the coefficients of variation for each analyte have been previously published [17]. The model output is a continuous score from 0-100 which is calibrated for absolute likelihood only in high-risk secondary populations and a relative risk category: “low”, “medium-low”, “medium-high”, and “high” that applies across a wide risk spectrum.
Statistical analyses
The relative-risk categories were used to create three potential binary outputs (“low” vs the rest, “low” combined with “medium-low” vs. “medium-high” combined with “high”, and “high” vs. the rest) to allow for the calculation and comparison of sensitivity and specificity between RCVR and the binary outputs of the other standard workup measures. Additionally, the continuous model output of RCVR was used to combine with the other information that was found to be statistically significantly prognostic for four-year cardiovascular events in these data sets (age, sex, summed rest score from perfusion imaging and kidney disease diagnosis for primary participants, and age, summed difference score from perfusion imaging, kidney disease diagnosis and diabetes for secondary participants) to evaluate whether they significantly added to the performance scores for either fCAD diagnosis or RCVR in Cox proportional hazards models using optimally weighted combinations of results. Continuous outputs were also used to calculate AUCs and C-Indices for individual measures. For statistical testing, two-sided t-tests are shown, unadjusted for multiple comparisons. The event-rate results are described for the whole evaluable population (1,688 primary and 2,418 secondary) except for the comparison between methods in Table 2 and Figure 2 where the subset of 1,645 primary and 2,329 secondary with all available comparator components are used. Small but non-significant differences in event rates may be thus observed between the two. Statistical significance and p-values for differences in diagnostic performance and event rates between methods were calculated using McNemar’s test. We did not correct for multiple comparisons.
|
Measure |
Risk Stratification |
Primary |
Secondary |
|||
|
n |
4 Year KM Adjusted Event Rate (%) |
n |
4 Year KM Adjusted Event Rate (%) |
|||
|
fCAD diagnosis, all participants |
negative |
1,441 |
9.4 |
1,168 |
20.5 |
|
|
positive |
204 |
21.3 |
1,161 |
31.4 |
||
|
RCVR, all participants |
Low risk |
695 |
2.3 |
642 |
9.9 |
|
|
Medium-low risk |
608 |
11.2 |
943 |
21.4 |
||
|
Medium-high risk |
206 |
19.8 |
366 |
35.0 |
||
|
High risk |
136 |
41.4 |
378 |
59.1 |
||
|
RCVR in participants with fCAD negative diagnosis |
Low risk |
660 |
2.3 |
357 |
8.9 |
|
|
Medium-low risk |
520 |
11.6 |
485 |
16.5 |
||
|
Medium-high risk |
158 |
12.9 |
156 |
28.9 |
||
|
High risk |
103 |
39.9 |
170 |
52.0 |
||
|
RCVR “low” as a potential rule-out threshold |
fCAD negative |
low risk |
660 |
2.3 |
357 |
8.9 |
|
fCAD positive |
low risk |
35 |
2.9 |
285 |
10.9 |
|
|
fCAD negative |
Not low risk |
781 |
15.8 |
811 |
25.9 |
|
|
fCAD positive |
Not low risk |
169 |
25.3 |
876 |
38.5 |
|
|
Primary: Participants with no known history of cardiovascular disease; Secondary: Participants with a known history of cardiovascular disease; n: Number of participants; RCVR: Residual Cardiovascular Risk; fCAD: Functionally Relevant Coronary Artery Disease; KM: Kaplan-Meier. |
||||||
Results
The patient journey and distributions of events for each step of the fCAD diagnostic work-up stratified by RCVR relative risk bin are shown in Supplemental Data Table S1. The background unstratified four-year observed event rates were 10.7% in primary (n=1,688) and 26.4% in secondary (n=2,418) populations. The KM adjusted four-year event rates in fCAD negative participants were 9.4% in primary and 20.5% in secondary, compared to 21.3% and 31.4%, respectively in fCAD positive participants. Observed event rates in the four predefined RCVR relative-risk categories were 2.3% and 9.9% (for primary and secondary, respectively) for the “low” risk bin, 11.2% and 21.4% for the “medium-low” risk bin, 19.8% and 35.0% for the “medium-high” risk bin, and 41.4% and 59.1% for the “high” risk bin (see Table 2). Survival curves stratified by fCAD diagnosis and RCVR relative risk bins are depicted in Figure 1.
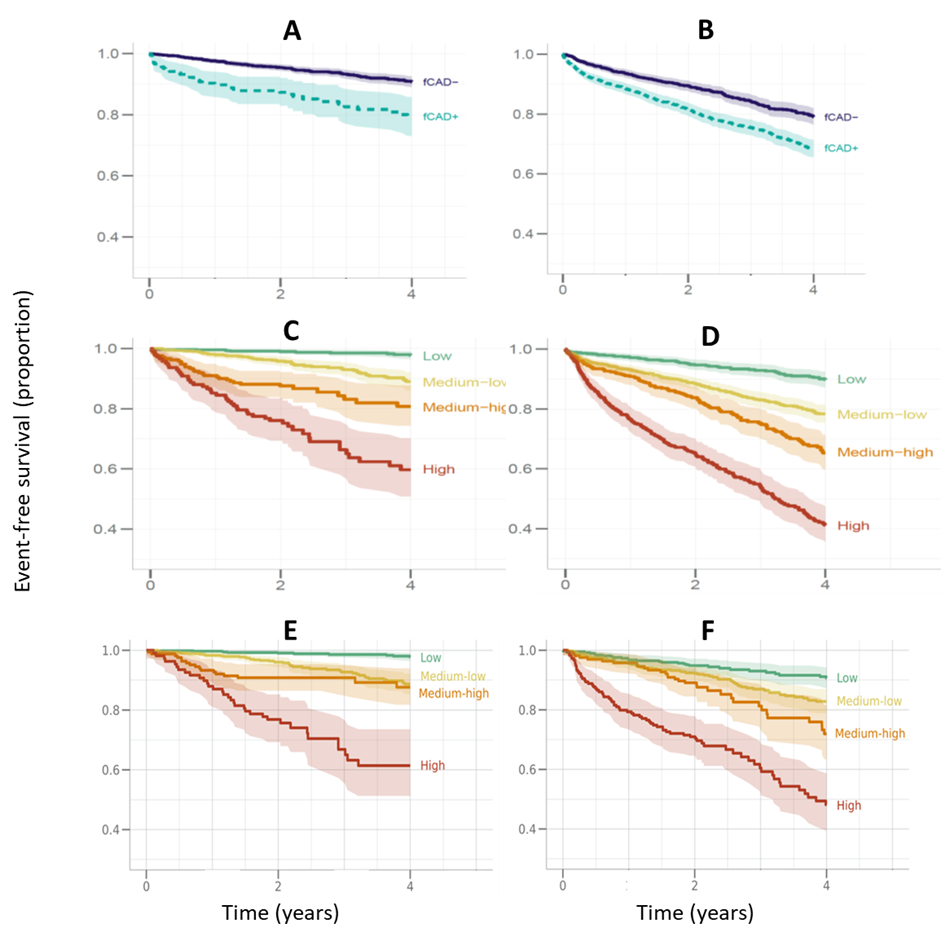
Figure 1. Kaplan-Meier Survival Curves for Four Years Post Evaluation Showing Event-Free Survival vs Time. Left panels (A, C, E) – primary (participants with no known history of cardiovascular disease), right panels (B, D, F), secondary (participants with a history of cardiovascular disease). Upper panels A and B, functional assessment results per guidelines (final fCAD diagnosis using all available clinical and imaging data) Panels C-F are for RCVR proteomic predictions in the four predefined relative categories. Solid lines are for the fCAD negative diagnoses and dashed lines for the positive diagnoses. Panels C and D are for the whole primary and secondary populations respectively. Panels E and F are RCVR predictions in the subset of fCAD negative participants only. Shading represents the 95% confidence intervals. fCAD: Functionally Relevant Coronary Artery Disease; RCVR: Residual Cardiovascular risk.
To assess whether RCVR could be used to identify low risk participants and rule out unnecessary fCAD workup procedures we compared event rates between the RCVR “low” relative risk category and fCAD negative diagnosis (see Table 2). In primary participants 695/1645 (42.2%) were categorized as “low” risk and the observed event rate was only 2.3%, about one quarter of the event rate observed in the fCAD negative group (9.4%) (p<0.001). Similarly in secondary participant, 642/2329 (27.6%) participants were categorized as “low” risk and the observed event rate was 9.9%, about half the event rate in the fCAD negative group (20.5%) (p<0.001).
Alternatively, to determine whether RCVR could be used to identify participants with a fCAD negative diagnosis that are still at high risk of a CV event we assessed the discriminatory performance and risk stratification of RCVR in this subset and compared it to the full dataset. Discriminatory performance, measured by 4-year AUC, was equivalent between the full dataset and the subset of participants with an fCAD negative diagnosis. In primary participants AUC=0.81 (95% CI, 0.77–0.85) and in secondary participants AUC=0.76 (95% CI, 0.73–0.78). Similarly, stratification of observed event rates in these fCAD negative participants across the four RCVR relative risk categories (“low”, “medium-low”, “medium-high” and “high”) was also maintained with observed event rates of 2.3%, 11.6%, 12.9% and 39.9% in primary participants (n=1441) and 8.9%, 16.5%, 28.9% and 52.0% in secondary participants (n=1168). Despite being diagnosed as fCAD negative there were still a substantial number of participants identified as high risk for a CV event; 103/1,441 (7.1%) primary participants and 170/1,168 (14.6%) secondary participants were classified as “high” risk. Their survival curves are shown in the lower panels of Figure 1 (panels E and F) and KM adjusted event rates in Table 2. Together these results demonstrate that RCVR could be used to identify fCAD negative participants that are still at high risk of a CV event.
Lastly, to assess whether RCVR could further complement current diagnostic clinical and imaging procedures, the prognostic performance of RCVR was compared to each step of the fCAD workup on its own and in combination with key clinical covariates. There were 1,645 primary and 2,329 secondary participants with all the diagnostic evaluation results available; Supplemental Data Table 1 shows the patient journey and individual results.
As anticipated, the clinical diagnostic pretest assessment and stress EKG had limited accuracy with a large number of false positives, making it difficult to use them as a rule out test. Conversely imaging techniques had a substantially lower number of false positives but there was also a reduction in the number of true positives and an increase in false negatives, which reflects the participants that are diagnosed as fCAD negative but still go on to have a CV event. RCVR was assessed using three different cut-offs, a low risk cut-off which classified the majority of participants as positive, resulting in a higher number of true positives and false negatives, similar to the clinical diagnostics, an upper risk cut-off which classified “low” + “medium-low” risk as negative and “medium-high” + “high” risk as positive, resulting in higher balanced accuracy, and a high risk cut-off which classified the majority of participants as negative, resulting in a higher number of true negatives but also a higher number of false negatives. Figure 2 shows the proportions of the populations with each class of results and Table 3 shows the predictive accuracy.
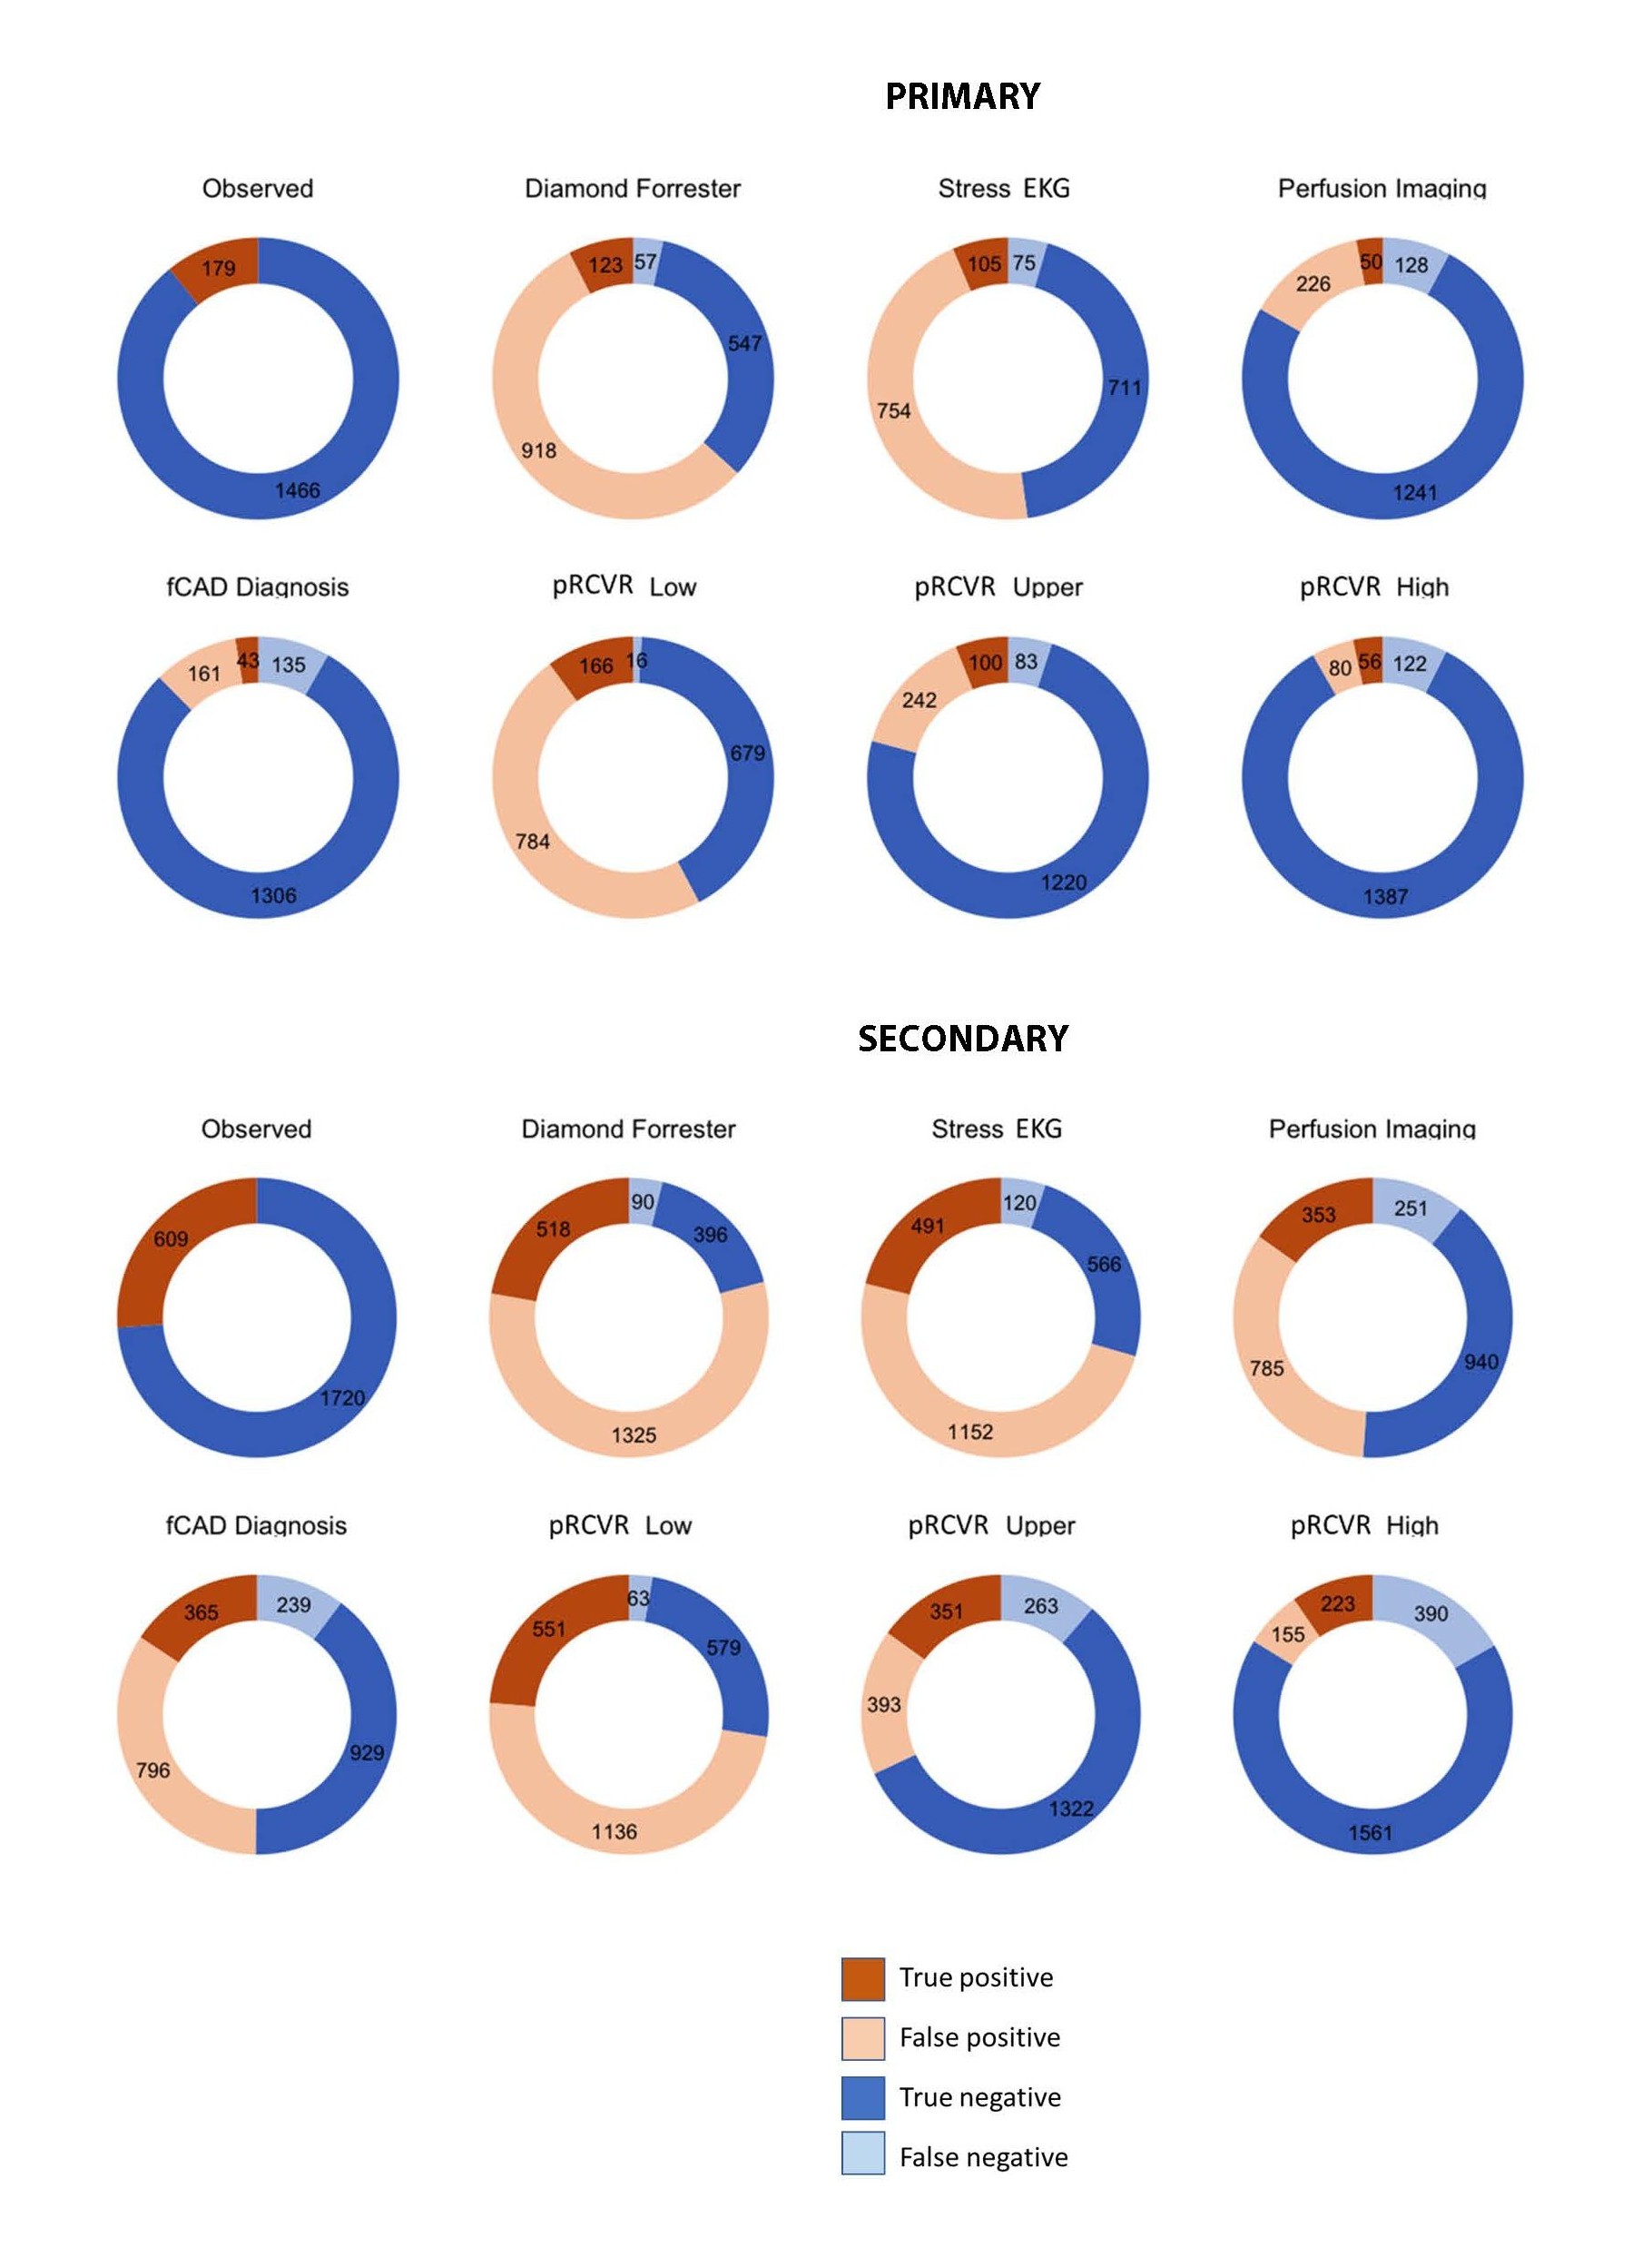
Figure 2. Prediction of Cardiovascular Events within Four Years; Proportions of the population with each result type. Upper panel – results in primary participants, lower panel, results in secondary participants. The true outcomes are shown by the pie-charts at the apex of each pyramid, and the predictions below. The three dichotomizations possible from the four-category protein predictions from proteomic residual cardiovascular risk (RCVR) are shown in the middle row: “upper” is the highest two categories vs. the lowest two; “high” is the high-risk category vs. the rest, and “low” is the lowest risk category vs. the rest. For Diamond-Forrester, positive is a score of 30%; the label of “stress echo” is in combination with the preceding Diamond-Forrester result.
|
RCVR Upper |
RCVR low |
RCVR High |
Diamond-Forrester |
Stress-EKG |
Perfusion |
fCAD positive |
|
|
Primary (n=1,645) |
|||||||
|
N events |
183 |
182 |
178 |
180 |
180 |
178 |
178 |
|
N negative class |
1,303 |
695 |
1,509 |
604 |
786 |
1,369 |
1,441 |
|
N positive class |
342 |
950 |
136 |
1,041 |
859 |
276 |
204 |
|
True Negatives |
1,220 |
679 |
1,387 |
547 |
711 |
1,241 |
1,306 |
|
True Positives |
100 |
166 |
56 |
123 |
105 |
50 |
43 |
|
False Negatives |
83 |
16 |
122 |
57 |
75 |
128 |
135 |
|
False Positives |
242 |
784 |
80 |
918 |
754 |
226 |
161 |
|
Positive Predictive Value |
29.2% |
17.5% |
41.2% |
11.8% |
12.2% |
18.1% |
21.1% |
|
Negative Predictive Value |
93.6% |
97.7% |
91.9% |
90.6% |
90.5% |
90.7% |
90.6% |
|
Sensitivity |
54.6% |
91.2% |
31.5% |
68.3% |
58.3% |
28.1% |
24.2% |
|
Specificity |
83.4% |
46.4% |
94.5% |
37.3% |
48.5% |
84.6% |
89.0% |
|
Balanced Accuracy |
69.0% |
68.8% |
63.0% |
52.8% |
53.4% |
56.3% |
56.6% |
|
Secondary (n=2,329) |
|||||||
|
N events |
614 |
614 |
613 |
608 |
611 |
604 |
604 |
|
N negative class |
1,585 |
642 |
1,951 |
486 |
686 |
1,191 |
1,168 |
|
N positive class |
744 |
1,687 |
378 |
1,843 |
1,643 |
1,138 |
1,161 |
|
True Negatives |
1,322 |
579 |
1,561 |
396 |
566 |
940 |
929 |
|
True Positives |
351 |
551 |
223 |
518 |
491 |
353 |
365 |
|
False Negatives |
263 |
63 |
390 |
90 |
120 |
251 |
239 |
|
False Positives |
393 |
1,136 |
155 |
1,325 |
1,152 |
785 |
796 |
|
Positive Predictive Value |
47.2% |
32.7% |
59.0% |
28.1% |
29.9% |
31.0% |
31.4% |
|
Negative Predictive Value |
83.4% |
90.2% |
80.0% |
81.5% |
82.5% |
78.9% |
79.5% |
|
Sensitivity |
57.2% |
89.7% |
36.4% |
85.2% |
80.4% |
58.4% |
60.4% |
|
Specificity |
77.1% |
33.8% |
91.0% |
23.0% |
32.9% |
54.5% |
53.9% |
|
Balanced Accuracy |
67.1% |
61.8% |
63.7% |
54.1% |
56.7% |
56.5% |
57.1% |
|
Primary: Participants with no known history of cardiovascular disease; Secondary: Participants with a known history of cardiovascular disease; n: Number of participants; RCVR: Residual Cardiovascular Risk; fCAD: Functionally Relevant Coronary Artery Disease; EKG: Electrocardiogram. |
|||||||
Balanced accuracy ((sensitivity + specificity)/2) was higher using any RCVR cut-off compared to diagnostic clinical or imaging assessment for predicting 4-year risk of a CV event. The RCVR upper cut-off resulted in the highest balanced accuracy, which was 69.0% in primary participants and 67.1% in secondary participants compared to 52.8% and 54.1% (for primary and secondary, respectively) for clinical assessment, 53.4% and 56.7% for clinical assessment + stress-EKG, 56.3% and 56.5% for SPECT MPI and 56.6% and 57.1% for final fCAD diagnosis. All comparisons of clinical assessments vs. RCVR were statistically significant to p<0.001. This is shown graphically in Supplemental Figure S1.
Similarly, discriminatory performance (measured by 4-year AUC and C-Index) was higher in RCVR compared to clinical and imaging assessments in predicting CV event risk. Table 4 shows the discrimination metrics for various combinations of reference comparators alone, in combination with each other and with other statistically significantly prognostic covariates vs. proteins alone and in combination. Time-independent C-index measures in primary and secondary participants, respectively, were 0.571 and 0.568 (standard error 0.013 and 0.011) for fCAD diagnosis alone, adding other significant prognostic covariates (age, sex, kidney disease status, and summed rest score > 2) increased performance to 0.759 and 0.654 (standard error 0.025 and 0.012). In comparison, the C-index for RCVR alone (in primary and secondary participants, respectively) was 0.790 and 0.706 (standard error 0.023 and 0.012) and this was not significantly improved by adding other prognostic covariates.
In the subset of patients with angiographic information, (n=221 for primary and n=1058 for secondary), four-year event rates in the <50% and >50% stenosis groups were similar with a 15% event rate in the <50% group vs. a 17% event rate in the >50% group in primary participants and 23% vs. 35% in secondary participants.
|
Primary |
|||
|
Model |
4-year AUC |
C-index |
Std. Error |
|
fCAD diagnosis only |
0.589 |
0.571 |
0.013 |
|
fCAD + Summed rest score (SRS)>2 |
0.609 |
0.604 |
0.017 |
|
fCAD + Summed difference score (SDS) |
0.602 |
0.608 |
0.018 |
|
fCAD + age, sex, SRS, kidney disease |
0.703 |
0.759 |
0.025 |
|
RCVR only |
0.810 |
0.790 |
0.023 |
|
RCVR + age, sex, SRS, kidney disease |
0.815 |
0.799 |
0.023 |
|
RCVR + fCAD |
0.800 |
0.787 |
0.023 |
|
RCVR + fCAD + age, sex, SRS, kidney disease |
0.813 |
0.798 |
0.023 |
|
Secondary |
|||
|
Model |
AUC |
C-index |
Std. Error |
|
fCAD diagnosis only |
0.545 |
0.568 |
0.011 |
|
FCAD + Summed rest score (SRS)>2 |
0.555 |
0.581 |
0.012 |
|
fCAD + Summed difference score (SDS) |
0.548 |
0.571 |
0.012 |
|
fCAD + Age, diabetes, kidney disease, SRS |
0.678 |
0.654 |
0.012 |
|
RCVR only |
0.755 |
0.706 |
0.012 |
|
RCVR + Age, diabetes, kidney disease, SRS |
0.743 |
0.700 |
0.012 |
|
RCVR + fCAD |
0.745 |
0.708 |
0.012 |
|
RCVR + fCAD + age, diabetes, kidney disease, SRS |
0.748 |
0.709 |
0.012 |
Discussion
Given the general recognition that medical therapy in chronic coronary syndromes confers improvements in major adverse outcomes at least as well as revascularization procedures, and that medical therapies have benefits beyond coronary events, the emphasis for investigation of suspicion of fCAD arguably evolves from diagnosis of local coronary disease towards predicting systemic risks of future events. We therefore evaluated to what extent the existing guidelines-mediated diagnostic procedures were also systemically prognostic for CV events within four years in people with suspicion of fCAD, and how this compared to the performance of a prognostic proteomic CV risk model that was specifically trained and validated to predict future outcomes.
In recognition that imaging has an established position in medical practice, the first study aim, to evaluate use of the RCVR as a relatively safe “rule-out” test using the predefined “low” risk threshold, represents a modest option to incrementally change practice and save costs, while preserving the application of standard workup to higher risk patients. As shown in Table 2 the RCVR “low” cutoff has the highest sensitivity (number of true positives detected) in both primary and secondary participants, with better specificity than the next most sensitive options. Using “low” cut-point could potentially eliminate 42.2% and 27.6% of existing fCAD testing in primary and secondary participants respectively, by identifying people with event-rates 4.9-fold and 2.6-fold (in primary and secondary, respectively) lower than the overall background event rate and 4.1-fold and 2.1-fold lower than the event rate in fCAD negative patients. It is reasonable to argue that for these patients a “low” RCVR result is more indicative of low event risk (and a lesser requirement for escalating the intensity of medical therapy) than would be indicated by a negative fCAD result.
Additionally, utilizing RCVR (with the “low” threshold) as a rule-out test could reduce patient burden by avoiding unnecessary testing and save money. The average cost of a stress-EKG and SPECT MPI is $2302 [12], but a coronary angiogram is considerably more expensive at $6,035.50 [25], using the BASEL VIII study as a reference, 13.1% of primary participants and 43.8% of secondary participants were referred for coronary angiography bringing the total cost per participant to an average of $3,394 for primary participants and $3883 for secondary participants. The clinical laboratory fee schedule price for the RCVR test is $762. In primary participants, the RCVR test could eliminate 42.2% of existing fCAD testing and save an average of $1432 per person, these savings are more modest in the secondary participants where the RCVR test could eliminate 27.6% of fCAD testing and save $310 per person.
The second aim of the study was to determine whether RCVR could identify unrecognized CV risk in fCAD negative groups (the “false negative” results), as a potential complement to imaging (either in the full population or limited to those not ruled out by the RCVR “low” threshold). The results shown in Figure 1 support this as a viable option: C-indices for RCVR in both primary and secondary participants were not significantly different between fCAD negative patients vs. the whole group and the observed four-year event rates in the RCVR relative risk categories were also similar. Participants within the fCAD negative group categorized as “high” risk by RCVR had observed event rates of 39.9% and 52.0% in primary and secondary participants respectively. These participants have exorbitant unresolved CV risk and a median time to event of less than 2 years indicating the need for maximal medical therapy, but this need was not identified through the fCAD diagnostic workup.
The third aim of the study addressed whether RCVR, either alone or in combination with measures obtained during the standard diagnostic workup, could enhance prognostic performance beyond what is achievable through standard diagnostic measures alone. A wide range of stratification is desirable to modulate the intensity of medical therapy. Kaplan-Meyer adjusted four-year event rates in the RCVR relative risk categories (“low”, “medium-low”, medium-high” and “high”) were 2.3%, 11.2%, 19.8%, and 41.4% for primary participants, with an 18-fold risk ratio (between the “low” and “high” risk categories), and 9.9%, 21.4%, 35.0%, and 59.1% for secondary participants, with a six-fold risk ratio. Additionally, if a binary result is required, the RCVR “upper” cutoff (“low” + “medium-low” vs. “medium-high” + “high”) has a closer alignment with the actual outcomes (adjudicated CV events) than any other test individually including the final fCAD diagnosis (see Table 3 and Figure 2). This is reflected in the balanced accuracy metrics shown in Table 3 and Supplemental Figure S1 was also higher than any individual element of the standard workup.
It is also pertinent to determine whether combining the RCVR results with the other available clinical measures could further enhance performance, but Table 3 shows that this is not the case. Performance metrics for RCVR (both time-independent C-index and four-year AUC) were statistically significantly superior to any individual diagnostic result and to combinations of stress testing, perfusion imaging, age, sex, kidney function and diabetes, and adding these covariates to RCVR did not significantly improve performance. Interestingly, as performed in a large subset of patients, invasive angiography was also only modestly prognostic for this broad composite endpoint (MI, stroke, HF hospitalization, and all-cause death), 50% stenosis positive patients had event rates only 1.1-fold and 1.5-fold higher than negative patients.
Conclusion
These results suggest that if RCVR was used in a more assertive way, to replace the traditional workup for chronic coronary syndromes for patients eligible for optimum medical therapy, the treatment intensity could be more concordant with actual risks than by using any combination of typically available assessments. In addition, the use of RCVR could empower the treating physician by avoiding referral for sophisticated cardiac imaging.
This study has many strengths and some potential limitations. This is a single study in a single region, albeit in over 4,000 participants. However, both the rule-out application and the imaging alternative application would depend upon the prognostic performance and consistent risk categorization of RCVR, which has already been well established in more than ~23,000 participants representative of various geographic regions, diverse races and ethnicities and genders [17]. Another limitation is that we could not evaluate the benefit of revascularizations that could have impacted the observed event rates; therefore, in a post-hoc analysis we evaluated whether the fCAD result could have been impaired by a large beneficial effect of revascularizations performed shortly after the test, which would tend to reduce the difference in event rates between the two groups. Our evaluation showed that this was unlikely to be the case; excluding acute revascularizations associated with events rather than the evaluation result, RCVR predicted event rates prior to the procedures were the same in revascularized and non-revascularized groups and observed event rates were not significantly lower in revascularized groups. Another potential limitation is that we forced the diagnostic tests to predict a broad composite endpoint rather than what they were designed to do (diagnose local disease), even though they are commonly used to modulate therapeutic intensity. The rationale here is that the systemic medical interventions that would be modulated by a prognostic test (statins, glucagon-like peptide-1 receptor agonists, proprotein convertase subtilisin/kexin type 9 inhibitors, sodium-glucose cotransporter-2 antagonists or anti-inflammatory agents) are not limited to the reduction of myocardial events, but rather are a match for the composite endpoint we used [26–28].
Finally, another limitation is that we did not test whether clinicians would actually act upon the provision of a proteomic test. However, it has been recently reported in randomized studies that poor risk assessment underpins clinicians’ difficulty in aligning cardioprotective therapy to guidelines, and that this mis-match can be significantly improved when physicians are provided with individualized proteomic CV risk results [29]. Thus, it seems plausible that this type of test could have near-term applicability in this similar context of use, at least in the US where it is commercially available.
In summary, these findings suggest that if physicians would be willing to modify diagnostic and prognostic workflows for suspicion of fCAD, the 27-protein prognostic test could have several roles that could reduce costs, avoid patient exposure to radiation and invasive procedures, and improve outcomes in people whose risks were otherwise missed.
Conflicts of Interest
SomaLogic Inc. funded the costs of the proteomic assays and SW, DA, JC are current employees of the company, MH is a former employee of the company, and RO is a retired employee of the company.
Funding
Research grants from Innosuisse, the Swiss Heart Foundation, the University Basel, the University Hospital Basel, Abbott, Astra Zeneca, Boehringer Ingelheim, Novartis, Roche, Schiller, Somalogic, and Singulex.
Acknowledgements
The BASEL VIII study and clinical evaluations therein were performed at the Cardiovascular Research Institute and University Hospital Basel, Spitalstrasse 2, 4056 Basel, Switzerland.
The SomaScan assay®, application of proteomic tests, bioinformatics analyses and regulatory documents creation were performed at SomaLogic Inc, 2,945 Wilderness Place, Boulder, Colorado 80301, USA
We thank Dr. Peter Ganz (Zuckerberg San Francisco General Hospital, San Francisco) and Dr. Nelson Trujillo (Boulder Community Health, Boulder CO) for early editorial comments, and Dr. Robert Gerszten (Beth Israel Deaconess Hospital, Boston) for the suggestion to evaluate the timing of revascularization procedures.
Authors’ Contributions
Conceptualization: SW, JC, and RO, Bioinformatics analyses: DA, and MH, Clinical parent study conceptualization, design, and execution: KM, MD, JW, and CM, Clinical data/analysis management: JC, Writing—original draft: SW, Writing—review and editing: SW, JC, DA, MH, RO, KM, MD, JW, CM, Writing—updated manuscript: JC.
References
2. Mozaffarian D, Benjamin EJ, Go AS, Arnett DK, Blaha MJ, Cushman M, et al. Heart Disease and Stroke Statistics-2016 Update: A Report From the American Heart Association. Circulation. 2016;133(4):e38–360.
3. Townsend N, Wilson L, Bhatnagar P, Wickramasinghe K, Rayner M, Nichols M. Cardiovascular disease in Europe: epidemiological update 2016. Eur Heart J. 2016;37(42):3232–45.
4. Vrints C, Andreotti F, Koskinas KC, Rossello X, Adamo M, Ainslie J, et al. 2024 ESC Guidelines for the management of chronic coronary syndromes. Eur Heart J. 2024;45(36):3415–537.
5. McDonagh TA, Metra M, Adamo M, Gardner RS, Baumbach A, Böhm M, et al. 2021 ESC Guidelines for the diagnosis and treatment of acute and chronic heart failure. Eur Heart J. 2021;42(36):3599–726.
6. Puelacher C, Wagener M, Abächerli R, Honegger U, Lhasam N, Schaerli N, et al. Diagnostic value of ST-segment deviations during cardiac exercise stress testing: Systematic comparison of different ECG leads and time-points. Int J Cardiol. 2017;238:166–72.
7. Ladapo JA, Blecker S, Douglas PS. Physician decision making and trends in the use of cardiac stress testing in the United States: an analysis of repeated cross-sectional data. Ann Intern Med. 2014;161(7):482–90.
8. Bock C, Walter JE, Rieck B, Strebel I, Rumora K, Schaefer I, et al. Enhancing the diagnosis of functionally relevant coronary artery disease with machine learning. Nat Commun. 2024;15(1):5034.
9. Zakharzhevskaya NB, Shagaleeva OY, Kashatnikova DA, Goncharov AO, Evsyutina DV, Kardonsky DA, et al. Proteogenomic annotation of T6SS components identified in Bacteroides fragilis secretome. Front Microbiol. 2025;16:1495971.
10. Juarez-Orozco LE, Saraste A, Capodanno D, Prescott E, Ballo H, Bax JJ, et al. Impact of a decreasing pre-test probability on the performance of diagnostic tests for coronary artery disease. Eur Heart J Cardiovasc Imaging. 2019;20(11):1198–207.
11. Rozanski A, Gransar H, Hayes SW, Min J, Friedman JD, Thomson LE, et al. Temporal trends in the frequency of inducible myocardial ischemia during cardiac stress testing: 1991 to 2009. J Am Coll Cardiol. 2013;61(10):1054–65.
12. Mark DB, Federspiel JJ, Cowper PA, Anstrom KJ, Hoffmann U, Patel MR, et al. Economic Outcomes With Anatomical Versus Functional Diagnostic Testing for Coronary Artery Disease. Ann Intern Med. 2016;165(2):94–102.
13. Walter J, du Fay de Lavallaz J, Koechlin L, Zimmermann T, Boeddinghaus J, Honegger U, et al. Using High-Sensitivity Cardiac Troponin for the Exclusion of Inducible Myocardial Ischemia in Symptomatic Patients: A Cohort Study. Ann Intern Med. 2020;172(3):175–85.
14. Walker RG, Kato T, Ben Driss L, Williams SA, Hinterberg MA, Janjic N, et al. Activated GDF11/8 subforms predict cardiovascular events and mortality in humans. Nat Commun. 2025;16(1):6534.
15. Amrein M, Meier S, Schäfer I, Schaedelin S, Willemse E, Benkert P, et al. Serum neurofilament light chain in functionally relevant coronary artery disease and adverse cardiovascular outcomes. Biomarkers. 2023;28(3):341–51.
16. Amrein M, Li XS, Walter J, Wang Z, Zimmermann T, Strebel I, et al. Gut microbiota-dependent metabolite trimethylamine N-oxide (TMAO) and cardiovascular risk in patients with suspected functionally relevant coronary artery disease (fCAD). Clin Res Cardiol. 2022;111(6):692–704.
17. Williams SA, Ostroff R, Hinterberg MA, Coresh J, Ballantyne CM, Matsushita K, et al. A proteomic surrogate for cardiovascular outcomes that is sensitive to multiple mechanisms of change in risk. Sci Transl Med. 2022;14(639):eabj9625.
18. Genders TS, Steyerberg EW, Alkadhi H, Leschka S, Desbiolles L, Nieman K, et al. A clinical prediction rule for the diagnosis of coronary artery disease: validation, updating, and extension. Eur Heart J. 2011;32(11):1316–30.
19. Moss AJ, Williams MC, Newby DE, Nicol ED. The Updated NICE Guidelines: Cardiac CT as the First-Line Test for Coronary Artery Disease. Curr Cardiovasc Imaging Rep. 2017;10(5):15.
20. Rohloff JC, Gelinas AD, Jarvis TC, Ochsner UA, Schneider DJ, Gold L, et al. Nucleic Acid Ligands With Protein-like Side Chains: Modified Aptamers and Their Use as Diagnostic and Therapeutic Agents. Mol Ther Nucleic Acids. 2014;3(10):e201.
21. Gold L, Ayers D, Bertino J, Bock C, Bock A, Brody EN, et al. Aptamer-based multiplexed proteomic technology for biomarker discovery. PLoS One. 2010;5(12):e15004.
22. Brody E, Gold L, Mehan M, Ostroff R, Rohloff J, Walker J, et al. Life's simple measures: unlocking the proteome. J Mol Biol. 2012;422(5):595–606.
23. Kim CH, Tworoger SS, Stampfer MJ, Dillon ST, Gu X, Sawyer SJ, et al. Stability and reproducibility of proteomic profiles measured with an aptamer-based platform. Sci Rep. 2018;8(1):8382.
24. Williams SA, Kivimaki M, Langenberg C, Hingorani AD, Casas JP, Bouchard C, et al. Plasma protein patterns as comprehensive indicators of health. Nature Medicine. 2019;25(12):1851–7.
25. Oseran AS, Ati S, Feldman WB, Gondi S, Yeh RW, Wadhera RK. Assessment of Prices for Cardiovascular Tests and Procedures at Top-Ranked US Hospitals. JAMA Intern Med. 2022;182(9):996–9.
26. Packer M, Anker SD, Butler J, Filippatos G, Ferreira JP, Pocock SJ, et al. Effect of Empagliflozin on the Clinical Stability of Patients With Heart Failure and a Reduced Ejection Fraction: The EMPEROR-Reduced Trial. Circulation. 2021;143(4):326–36.
27. Packer M, Butler J, Zannad F, Filippatos G, Ferreira JP, Pocock SJ, et al. Effect of Empagliflozin on Worsening Heart Failure Events in Patients With Heart Failure and Preserved Ejection Fraction: EMPEROR-Preserved Trial. Circulation. 2021;144(16):1284–94.
28. Husain M, Bain SC, Holst AG, Mark T, Rasmussen S, Lingvay I. Effects of semaglutide on risk of cardiovascular events across a continuum of cardiovascular risk: combined post hoc analysis of the SUSTAIN and PIONEER trials. Cardiovasc Diabetol. 2020;19(1):156.
29. Peabody JW, Paculdo D, de Belen E, Ganesan D, Cooney I, Trujillo N. Clinical utility of a novel test for assessing cardiovascular disease risk in type 2 diabetes: a randomized controlled trial. Diabetol Metab Syndr. 2023;15(1):155.