Abstract
Introduction: Higher left ventricular filling pressure (LVFP) is often associated with non-fluid responsiveness in heart failure patients, particularly those with reduced ejection fraction. This hemodynamic state has been linked to adverse outcomes, including higher rates of rehospitalization and mortality. However, the prognostic implications of fluid responsiveness assessed after decongestion remain uncertain.
Aims: To explore the relationship between fluid responsiveness and short-term outcomes in patients with heart failure and reduced ejection fraction, by assessing changes in the Velocity Time Integral (VTI), measured at LVOT using apical 5-chamber view via echocardiography during the passive leg raising (PLR) maneuver.
Methods: This prospective observational analytical cohort study enrolled patients with acute heart failure reduced ejection fraction who were hospitalized for decongestion at Adam Malik Hospital between December 2024 and March 2025. Fluid responsiveness was defined as an increase in VTI of ≥10% before and after performing the PLR. The relationship between fluid responsiveness and the outcomes of rehospitalization and mortality at 30 days and 3 months was analyzed using the Chi-square test.
Results: Among 65 enrolled patients, 37 (57%) were classified as non-fluid responders (NFR). Within 30-day after discharge, 4 (10.8%) patients were rehospitalized, and 2 (5.4%) patients died. Within 3-months after discharge, 8 (21.6%) patients were rehospitalized, and 7 (18.5%) patients died. Twenty-eight (43%) were classified as fluid responders (FR). Within 30-day after discharge, 4 (14.3%) patients were rehospitalized and 3 (10.7%) patients died. Within 3-months after discharge, 2 (7.1%) patients were rehospitalized, and 5 (17.9%) patients died. No statistically significant differences in rehospitalization or mortality rates at either 30 days or 3 months between two groups. Event rates showed overlapping patterns across fluid responsiveness categories.
Conclusions: In this exploratory analysis, fluid responsiveness assessed by PLR was not associated with short-term rehospitalization or mortality in decongested patients with HFrEF. Given the limited statistical power, these findings should be interpreted as hypothesis-generating rather than confirmatory, and further adequately powered studies are warranted to clarify the prognostic role of PLR-derived fluid responsiveness in this population.
Keywords
Acute heart failure reduced ejection fraction, Fluid responsiveness, Mortality, Passive leg raising, Rehospitalization
Introduction
Heart failure is still a growing global health challenge, affecting approximately 65 million individuals worldwide, with a prevalence of one to two percent among adults. Data from the 2019 Global Burden of Disease, Injuries, and Risk Factors Study showed that Indonesia has increasing prevalence of heart failure from 835.45 (666.27–1,050.39) to 900.90 (717.73–1,138.87) per 100,000 population [1].
Although implementation in the four pillars of heart failure therapy have improved patient’s prognosis, heart failure continues to contribute to global rates of rehospitalization and mortality. Data from the 2020 REPORT-HF study shows that the crude one-year mortality rate in Indonesia stays at 34.1%. Both clinical congestion and hemodynamic congestion—marked by elevated filling pressures—are key providers to these adverse outcomes [1,2].
Left ventricular filling pressure (LVFP), demarcated as the left ventricular end-diastolic pressure (LVEDP), serves as a substitute for pulmonary capillary wedge pressure (PCWP). Decreases in both systolic and diastolic pulmonary artery pressures demonstrate a linear correlation with PCWP, which indirectly replicate mean right atrial pressure (RAP). According to Nagueh et al., LVFP can be consistently estimated through echocardiographic measurement, with parameters such as the E/A ratio, E/e′ ratio, and E-wave velocity demonstrating positive correlations with filling pressure (r = 0.44, 0.53, and 0.52, respectively) [3–6].
Prior study has demonstrated that handling therapy based on invasively measured pulmonary artery pressures in patients with acute heart failure improved outcomes, including reduced rates of rehospitalization and mortality [7–12]. The improved outcomes noticed in certain patient groups are mostly attributed to lower pulmonary artery pressures. This phenomenon is parallel with the left ventricular performance curve described by the Frank–Starling law, which hypotheses that increases in left ventricular end-diastolic pressure or volume augment contractile strength—reproduced by stroke volume, or by the Velocity Time Integral (VTI) on echocardiography—up to a critical threshold. Beyond this plateau, further increases in preload fail to produce additional gains in stroke volume [13–15].
Based on this description, patients positioned on the horizontal part of the Frank–Starling curve are considered non-fluid responsive, as their VTI does not increase following additional preload or fluid administration. Meanwhile, fluid responsiveness is characterized by a rise in stroke volume—or VTI on echocardiographic measurement—after preload addition, indicating that the patient remains on the steep part of the curve and that LVFP is still within a range the body can physiologically compensate for.
Previous trials suggests that the latter group experiences lower rates of rehospitalization and mortality compared with the non-responsive group [7–12]. Building on this, this study aims to determine whether fluid responsiveness in patients with acute heart failure reduced ejection fraction impacts the incidence of rehospitalization and mortality following hospital discharge.
Fluid responsiveness was evaluated by measuring VTI via non-invasive echocardiography before and after increasing preload using the passive leg raising (PLR) technique. The PLR maneuver is considered a more rational approach, as it shifts approximately 300 mL of blood from the lower extremities to the heart without actual fluid administration, thus avoiding the risks of hemodilution, further raise of cardiac filling pressures, fluid overload, and aggravation of heart failure [13,16,17].
Briefly, previous studies have shown that invasive pulmonary artery pressure examinations in heart failure patients indicate that pulmonary artery (PA) pressure has a very significant relationship with patient prognosis, particularly regarding rehospitalization and mortality rates. Previous studies such as MONITOR-HF, GUIDE-HF, and CHAMPION stated that diuresis until the PA pressure of heart failure patients reaches normal levels will provide a better impact compared to the control group whose PA pressure is higher at discharge.
All of them using invasive hemodynamic monitoring implanted into pulmonary artery to monitor PA pressure during and after hospitalization [7–12].
The GUIDE-HF study by Lindenfeld et al. in 2021 was carried out on heart failure patients with elevated BNP or recently hospitalized due to acute heart failure with NYHA class II-IV, regardless of EF. It was found that the incidence of rehospitalization and mortality was lower in the monitored group during the 12 months period. Similar to GUIDE-HF, MONITOR-HF and CHAMPION also conducted invasive monitoring with hemodynamic monitoring (CardioMEMS-HF system) in chronic heart failure patients with NYHA class III and a history of prior hospitalization and were monitored at 3, 6, and every 6 months thereafter up to 48 months with results obtained showing that patients with lower PA pressure have lower rehospitalization and mortality rates (better outcomes). This occurs because patients with lower PA pressure are considered to still respond to fluid and are able to increase stroke volume with increased preload according to the Frank-Starling law. This study was designed by drawing an analogy between PA pressure/wedge pressure measured invasively through catheterization or invasive monitoring and left ventricular end-diastolic pressure assessed through parameters such as E/A, E velocity, and E/e’ measured noninvasively using echocardiography. To evaluate fluid responsiveness, the passive leg raising technique was used to avoid actual volume addition in heart failure patients [7–12].
Material and Methods
Study design and population
This study builds upon our earlier investigation examining the relationship between left ventricular filling pressure and fluid responsiveness. In this follow-up investigation, we explore short-term outcomes—specifically rehospitalization and mortality—within 30 days and three months after discharged, comparing patients classified as fluid responders and non-fluid responders.
An observational analytical study with a prospective cohort design was conducted at Adam Malik Hospital between December 2024 and April 2025. The study population consisted of patients hospitalized for decongestion due to acute heart failure with reduced ejection fraction (HFrEF).
The follow-up periods of 30 days and 3 months were selected because these intervals are considered vulnerable phases for rehospitalization after acute decompensation, as reported in the EuroHeart Failure Survey II and subsequent studies [23–25]. Additionally, the 3-month period may reflect early post-discharge outcomes potentially influenced by the initiation or optimization of guideline-directed medical therapy.
Eligibility criteria
Patients aged ≥18 years with a diagnosis of acute heart failure according to the 2021 ESC Guidelines [18] were eligible if heart failure was secondary to coronary artery disease, hypertensive heart disease, or cardiomyopathy, and if left ventricular ejection fraction was ≤40%.
Exclusion criteria included non-sinus rhythm (e.g., atrial fibrillation or pacemaker rhythm), lower limb amputation, severe peripheral arterial disease, significant valvular heart disease, prosthetic mitral or aortic valves, severe mitral annular calcification, or significant pericardial disease.
Echocardiographic assessment and PLR protocol
Echocardiographic assessments were performed after patients had undergone decongestion and were deemed clinically stable for discharge by the attending cardiologist. Decongestion was determined based on routine clinical assessment, including the resolution of signs of volume overload (such as peripheral edema, pulmonary rales, or jugular venous distension), stable hemodynamic status, and clinical judgment. Laboratory parameters were obtained from the final blood samples collected during hospitalization.
The passive leg raising (PLR) maneuver was used to transiently increase preload. Patients were initially positioned in a semi-Fowler position (30–45°) with the lower limbs horizontal. Velocity–time integral (VTI) at the left ventricular outflow tract (LVOT) was used as a surrogate for stroke volume and measured at baseline and during PLR. When beat-to-beat variability was present, VTI values were averaged over three consecutive cardiac cycles.
PLR was performed by elevating the lower limbs to 30–45° while maintaining the upper body in a horizontal position for one minute, after which post-PLR VTI measurements were obtained. Echocardiographic examinations were conducted using Philips S5-1, GE Vivid S60N, and GE Vivid E95 systems (GE Healthcare, Waukesha, WI, USA). All measurements were performed by trained operators; formal intra-observer variability analyses were not conducted.
Fluid responsiveness was defined as an increase in VTI of ≥10% following PLR, whereas non–fluid responsiveness was defined as a VTI increase <10% or no increase [13].
Outcomes and follow up
All patients were followed for the occurrence of rehospitalization due to acute heart failure and all-cause mortality within 30 days and within three months after hospital discharge. Rehospitalization due to acute heart failure was defined as an unplanned hospital admission in which a diagnosis of acute heart failure was documented in the electronic medical record by the treating physician. No independent adjudication of rehospitalization cause was performed. Mortality was defined as death from any cause.
Statistical analysis
Data were analyzed using SPSS version 26. Categorical variables were expressed as frequencies (n) and percentages (%). Continuous variables were presented as mean ± standard deviation (SD) for normally distributed data or as medians with interquartile ranges for non-normally distributed data. Normality was assessed using the Kolmogorov–Smirnov test (n > 50).
Bivariate analyses were performed to explore associations between fluid responsiveness status and baseline clinical, laboratory, and echocardiographic variables. Variables included in the logistic regression model were selected based on clinical relevance and prior literature rather than on bivariate significance. These analyses were conducted as exploratory assessments and were not pre-specified as hypothesis-testing analyses.
The primary analyses evaluated the association between fluid responsiveness (fluid responder vs non-fluid responder) and clinical outcomes (rehospitalization and mortality at 30 days and 3 months) using the Chi-square or Fisher’s exact test, as appropriate. All analyses were interpreted descriptively, and no variables or analyses were excluded from reporting based on statistical significance or direction of results. A two-sided p-value <0.05 was considered statistically significant.
Ethical consideration
The study was conducted in accordance with the Declaration of Helsinki and approved by the Health Research Ethics Committee of the Faculty of Medicine, Universitas Sumatera Utara (No. 94/KEPK/USU/2025). Permission to collect data was obtained from Adam Malik Hospital. Written and verbal informed consent was obtained from all participants or their relatives. All identifying information was anonymized to ensure patient confidentiality.
Results
Patients’ selection
Of the 72 patients initially enrolled, 7 were lost to follow-up and excluded from analysis. Data from the remaining 65 patients were analyzed among them, 28 patients (43%) met the criteria for fluid responsiveness and were assigned to the fluid responder (FR) group, while the remaining 37 patients (57%) were classified as non-fluid responders (NFR).
Baseline characteristics and therapy
Baseline characteristics and medication history are summarized in Table 1. The mean age of the study population was 50 years (range 40–60 years) and was comparable between the two groups. The majority of patients were male. Smoking prevalence was higher in the NFR group (86.5%) than in the FR group (57.1%). The prevalence of comorbidities, including type 2 diabetes mellitus (T2DM), hypertension, and coronary artery disease, was similar between groups; however, dyslipidemia was more common in the NFR group.
Overall, 38 patients (58.5%) presented with acute decompensated heart failure (ADHF), including 18 patients (64.3%) in the FR group and 20 patients (54.1%) in the NFR group. The remaining patients had acute de novo heart failure.
Blood samples were collected for all patients prior to hospital discharge. Renal function was similarly impaired in both groups. Regarding heart failure functional status, all patients in both groups were discharged with New York Heart Association (NYHA) functional class below IV, with no significant intergroup difference. Laboratory parameters were also comparable between groups.
Although guideline-directed medical therapy (GDMT) was initiated more frequently in the FR group than in the NFR group, the difference was not statistically significant. Both groups received comparable furosemide regimens, with a maximum dose of ≤80 mg/day, and no patients in either group were prescribed doses exceeding 240 mg/day.
|
Variables |
Total (N=65) |
FR (N=28) |
NFR (N=37) |
P value |
|
Age (year) |
59 (49-65,5) |
54 (46-64,8) |
59 (49,5-66) |
0,367b |
|
Sex (male; orang; %) |
54 (83,1) |
21 (75) |
33 (89,2) |
0,131a |
|
Medical History (person; %) Smoker CHF Type 2 DM Hypertension Coronary artery disease Dyslipidemia |
48 (73,8) 38 (58,5) 26 (40) 31 (47,7) 54 (83,1) 36 (55,4) |
16 (57,1) 18 (64,3) 13 (46,4) 15 (53,6) 22 (78,6) 10 (35,7) |
32 (86,5) 20 (54,1) 13 (35,1) 16 (43,2) 32 (86,5) 26 (70,3) |
0,008a 0,407a 0,357a 0,409a 0,399a 0,006a |
|
Renal function (ml/menit/1,73 m2) eGFR ≥ 90 eGFR 60-90 eGFR 30-59 eGFR 15-29 eGFR < 15 |
13 (20) 24 (36,9) 23 (35,4) 2 (3,1) 3 (4,6) |
8 (28,6) 10 (35,7) 7 (25) 2 (7,1) 1 (3,6) |
5 (13,5) 14 (37,8) 16 (43,2) 0 2 (5,4) |
0,193a |
|
NYHA FC (person, %) II III IV |
20 (30,8) 45 (69,2) 0 |
10 (35,7) 18 (64,3) |
10 (27) 27 (73) |
0,452a |
|
Laboratory results before discharge Hemoglobin, gr/dl White blood cell, /µL Platelet, /µL Creatinine, mg/dl Serum urea mg/dl eGFR (%) Sodium, mmol/L Potassium, mmol/L Chloride, mmol/L |
12,6±2,3 9880 (8655–12435) 279000 (229500–334000) 1,3 (1–1,8) 44 (26,5–64,5) 61,9±26,7 142 (140–146) 4,2±0,6 105 (101–106) |
12,1±2,3 10065 (8632–14612) 300500 (250500–337500) 1,3 (0,9–1,8) 34 (22,8–67) 64,29±30,7 142 (139–146) 4,11±0,7 105 (99–106) |
13±2,3 9880 (8610–11115) 275000 (218500–323000) 1,3 (1,1–1,8) 46 (32–64) 60,08±23,4 142 (141,5–146) 4,22±0,5 105 (102–106) |
0,080c 0,389b 0,308b 0,503b 0,257b 0,533c 0,275b 0,480c 0,820b |
|
Discharge medication (person, %) Antiplatelet Statin Nitrat Beta-blocker ACE-I ARB ARNI MRA SGLT2 inh Ivabradine CCB Furosemide ≤ 80 mg 81 - 160 mg 160 – 240 mg 240 mg |
44 (67,7) 44 (67,7) 35 (53,8) 43 (66,2) 27 (41,5) 12 (18,5) 13 (20) 46 (70,8) 4 (6,2) 2 (3,1) 6 (9,2)
59 (90,8) 5 (7,7) 1 (1,5) 0 |
21 (75) 20 (71,4) 15 (53,6) 22 (78,6) 12 (42,9) 6 (21,4) 7 (25) 21 (75) 3 (10,7) 2 (7,1) 3 (10,7)
25 (89,3) 2 (7,1) 1 (3,6) |
23 (62,2) 24 (64,9) 20 (54,1) 21 (56,8) 15 (40,5) 6 (16,2) 6 (16,2) 25 (67,6) 1 (2,7) 0 3 (8,1)
34 (91,9) 3 (8,1) 0 |
0,273a 0,575a 0,969a 0,066a 0,851a 0,592a 0,381a 0,514a 0,183a 0,099a 0,719a 0,508a |
Baseline echocardiographic parameters
Baseline echocardiographic parameters obtained prior to hospital discharge are presented in Table 2. Left ventricular ejection fraction (LVEF) was similar between groups (FR: 29.5 ± 6.1% vs. NFR: 30.7 ± 6.5%; p = 0.450). Right ventricular systolic function, assessed by tricuspid annular plane systolic excursion (TAPSE), was also comparable (FR: 18.57 ± 3.2 mm vs. NFR: 17.68 ± 4.3 mm; p = 0.308).
Diastolic filling pressures were compared between groups. E-wave velocity was above 50 cm/s in both groups and did not differ significantly. However, the FR group exhibited a significantly lower E/A ratio [0.96 (0.8–1.31)] compared with the NFR group [1.5 (1.0–2.3); p = 0.013]. Septal and lateral e′ velocities tended to be higher in the FR group, although these differences did not reach statistical significance.
Estimated filling pressures based on E/e′ ratio and pulmonary capillary wedge pressure (PCWP) were significantly lower in the FR group. Mean E/e′ was 13.37 ± 6.2 in the FR group versus 16.13 ± 5.7 in the NFR group, and mean PCWP was 18.48 ± 7.7 mmHg versus 21.91 ± 7.1 mmHg, respectively (p = 0.048).
In the FR group, velocity–time integral (VTI) increased by 14%, from 13.43 ± 3.9 cm before passive leg raising (PLR) to 15.97 ± 4.2 cm after PLR. In contrast, the NFR group showed a 4% decrease in VTI, from 13.32 ± 3.3 cm to 12.73 ± 3.3 cm. Estimated right atrial pressure (eRAP) was similar between groups, with elevated eRAP observed in 5 patients (17.9%) in the FR group and 3 patients (8.1%) in the NFR group.
|
Variables |
Total (N=65) |
FR (N=28) |
NFR (N=37) |
P value |
|
LV Ejection Fraction (%) |
30.2±6.3 |
29.5±6.1 |
30.7±6.5 |
0.450 |
|
TAPSE (mm) |
18.06±3.9 |
18.57±3.2 |
17.68±4.3 |
0.365 |
|
E (cm/s) |
82.44±24.9 |
76.95±28.67 |
87.2±21 |
0.100 |
|
E/A |
1.24 (0.83–1.85) |
0.96 (0.8–1.31) |
1.5 (1.0–2.3) |
0.014 |
|
e sept (cm/s) |
5.8 (4.53–7.28) |
5.8 (4.4–8.4) |
5.6 (4.6–7.1) |
0.633 |
|
e lat (cm/s) |
6.01±2.3 |
6.38±2.4 |
5.7±2.2 |
0.213 |
|
E/e’ |
14.78±5.9 |
13.37±6.2 |
16.13±5.7 |
0.048 |
|
PCWP (mmHg) |
20.2±7.4 |
18.48±7.7 |
21.91±7.1 |
0.048 |
|
VTI pre-PLR (cm) |
13.45±3.5 |
13.43±3.9 |
13.32±3.3 |
0.906 |
|
VTI post-PLR (cm) |
14.2±4 |
15.97±4.2 |
12.73±3.3 |
0.001 |
|
eRAP (person, %) Normal Intermediate High |
18 (28.1) 38 (59.4) 8 (12.5) |
9 (32.1) 14 (50) 5 (17.9) |
9 (24.3) 24 (67.6) 3 (8.1) |
0.339 |
Clinical outcomes
Clinical outcomes are presented in Table 3. At 30-day follow-up, rehospitalization rates did not differ significantly between the FR and NFR groups (14.3% vs. 10.8%, respectively; OR 0.727, 95% CI 0.165–3.202; p = 0.673). Three-month rehospitalization occurred more frequently in the NFR group, although this difference was not statistically significant (FR: 7.1% vs. NFR: 21.6%; OR 3.586, 95% CI 0.697–18.44; p = 0.109).
Thirty-day mortality rates were comparable between groups (FR: 10.7% vs. NFR: 5.4%; OR 0.476, 95% CI 0.074–3.063; p = 0.426), as were three-month mortality rates (FR: 17.9% vs. NFR: 18.5%; OR 1.073, 95% CI 0.302–3.821; p = 0.913). Figure 1 illustrates a higher number of rehospitalizations during the first three months among NFR patients.
|
Outcomes |
Fluid responder (N=28) |
Non fluid responder (N=37) |
OR (95% KI) |
P value |
|
30-day rehospitalization |
4 (14.3%) |
4 (10.8%) |
0.727 (0.165–3.202) |
0,673 |
|
3-month rehospitalization |
2 (7.1%) |
8 (21.6%) |
3.586 (0.697–18.44) |
0,109 |
|
30-day death |
3 (10.7%) |
2 (5.4%) |
0.476 (0.074–3.063) |
0,426 |
|
3-month death |
5 (17.9%) |
7 (18.5%) |
1.073 (0.302–3.821) |
0,913 |
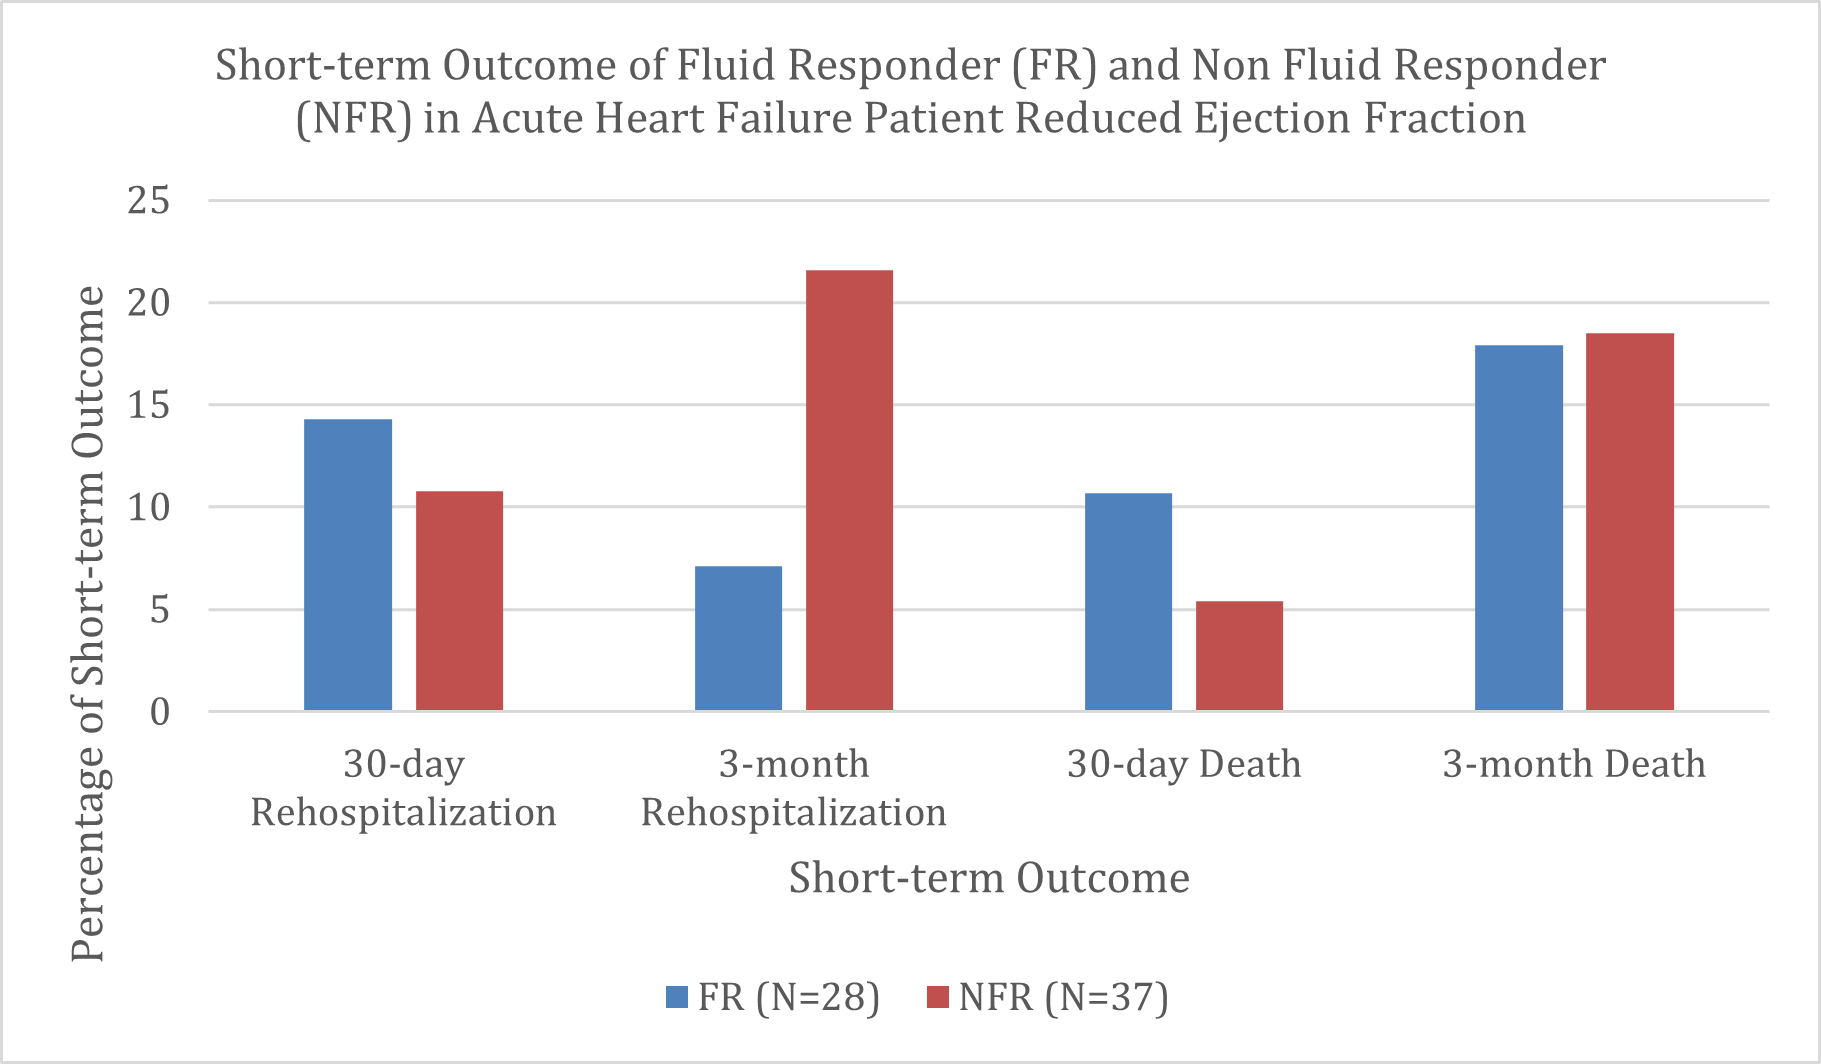
Figure 1. Short-term outcome on rehospitalization and death in the first 30 days and the first 3 month in patients with acute heart failure reduced ejection fraction.
Characteristics of rehospitalized and deceased patients
In the FR group, all patients rehospitalized within 30 days had ADHF. One patient with severe renal dysfunction (eGFR 21 mL/min/1.73 m²), leukocytosis (15,240/µL), and a high E-wave velocity (189 cm/s) died during rehospitalization. Another patient with an E/A ratio of 4.04 and an E/e′ of 31.7 survived beyond 30 days but died from an unspecified cause within three months. A third patient with severe anemia (hemoglobin 6.8 g/dL), leukocytosis (15,280/µL), and an E/A ratio of 2.7 died during rehospitalization within 30 days. The fourth patient had a TAPSE of 13 mm. All of these patients had pre-PLR VTI values of 9–10 cm and E/e′ values >14.
One FR patient was rehospitalized during the three-month follow-up with ADHF, an E-wave velocity of 80 cm/s, an E/e′ of 10.6, and a pre-PLR VTI of 16.2 cm, and remained alive at three months. Another patient, aged 74 years, with acute heart failure, TAPSE of 12 mm, LVEF of 20%, and E/e′ of 10.8, died at home during follow-up, with the cause of death undetermined.
In the NFR group, four patients were rehospitalized within 30 days. One patient with an eGFR of 48 mL/min/1.73 m² and an E/e′ of 23 died during rehospitalization within three months. Two additional patients—one with an E/e′ of 18.59 and another aged 70 years with LVEF of 20% and TAPSE of 11 mm—died during their first rehospitalization. A fourth patient, aged 73 years, with TAPSE of 14 mm, hemoglobin of 9.
Other patients who were rehospitalized and died within the 3-month period generally exhibited low TAPSE, elevated E/e′, and VTI values below 10 cm. In contrast, three patients who were rehospitalized but survived to three months shared similar characteristics: reduced TAPSE, impaired eGFR, and E/e′ values greater than 14.
Seeing the lack of a significant relationship between fluid responsiveness and the incidence of short-term rehospitalization and mortality in acute heart failure patients with reduced ejection fraction, a bivariate test was conducted to assess whether the outcomes of rehospitalization and mortality were influenced by other factors, such as CKD as comorbid and the initiation of GDMT or diuretics. Based on bivariate analysis, patients with fluid responsiveness (FR) had a 30-day rehospitalization rate of 14.3%, while the non–fluid responsive (NFR) group had a rate of 10.8%. Fisher’s Exact test results showed a p-value of 0.717 (Table 4), indicating that there is no significant relationship between fluid responsiveness status and the occurrence of rehospitalization within the first 30 days after treatment. For the 30-day mortality outcome, the FR group showed a mortality rate of 10.7%, while the NFR group had 5.4%. Fisher’s Exact test yielded a p-value of 0.717, leading to the conclusion that fluid responsiveness status is not significantly associated with the risk of mortality within the first 30 days. At the 3-month evaluation, rehospitalization occurred in 17.9% of the FR group and 27% of the NFR group. Although there was a tendency for a higher rehospitalization rate in the NFR group, the Chi-square test results showed a p-value of 0.385, indicating no significant relationship between fluid responsiveness and rehospitalization within the first 3 months. The 3- month mortality rate was 17.9% in the FR group and 18.9% in the NFR group. The Chi-square test results showed a p-value of 0.913, indicating no significant relationship between fluid responsiveness and mortality within the first 3 months.
|
Variables |
Categories (n) |
30-day rehospitalization (n,%) |
P value |
30-day death (n,%) |
P value |
3-month rehospitalization (n,%) |
P value |
3-month death (n,%) |
P value |
|
Fluid responsiveness |
FR (28) NFR (37) |
4 (14.3%) 4 (10.8%) |
0.717b |
3 (10.7) 2 (5.4) |
0.717 b |
5 (17.9) 10 (27) |
0.385a |
5 (17.9) 7 (18.9) |
0.913a |
|
CKD (GFR) |
GFR ≥ 60 (37) GFR < 60 (28) |
4 (10.8%) 4 (14.3%) |
0.717 b |
3 (8.1) 2 (7.1) |
1.000 b |
8 (21.6) 7 (25) |
0.749a |
6 (16.2) 6 (21.4) |
0.592a |
|
Beta-blocker |
Yes (43) No (22) |
5 (11.6%) 3 (13.6%) |
1.000 b |
3 (7) 2 (9.1) |
1.000 b |
10 (23.3) 5 (22.7) |
0.962a |
9 (20.9) 3 (13.6) |
0.737b |
|
ACE inhibitor |
Yes (27) No (38) |
3 (11.1%) 5 (13.2%) |
0.913 b |
2 (7.4) 3 (7.9) |
1.000 b |
3 (11.1) 12 (31.6) |
0.054a |
4 (14.8) 8 (21.1) |
0.747b |
|
ARB |
Yes (12) No (53) |
2 (16.7%) 6 (11.3%) |
0.634 b |
2 (16.7) 3 (5.7) |
0.227 b |
4 (33.3) 11 (20.8) |
0.449b |
3 (25) 9 (17) |
0.680b |
|
ARNI |
Yes (13) No (52) |
2 (15.4%) 6 (11.5%) |
0.655 b |
1 (7.7) 4 (7.7) |
1.000 b |
6 (46.2) 9 (17.3) |
0.059b |
4 (30.8) 8 (15.4) |
0.237b |
|
MRA |
Yes (46) No (19) |
5 (10.9%) 3 (15.8%) |
0.683 b |
3 (6.5) 2 (10.5) |
0.625 b |
11 (23.9) 4 (21.1) |
1.000b |
9 (19.6) 3 (15.8) |
1.000b |
|
SGLT2 inhibitorb |
Yes (4) No (61) |
1 (25%) 7 (11.5%) |
0.417 b |
1 (25) 4 (6.6) |
0.280 b |
1 (25) 14 (23) |
1.000b |
1 (25) 11 (18) |
0.567b |
|
Diuretic (dose) |
Low (≤ 80 mg) (59) Moderate-High (>80 mg) (6) |
7 (11.9%) 1 (16.7%) |
0.561 b |
4 (6.8) 1 (16.7) |
0.394 b |
10 (16.9) 5 (83.3) |
0.002b |
10 (16.9) 2 (33.3) |
0.305b |
Discussion
According to findings from the 2021 GUIDE-HF study, patients with acute heart failure who received pulmonary artery pressure monitoring demonstrated lower rehospitalization and mortality rates when their PA pressures were reduced, compared with those who had higher PA pressures—even within the first 30 days [8–10]. The 2024 MONITOR-HF study reported that patients with lower pulmonary artery pressures experienced reduced rates of rehospitalization and mortality compared with those with higher PA pressures, a finding consistent across patients with LVEF below 40% as well as those with LVEF above 40% [7,11,12]. Collectively, these studies suggest that patients discharged with lower filling pressure may experience more favourable outcomes than those with persistently elevated pressure. However, whether non-invasive markers of preload reserve-such as fluid responsiveness assessed by passive leg raising-reflect similar prognostic remains uncertain.
The concept of fluid responsiveness, based on Frank–Starling’s law, whereby stroke volume—reflected by VTI—is influenced by preload (ventricular wall stretch at end-diastole), myocardial contractility, and afterload (ventricular wall stress at end-systole) [19]. In the setting of impaired myocardial contractility, further increased in preload along the flattened portion of the Frank–Starling curve may fail to augment stroke volume and may even worsen hemodynamic, representing states of non-fluid responsiveness [13]. This conditions is associated with elevated left atrial and pulmonary vascular pressures, promoting pulmonary congestion. Within this framework, fluid responsiveness would be expected primarily when ventricular contractility remains sufficient and filling pressures have not yet reached levels that induce pulmonary backflow.
In the present study, 57% of patients with HFrEF were classified as non-fluid responsive, suggesting that a substantial proportion of patients were operating on the flattened portion of the Frank-Starling curve. Although left ventricular ejection fraction did not differ significantly between fluid responders and non-fluid responders, fluid responsiveness was still observed in a subset of patients. This may reflect heterogeneity in disease acuity, such as recent declines in ejection fraction, where additional preload may transiently augment stroke volume before filling pressures rise. Other contributing factors may include reduced cardiac output, impaired natriuresis or diuresis, and heightened peripheral vasoconstriction [19]. These observations underscore the complexity of interpreting fluid responsiveness in patients with reduced ejection fraction.
No association was observed between fluid responsiveness and biochemical laboratory parameters, including renal function. Prior studies have demonstrated that PLR can transiently mobilize approximately 150–300 mL of blood from the lower extremities to the central circulation without exogenous fluid administration, thereby increasing mean circulatory filling pressure [13,20]. On this basis, PLR has been proposed as a practical tool for assessing preload reserve even in patients with renal impairment. However, the absence of biochemical correlations in this study suggests that PLR-derived fluid responsiveness may capture physiological aspects not directly reflected by routine laboratory markers.
The similar distribution of NYHA functional class distribution between fluid responders and non-fluid responders suggests that fluid responsiveness is not strongly influenced by functional status alone. This finding aligns with observations by Miller’s et al [19]., who reported no consistent relationship between NYHA class and elevated left ventricular filling pressure.
In contrast, Sanchez et al. identified several hemodynamic variables associated with fluid responsiveness, including aortic blood pressure, cardiac output, cardiac index, stroke volume, and VTI [21]. The lack of such associations in the present study may be attributable to the predominance of impaired ventricular contractility in HFrEF, limiting preload responsiveness regardless of baseline hemodynamic measurements.
The therapeutic profiles were largely comparable between groups, indicating relatively uniform implementation of guideline-directed medical therapy (GDMT). More than half of all heart failure patients with reduced ejection fraction receive the GDMT, with the notable exception of SGLT2 inhibitors, whose limited use reflects restricted insurance coverage in Indonesia. Loop diuretic dosing was also similar between groups and generally modest (≤80 mg), consistent with findings from the CHAMPION trial, where diuretic doses dis not differ substantially between patients with varying pulmonary artery pressure. These similarities reduce confounding from treatment heterogeneity but may also limit the ability to detect outcome differences attributable to fluid responsiveness alone.
Based on the hypothesis that fluid responsiveness may reflect underlying filling pressures, this study explored its potential association with short-term clinical outcomes. Variables included in the logistic regression model were selected based on clinical relevance and prior literature rather than on bivariate significance. Given the limited number of outcome events, the regression model was considered exploratory, and the potential for overfitting and unstable estimates was acknowledged. While prior trials such as MONITOR-HF, CHAMPION HF, and GUIDE-HF demonstrated improved outcomes with pressure-guided therapy over longer follows-up period, these studies involved active therapeutic adjustment informed by invasive monitoring. In previous studies, follow-up periods ranged from 6 to 18 months, and interventions typically included adjustments to diuretic dosing and other GDMT based on pulmonary artery pressure monitoring [10–12,22]. In contrast, the present study evaluated patients after decongestion without subsequent intervention, which may partly explain the absence of outcome differences between fluid responders and non-fluid responders.
Our findings should be interpreted within the specific physiological framework of PLR-based fluid responsiveness, which reflects dynamic preload reserve rather than absolute filling pressures. Accordingly, caution is warranted when conceptually comparing PLR-based assessments with studies employing invasive pulmonary artery pressure–guided strategies, as these approaches are grounded in distinct physiological constructs. While pulmonary artery pressure–guided trials focus on static hemodynamic measurements to guide decongestive therapy, PLR assesses the heart’s functional response to a transient preload challenge.
No significant association was observed between fluid responsiveness and rehospitalization or mortality at either 30 days or 3 months. This finding should be interpreted cautiously, as short-term outcomes in acute heart failure are influenced by multiple factors beyond preload status, including disease chronicity, comorbidities, and post-discharge care. Moreover, the physiological effects of PLR are transient, and prior studies have questioned its consistency in predicting sustained hemodynamic or clinical benefit [26–28].
The review presented by Sondergaard states that PLR has less consistent physiological modelling in the cardiovascular system and does not show significant clinical benefits. Gaffney's study found that even in healthy individuals, the increase in stroke volume only lasts 30–45 minutes. Only 3% were able to increase the cardiac index 5 minutes after PLR (Wong). The study by Kyriakides et al. was able to show results consistent with the Frank-Starling curve in stable CAD patients, where PLR was able to increase preload, indicated by improved LVED dimensions, performance, and VTI, leading them to conclude that PLR can indeed enhance preload and cardiac performance [26–28]. When PLR cannot increase cardiac preload, heart performance is considered already poor and at risk for increasing the likelihood of rehospitalization and mortality.
This study has several limitations. First, the relatively small sample size and imbalance in outcome events between groups limit statistical precision and increase the risk of type II error. Second, no therapeutic interventions were guided by fluid responsiveness, precluding assessment of whether modifying treatment based on PLR findings could influence outcomes. Third, the study population included both patients with acute de novo heart failure and those with acute decompensated heart failure, whereas prior studies often focused on more homogenous populations. Finally, given the low statistical power (35%) and the low event rate, the findings of this study should be interpreted with caution. This study was not designed to draw definitive conclusions but rather to explore potential associations. These results should be considered hypothesis-generating and warrant confirmation in larger studies with longer follow-up and adequate power to validate these observations and to clarify the potential clinical role of PLR-assessed fluid responsiveness in HFrEF.
Conclusions
To the best of our knowledge, this is the first study to evaluate the relationship between fluid responsiveness and short-term outcomes—specifically rehospitalization and mortality—in patients with acute heart failure reduced ejection fraction. This study’s findings revealed no association between fluid responsiveness in patients with acute heart failure and reduced ejection fraction who had undergone decongestive therapy with rehospitalization or mortality at 30 days or 3 months after discharge.
Importantly, the relatively low post-hoc statistical power of the study limits the strength of inferential conclusions and increases the uncertainty surrounding the absence of observed associations. Therefore, the present findings should be interpreted within an exploratory framework, emphasizing observed patterns and directional consistency rather than definitive prognostic effects.
Rather than excluding a potential role of PLR-derived fluid responsiveness, these results primarily serve to generate hypotheses for future research. Larger studies with sufficient statistical power, longer follow-up, and integration of complementary hemodynamic or congestion markers are required to clarify whether fluid responsiveness has prognostic relevance in decongested HFrEF populations.
Acknowledgement
This study did not receive any specific grant from public, commercial, or non-profit funding agencies. The authors declare no known competing interests.
References
2. Tromp J, Bamadhaj S, Cleland JGF, Angermann CE, Dahlstrom U, Ouwerkerk W, et al. Post-discharge prognosis of patients admitted to hospital for heart failure by world region, and national level of income and income disparity (REPORT-HF): a cohort study. Lancet Glob Health. 2020 Mar;8(3):e411–22.
3. Andersen OS, Smiseth OA, Dokainish H, Abudiab MM, Schutt RC, Kumar A, et al. Estimating Left Ventricular Filling Pressure by Echocardiography. J Am Coll Cardiol. 2017 Apr 18;69(15):1937–48.
4. Nagueh SF, Smiseth OA, Appleton CP, Byrd BF 3rd, Dokainish H, Edvardsen T, et al. Recommendations for the Evaluation of Left Ventricular Diastolic Function by Echocardiography: An Update from the American Society of Echocardiography and the European Association of Cardiovascular Imaging. Eur Heart J Cardiovasc Imaging. 2016 Dec;17(12):1321–60.
5. Nagueh SF. Non-invasive assessment of left ventricular filling pressure. Eur J Heart Fail. 2018 Jan;20(1):38–48.
6. Nagueh SF, Middleton KJ, Kopelen HA, Zoghbi WA, Quiñones MA. Doppler tissue imaging: a noninvasive technique for evaluation of left ventricular relaxation and estimation of filling pressures. J Am Coll Cardiol. 1997 Nov 15;30(6):1527–33.
7. Brugts JJ, Radhoe SP, Clephas PRD, Aydin D, van Gent MWF, Szymanski MK, et al. Remote haemodynamic monitoring of pulmonary artery pressures in patients with chronic heart failure (MONITOR-HF): a randomised clinical trial. Lancet. 2023 Jun 24;401(10394):2113–23.
8. Lindenfeld J, Abraham WT, Maisel A, Zile M, Smart F, Costanzo MR, et al. Hemodynamic-GUIDEd management of Heart Failure (GUIDE-HF). Am Heart J. 2019 Aug;214:18–27.
9. Lindenfeld J, Zile MR, Desai AS, Bhatt K, Ducharme A, Horstmanshof D, et al. Haemodynamic-guided management of heart failure (GUIDE-HF): a randomised controlled trial. Lancet. 2021 Sep 11;398(10304):991–1001.
10. Zile MR, Mehra MR, Ducharme A, Sears SF, Desai AS, Maisel A, et al. Hemodynamically-Guided Management of Heart Failure Across the Ejection Fraction Spectrum: The GUIDE-HF Trial. JACC Heart Fail. 2022 Dec;10(12):931–44.
11. Givertz MM, Stevenson LW, Costanzo MR, Bourge RC, Bauman JG, Ginn G, et al. Pulmonary Artery Pressure-Guided Management of Patients With Heart Failure and Reduced Ejection Fraction. J Am Coll Cardiol. 2017 Oct 10;70(15):1875–86.
12. Angermann CE, Assmus B, Anker SD, Asselbergs FW, Brachmann J, Brett ME, et al. Pulmonary artery pressure-guided therapy in ambulatory patients with symptomatic heart failure: the CardioMEMS European Monitoring Study for Heart Failure (MEMS-HF). Eur J Heart Fail. 2020 Oct;22(10):1891–901.
13. Monnet X, Marik PE, Teboul JL. Prediction of fluid responsiveness: an update. Ann Intensive Care. 2016 Dec;6(1):111.
14. Cherpanath TG, Geerts BF, Lagrand WK, Schultz MJ, Groeneveld AB. Basic concepts of fluid responsiveness. Neth Heart J. 2013 Dec;21(12):530–6.
15. Desai N, Garry D. Assessing dynamic fluid-responsiveness using transthoracic echocardiography in intensive care. BJA Educ. 2018 Jul;18(7):218–26.
16. La Via L, Vasile F, Perna F, Zawadka M. Prediction of fluid responsiveness in critical care: Current evidence and future perspective. Trends Anaesth Crit Care. 2024 Feb 1;54:101316.
17. Jalil BA, Cavallazzi R. Predicting fluid responsiveness: A review of literature and a guide for the clinician. Am J Emerg Med. 2018 Nov;36(11):2093–102.
18. McDonagh TA, Metra M, Adamo M, Gardner RS, Baumbach A, Böhm M, et al. 2021 ESC Guidelines for the diagnosis and treatment of acute and chronic heart failure. Eur Heart J. 2021 Sep 21;42(36):3599–726.
19. Miller A, Mandeville J. Predicting and measuring fluid responsiveness with echocardiography. Echo Res Pract. 2016 Jun;3(2):G1–12.
20. Assadi F. Passive Leg Raising: Simple and Reliable Technique to Prevent Fluid Overload in Critically ill Patients. Int J Prev Med. 2017 Jul 4;8:48.
21. Alvarado Sánchez JI, Caicedo Ruiz JD, Diaztagle Fernández JJ, Cruz Martínez LE, Carreño Hernández FL, Santacruz Herrera CA, et al. Variables influencing the prediction of fluid responsiveness: a systematic review and meta-analysis. Crit Care. 2023 Sep 20;27(1):361.
22. Clephas PRD, Zwartkruis VW, Malgie J, van Gent MWF, Brunner-La Rocca HP, Szymanski MK, et al. Pulmonary artery pressure monitoring in chronic heart failure: effects across clinically relevant subgroups in the MONITOR-HF trial. Eur Heart J. 2024 Aug 21;45(32):2954–64.
23. Harjola VP, Follath F, Nieminen MS, Brutsaert D, Dickstein K, Drexler H, et al. Characteristics, outcomes, and predictors of mortality at 3 months and 1 year in patients hospitalized for acute heart failure. Eur J Heart Fail. 2010 Mar;12(3):239–48.
24. Ishihara S, Kawakami R, Nogi M, Hirai K, Hashimoto Y, Nakada Y, et al. Incidence and Clinical Significance of 30-Day and 90-Day Rehospitalization for Heart Failure Among Patients With Acute Decompensated Heart Failure in Japan - From the NARA-HF Study. Circ J. 2020 Jan 24;84(2):194–202.
25. Li D, Wang Y, Ze F, Zhou X, Li XB. Risk Predictors of 3-Month and 1-Year Outcomes in Heart Failure Patients with Prior Ischemic Stroke. J Clin Med. 2022 Oct 7;11(19):5922.
26. Søndergaard S. A critical review of the hemodynamics in assessment of volume responsiveness by using passive leg raising (PLR). Trends Anaesth Crit Care. 2023 Dec 1;53:101292.
27. Gaffney FA, Bastian BC, Thal ER, Atkins JM, Blomqvist CG. Passive leg raising does not produce a significant or sustained autotransfusion effect. J Trauma. 1982 Mar;22(3):190–3.
28. Kyriakides ZS, Koukoulas A, Paraskevaidis IA, Chrysos D, Tsiapras D, Galiotos C, et al. Does passive leg raising increase cardiac performance? A study using Doppler echocardiography. Int J Cardiol. 1994 May;44(3):288–93.