

Abstract
Background: The prevalence of overweight and obesity is increasing, despite options of prevention and treatment as diet, medication, and physical activity. Therefore, information about physical activity over several years on body weight and waist circumference for healthy adults in all ages is needed.
Objective: To estimate the association of physical activity and body weight and waist circumference for a healthy woman, aged 28–75 years.
Materials and methods: Self-reported data on physical activity, body weight, and waist circumference for a study period of 48 years. Data on the time spent on various physical activities are reported in minutes (min/week) and for energy expenditure in Metabolic Equivalent Task in hours/week (MET-hr/week). Body weight was recorded at least once per week and waist circumference one-two times per year. The association between body weight, waist circumference, and physical activity are measured by Pearson correlation coefficients.
Results: The average total time spent on physical activity across all age intervals shows 335 min/week and 37.0 MET-hr/week with cycling as the most performed physical activity. The average body weight decreased from 60.5 (SD 1.5) kg at age 28–30 years to 58.8 (SD 1.0) kg for 73–75 years. The waist circumference increased 6.0 cm during the 48 years study period. An inverse association between physical activity and body weight was seen with a statistically significant correlation coefficient of -0.3, whereas there did not appear to be an association between physical activity and waist circumference.
Conclusions: Higher activity level was to some extent associated with lower body weight, but not with waist circumference.
Keywords
Body weight, Healthy woman, MET, Physical activity, Waist circumference
Introduction
The prevalence of overweight and obesity among adults is still increasing worldwide, with above 53% [1], and increase risks for cardiovascular diseases (CVD), cancer, and type 2 diabetes [2]. The increase in overweight and obesity has been seen despite options of prevention and treatment as diet, medication, and physical activity have been recommended for decades.
The term physical activity is defined as any body movement that involves the muscles and requires energy expenditure [3]. Physical activity has shown beneficial effect in prevention of overweight and in decreasing body weight in adults [4,5]. The effects depend on activity types, intensity levels, and time spent on the activity [5]. The physical activity pattern is commonly quantified by combining weekly frequency, intensity, and time spent engaging in physical activity [6].
Physical activity has also shown beneficial effect on waist circumference in adults [7], although the underlying mechanism remains unclear [7]. Excess visceral adiposity contributes to increased risks of CVD and type 2 diabetes [8]. Su et al. [9] reported a positive correlation between waist circumference and both CVD morbidity and all-cause mortality in metabolically healthy individuals. The findings highlight the significance of routinely monitoring waist circumference for effective CVD risk management, regardless of metabolic health status [9].
According to Piercy & Troiano, only 26% of male and 19% of female Americans are meeting current physical activity guidelines [10].
Gutheld et al. reported that globally more than one in four persons do not meet recommended level of physical activity and this proportion is higher among women than men [3].
Updated World Health Organization (WHO) guidelines on physical activity for adults recommend at least 150–300 min/week (7.5 MET-hr/week) physical activity or 75 min/week of vigorous aerobic activity for adults aged 18–65 years and for adults aged >65 years the same recommendation combined with resistance exercises [11].
Based on a prospective cohort study among US healthy women consuming usual diet, Lee et al. reported, that physical activity in average 60 min/day was needed to maintain normal weight and to prevent body weight gain more than 2.3 kg [12].
Sims et al. reported that habitual high physical activity is associated with less weight gain in younger postmenopausal women. For older menopausal women habitual high physical activity is associated with less weight loss [13]. The change was explained by changes in the skeletal muscle size vs. fat mas [13].
Jakicic et al. reported strong evidence of an association between physical activity and weight gain in adults with the majority of evidence from prospective cohort studies. While people with increasing age were suggested lower effect compared to younger people [5].
Marques et al. reported that the prevalence of overweight and obesity were significantly higher in older, than in middle-age and younger adults [1]. In addition, retired people accounted for greater proportion of overweight and obesity, when compared with employed.
Recently, Eurostat reported in 2023 based on data between 2013 and 2023 that the share of the population aged ≥65 years in European Union (EU) has increased and absolute size of this population is expected to increase significantly in the coming decades [14].
The Aim
To estimate the association of physical activity with body weight and waist circumference for one healthy woman, aged 28–75 years.
Materials and Methods
Design
Data on physical activity, body weight, and waist circumference, collected from January 1978 to December 2025 on a single woman were analyzed in this retrospective study.
Subject
The data were self-reported by a Danish, healthy woman, consuming her usual diet and with the following socio-demographic characteristics at baseline: age 28 years; height 1.68 m; body weight 61.4 kg; calculated body mass Index (BMI) (kg/m2) 21.8; non-smoker; postgraduate education and full-time employed. During the study period, the subject was pregnant (1980–1981, 1983–1984) and retired from June 1st, 2020.
Measurements
Physical activity was recorded for five different activities: jogging, cycling, physical exercises, swimming, and dancing.
Jogging was defined as between 4–6 miles per hour (1 mile = 1.6 km) usually performed at 5–10 km trail at least twice weekly or in as official races with a total of 3 ´ 10 km races, 25 ´ 13.3 km races, 10 ´ half-marathon races (21.1 km) and in 1999 one marathon (42.3 km).
Pain located to the right hip appeared during jogging, which meant that jogging exercise decreased and was gradually replaced by cycling between January 2020 until jogging as exercise was ceased in December 31, 2020.
Cycling Outdoor cycling was performed on a bike, mostly on a 14 km daily tour all working days five days per week from 1980 to 2020. From March 2020 to December 2025 cycling was performed on an indoor bike with an average of 45 min per day.
Physical exercises were performed as: resistance exercises using a rubber band, stretching exercises and yoga for 10–15 minutes at least three times per week.
Swimming (breaststroke and crawl) was regularly performed one hour weekly between September 1st and May 31 from 1990 to 2025 except several weeks in 2020–2021 due to COVID-19 pandemic restrictions. Swimming during July and August was performed at the local beach or in a private pool.
Dancing was performed as folk dance for 90 minutes per week from September to May, 1978 to 1982.
Physical activity level
Data for the time spent at the five different physical activities were recorded in minutes per week (min/week) and for this study calculated in energy expenditure in Metabolic Equivalent Task in hours/week (MET-hr/week) [15] using the Ainsworth et al. classification [16]. The MET is classified as using the cut-offs suggested by Lee et al. as <7.5 MET-hr/week (equivalent to <150 min/week of moderate intensity; 7.5 – <21 MET-hr/week (equivalent to 150–420 min/week of moderate intensity) and ≥21 MET-hr/week (equivalent to ≥420 min/week of moderate intensity) [12].
Body weight
The body weight was measured in kilogram (kg) assessed either once or twice per week and at the same weekday(s).
Waist circumference
The waist circumference was self-measured by a tape-measure and measured in centimeters (cm) as morning assessment at least once per year.
Statistics
Statistical analysis is carried out using Microsoft Excel Office 2007 and R version 4.5.2 [17]. The results are analyzed and presented as mean and standard deviations (SD) for data on continuous scales. The associations between physical activity, body weight, and waist circumference were illustrated by scatterplots with corresponding smoothed curves and estimated Pearson correlation coefficients. The level of statistically significance is set to p <0.05.
Results
Data for a 48-years study period on physical activity (n = 1302), body weight (n = 3122) and waist circumference (n = 95) are presented in Table 1.
Physical activity
The overall average total physical activity was 335 (SD 93) min/weekly, the lowest activity level was 233 (SD 113) min/weekly in age interval 28–30 years, and the highest activity level was 406 (SD 78) min/weekly for age interval 46–48 years (Table 1).
|
Age interval, yr |
Physical activity Min/wa |
Body weight Kga |
Waist circumference cma |
|
28–30 |
233 (113) |
60.5 (1.5) |
72.1 (2.3) |
|
31–33 |
248 (91) |
59.6 (3.9) |
71.5 (5.0) |
|
34–36 |
251 (50) |
56.1 (1.3) |
66.7 (1.8) |
|
37–39 |
253 (67) |
57.0 (0.7) |
67.5 (3.5) |
|
40–42 |
322 (53) |
56.2 (1.6) |
NR |
|
43–45 |
336 (58) |
56.0 (1.0) |
67.0 (0.0) |
|
46–48 |
405 (78) |
56.2 (1.0) |
68.0 (1.4) |
|
49–51 |
365 (83) |
57.9 (1.2) |
70.3 (2.8) |
|
52–54 |
356 (79) |
57.7 (1.4) |
68.5 (2.5) |
|
55–57 |
364 (74) |
58.5 (1.1) |
70.0 (0.0) |
|
58–60 |
344 (96) |
58.4 (0.7) |
NR |
|
61–63 |
338 (99) |
58.3 (0.5) |
68.5 (1.4) |
|
64–66 |
335 (90) |
57.8 (0.8) |
71.5 (2.1) |
|
67–69 |
275 (114) |
57.9 (1.3) |
NR |
|
70–72 |
330(68) |
58.1 (1.3) |
NR |
|
73–75 |
335 (93) |
58,8 (1.0) |
72.7 (2.5) |
|
All intervals 28–75 |
335 (93) |
58.0 (0.3) |
70.9 (0.5) |
|
aMean; SD: Standard Deviation; Min/w: Minutes per week; kg: kilogram; cm: centimetres; NR: not recorded. |
|||
Figure 1 shows the average weekly physical activity per calendar year over the 48 years study period. It can be seen that total physical activity increased from approximately 250 min/week prior to 1985 to around 350 min/week from 1995 and onwards. There is a tendency to decreasing total physical activity from 2000 and onwards. Notably it can be seen that the COVID-19 in year 2020 has markedly lower total physical activity compared to adjacent calendar years.
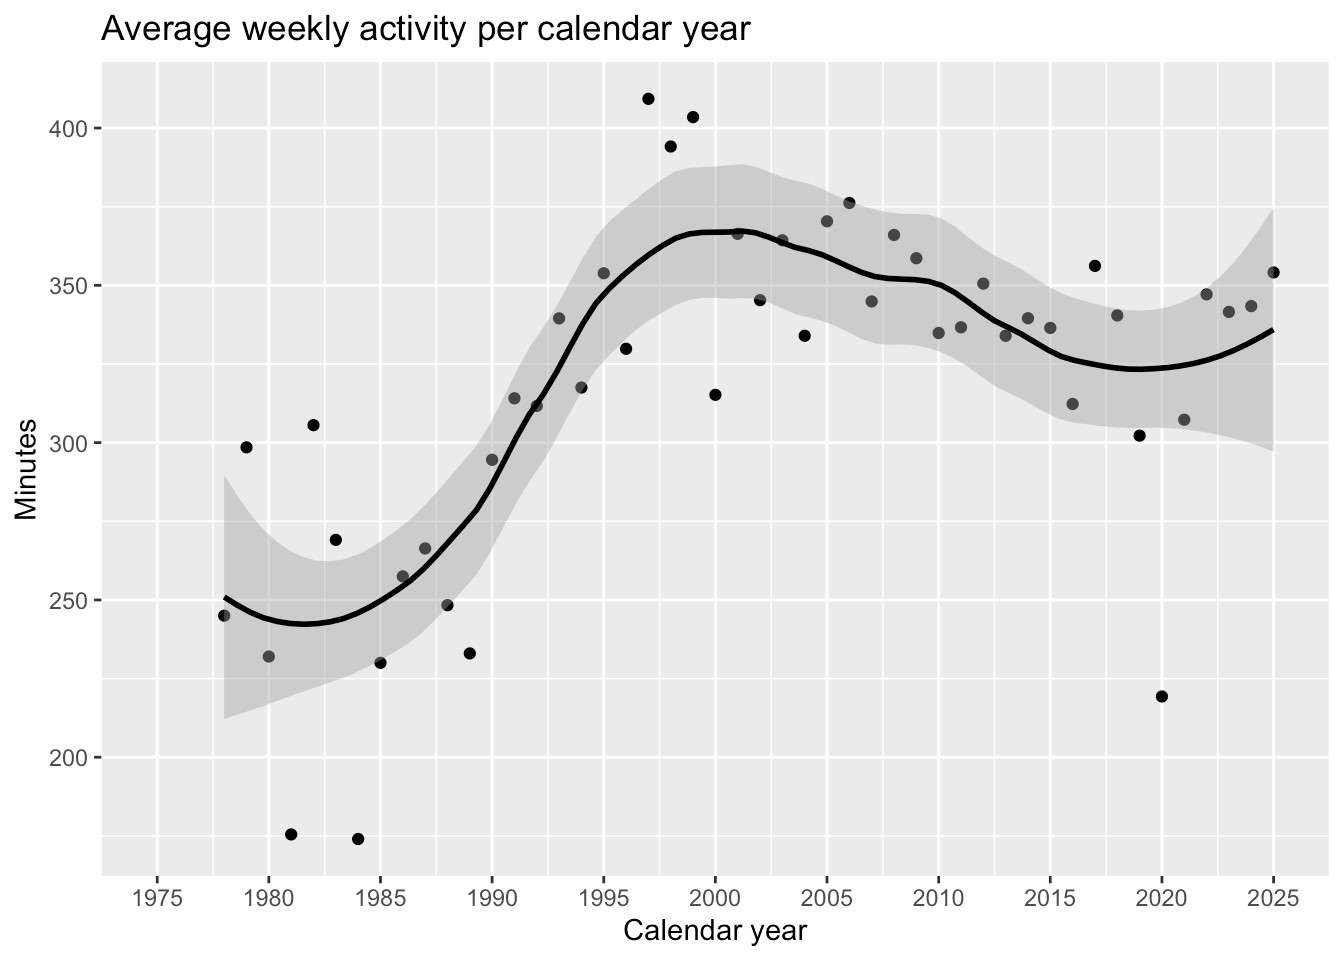
Figure 1. Shows the average weekly physical activity per calendar year over the 48 years study period.
Figure 2 shows the weekly physical activity per age interval, which shows the same pattern as for calendar time, i.e., the lowest activity level for age-interval 28–30 years (corresponding to the early calendar period).
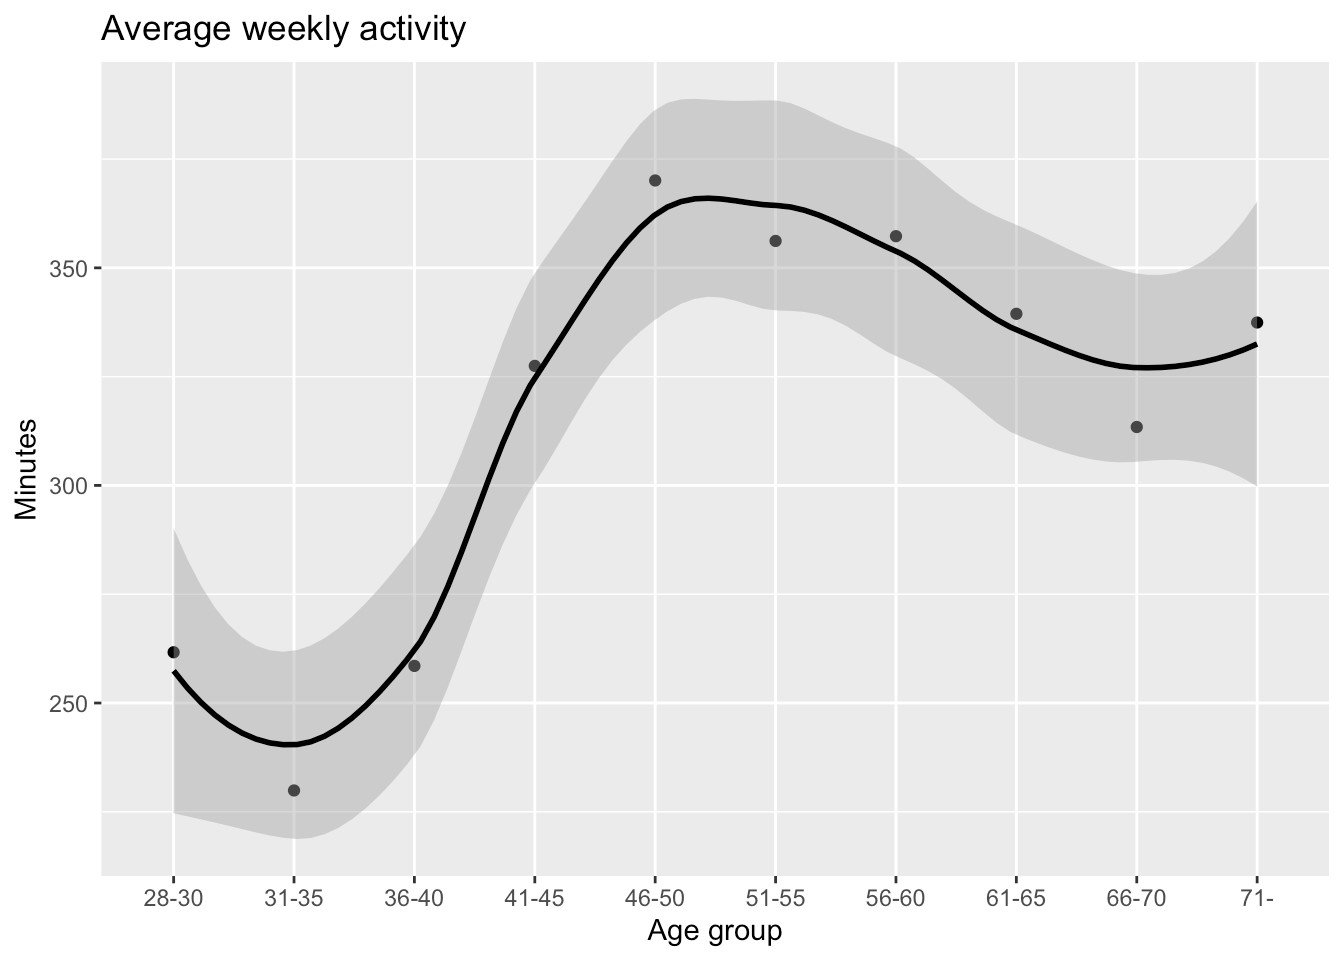
Figure 2. Shows the weekly physical activity per age interval.
Figure 3 shows the time spent on the five different activities per age interval. Overall, cycling was the most preferred physical activity.
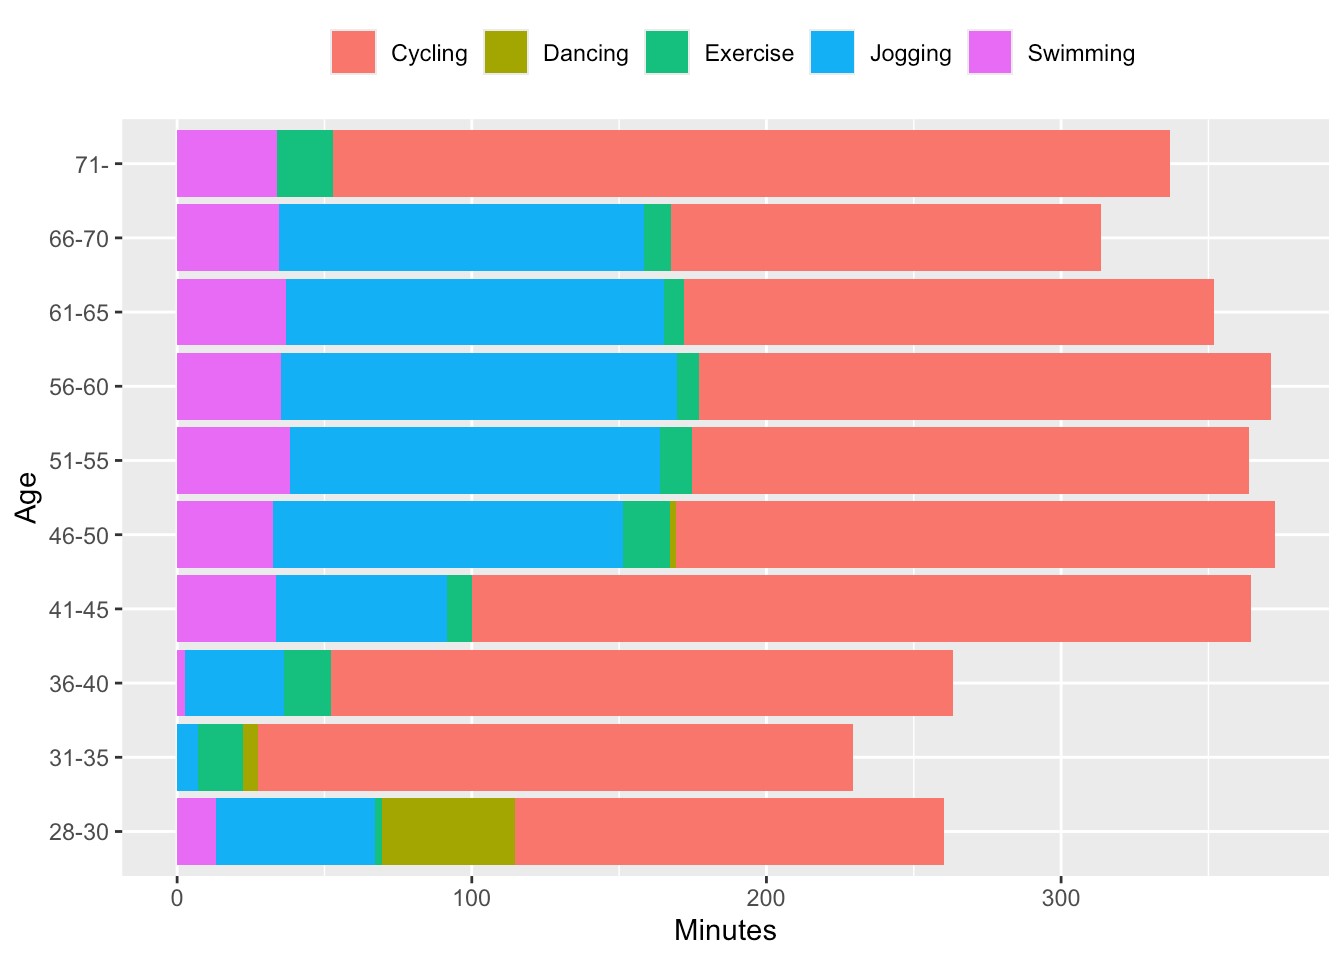
Figure 3. Shows the time spent on the five different activities.
Table 2 presents the time spent on the different activities calculated in MET-hr/ week indicating in mean 37.0 MET-hr week for all intervals. The highest value is 44.4 MET-hr/w for age interval 46–48 years and the lowest 24.5 MET-hr/week in age interval 28–30 years.
It is seen that MET-hr/week peaked in the period up to a marathon race in 1999.
|
Age Intervals, yr |
Jogging METca = 6.0 |
Cyclinga METca = 6.8 |
Physical exer. METca = 3.5 |
Swimming METca = 8.3 |
Dancing METca = 5.0 |
Total MET-hr/wa |
|
28–30 |
3.2 |
18.5 |
0.4 |
0.2 |
2.2 |
24.5 |
|
31–33 |
1.0 |
24.3 |
1.0 |
0.0 |
0.7 |
27.0 |
|
34–36 |
1.6 |
24.4 |
1.0 |
0.0 |
0.0 |
27.0 |
|
37–39 |
0.0 |
23.4 |
0.8 |
0.6 |
0.0 |
28.6 |
|
40–42 |
5.4 |
25.0 |
0.5 |
0.4 |
0.0 |
35.3 |
|
43–45 |
6.7 |
25.6 |
0.4 |
5.3 |
0.0 |
37.9 |
|
46–48 |
13.3 |
25.3 |
0.9 |
4.8 |
0.0 |
44.4 |
|
49–51 |
12.0 |
21.9 |
0.8 |
5.0 |
0.0 |
39.8 |
|
52–54 |
13.0 |
21.6 |
0.5 |
4.8 |
0.0 |
40,0 |
|
55–57 |
13.6 |
20.7 |
0.4 |
5.1 |
0.0 |
39.8 |
|
58–60 |
12.8 |
19.5 |
0.5 |
4.6 |
0.0 |
37.3 |
|
61–63 |
13.2 |
18.7 |
0.3 |
5.0 |
0.0 |
37.2 |
|
64–66 |
12.6 |
18.7 |
0.5 |
4.9 |
0.0 |
36.6 |
|
67–69 |
11.0 |
13.6 |
0.8 |
4.5 |
0.0 |
40.0 |
|
70–72 |
0.0 |
31.7 |
1.0 |
4.6 |
0.0 |
37.2 |
|
73–75 |
0.0 |
32.8 |
1.4 |
4.8 |
0.0 |
39.0 |
|
All intervals 28–75 |
11.0 |
22.8 |
0.7 |
4.4 |
0,3 |
37.0 |
|
MET: Metabolic Equivalent Task; METc: Metabolic Equivalent Task category. amean, hours per week. |
||||||
Body weight
The body weight per age interval is presented in Figure 4 and Table 1. The overall average body weight was 58.0 (SD 0.3) kg, the lowest average body weight was 56.0 (SD 1.0) kg in age interval 43–45 years and the highest average body weight was 60.5 (SD 1.5) kg in age interval 28-30 years due to pregnancy.
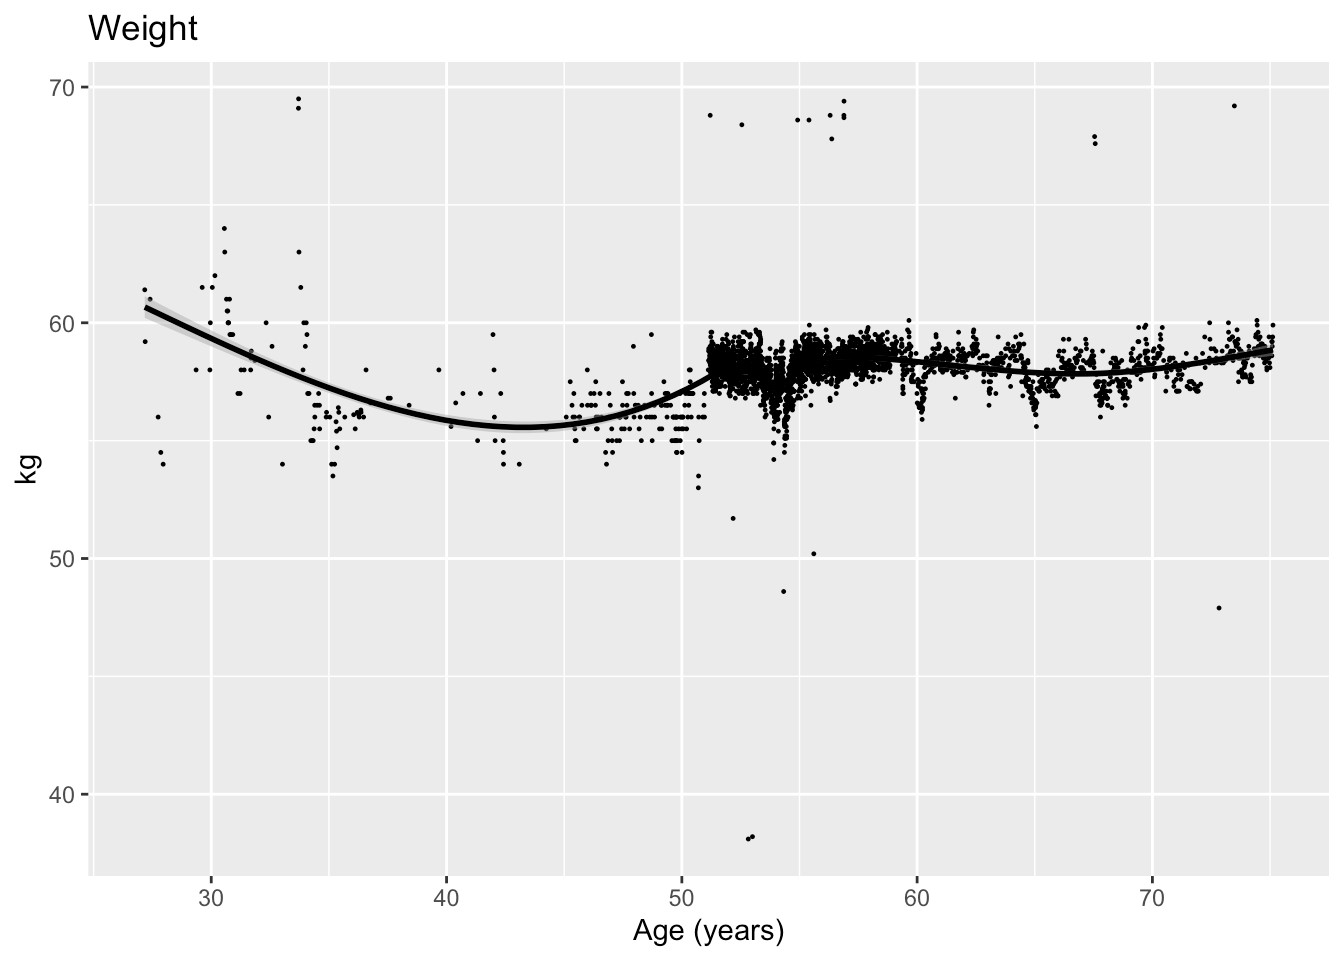
Figure 4. Shows the body weight per age interval.
Waist circumference
Figure 5 and Table 1 show the average waist circumference per age interval.
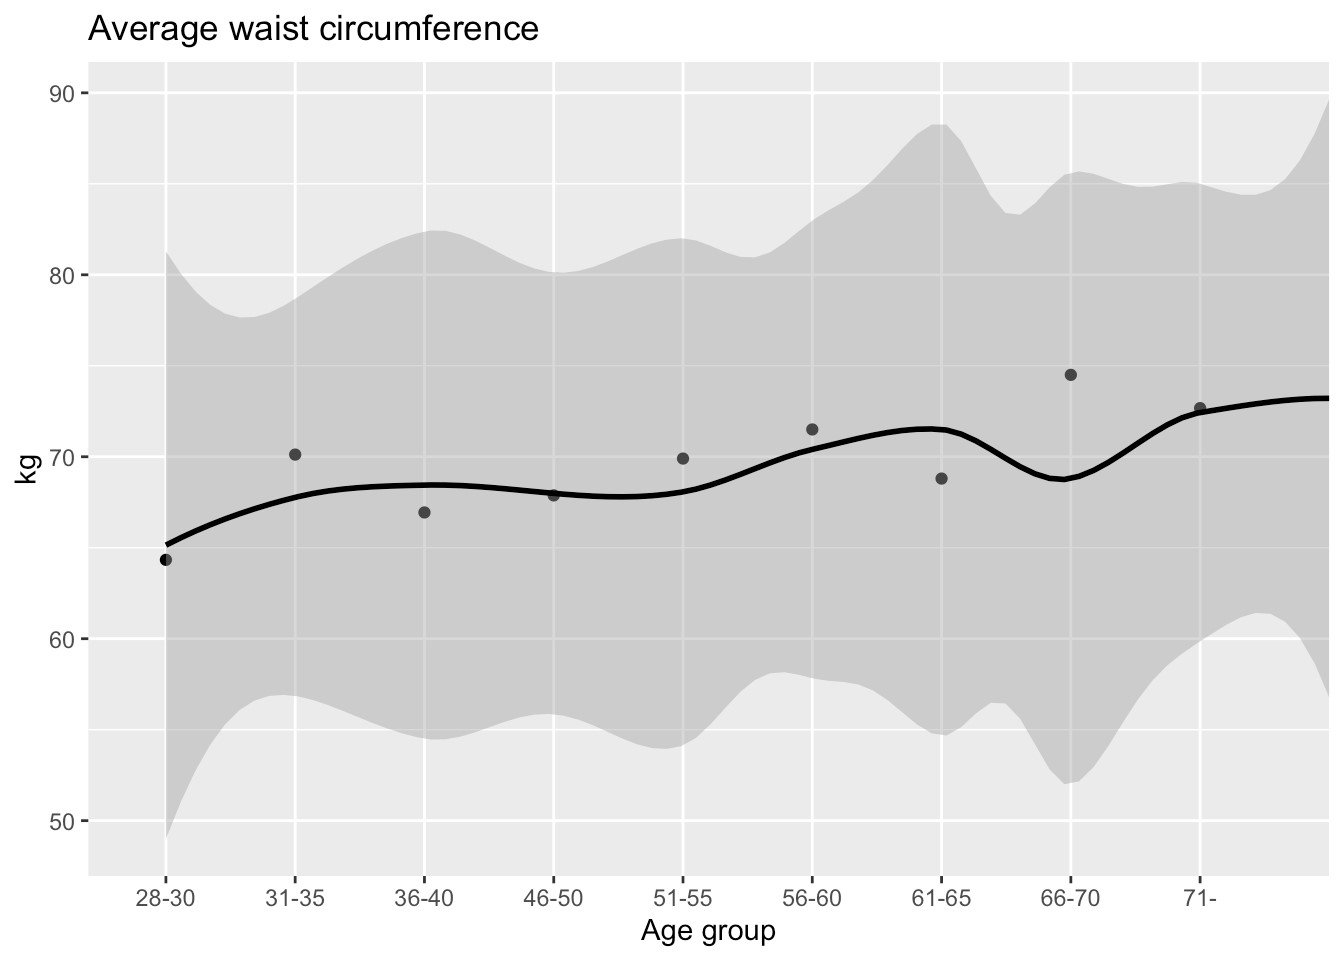
Figure 5. Shows the average waist circumference per age interval.
The smallest average waist circumference was 66.7 (SD 1.8) cm in age interval 34–36 years and the largest was 72.7 (SD 2.5) cm in age interval 73–75 years.
Figure 6 shows the associations between physical activity and body weight and waist circumference, respectively. An inverse association between physical activity and body weight was seen with a statistically significant correlation coefficient of -0.3, whereas there did not appear to be an association between physical activity and waist circumference. Body weight and waist circumference were as expected associated with a correlation coefficient of 0.5.
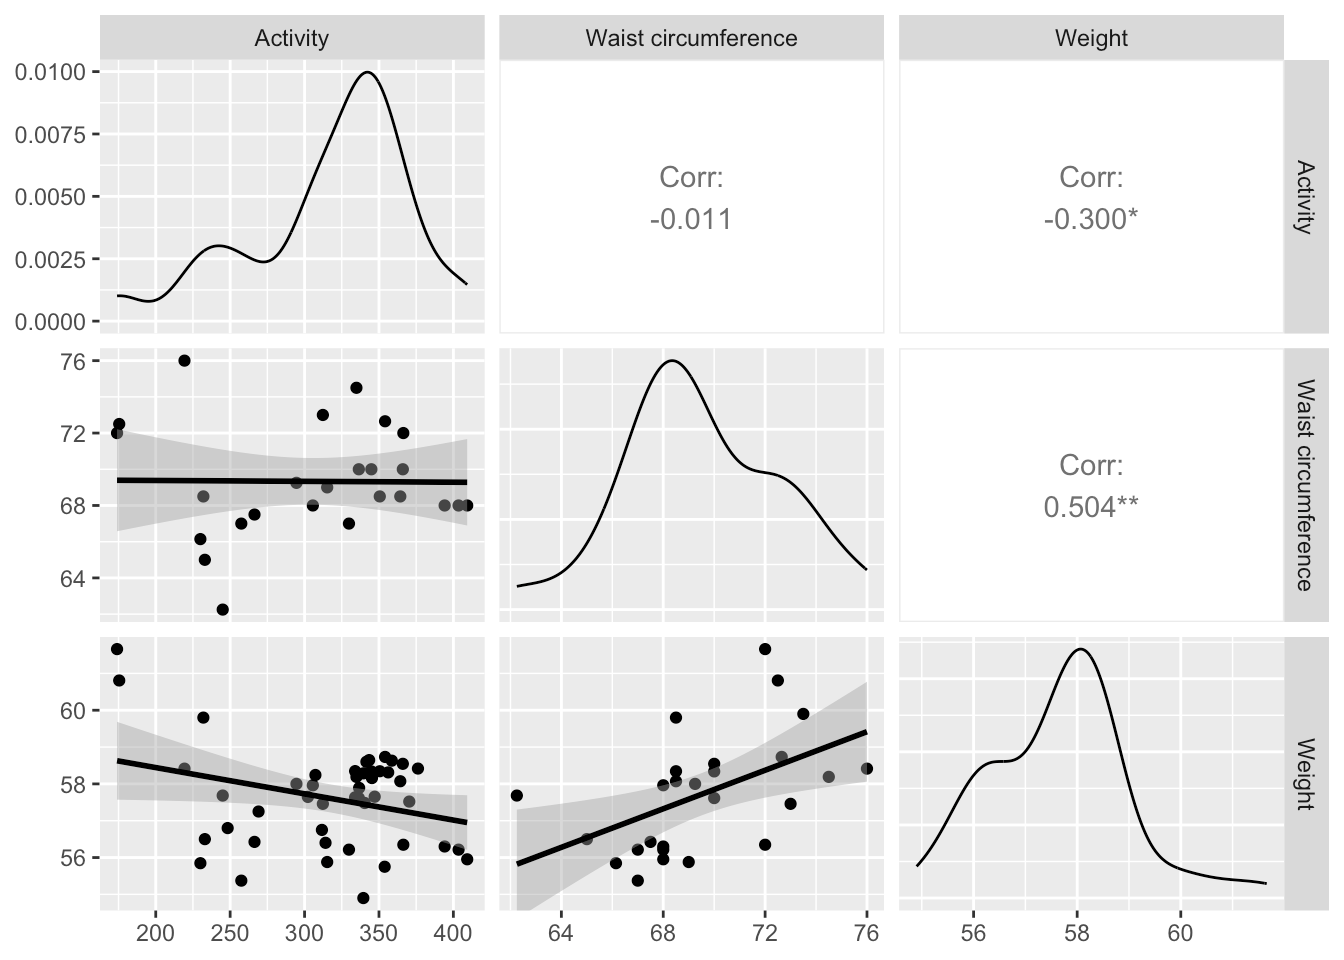
Figure 6. Shows the association between physical activity, body weight, and waist circumference.
Discussion
This retrospective study aimed to estimate the association of physical activity and body weight and waist circumference for a healthy woman, aged 28–75 years.
Physical activity
The results for all age intervals were above the recommended WHO guideline [11] of physical activity of 150–300 min/week and calculated 7.5 MET-hr/week. In this study cycling is the most preferred physical activity, quite in line with the culture of the country in which children start cycling at two years of age, later on cycle to school, job, and shopping.
For people living elsewhere influence factors as missing access to activity facility [18], lack of built environment for physical activity [19], poor support, especially for women, by family [20] and low socio-economic status [21]. Moreover, Macali et al. indicated that individuals with specific motivation and personality characteristics are more likely to demonstrate and engage in physical activity behaviors [22]. Likewise, Redondo-Florez-Florez et al., reported relationship between physical fitness and academic performance in university students [23].
Body weight
Regular self-weighing, particularly daily or weekly weighing, has shown body weight loss success intervention compared to less frequent weightings [24]. The weighting may motivate some individuals to focus on calorie intake or level of physical activity [24].
Hallock et al. indicated that diet together with physical activity showed larger effect on body weight loss than diet alone [24]. In this study, usual consuming diet was a premise or assumption but with an unknown effect.
Waist circumference
The mechanisms that underlie the effect of physical activity on waist circumference include a component of age changes in the skeletal muscle characteristics.
The natural process includes decrease in muscle mass and muscle quality with 30%–50% between the ages of 40 and 80 years [25,26]. However, changes at the waist muscles to fat and poor quality appears already at age 30 years compared to musculus recturs femoris at 50 years. Physical activity may have a protective effect against larger waist circumference like that Yue et al. observed in which a 1.45 times higher CVD prevalence for every 10 cm increase in waist circumference [9,26].
The mean of waist circumference presented in this study indicates that waist circumference with mean 6.0 cm in the same size during the 48 years period as well in normal for woman and did not increase.
Also, hormones in women indicated influence on waist circumference, but the mechanism remains unclear.
Methodological consideration’s
The main strengths of this study are the data from a 48-years study period with a high granularity in the description of physical activity. The data from this 48-years study period, provides insight information and knowledge to more effect on physical activity for long-term prevention and minimize body weight gain in one healthy woman. The detailed description of physical activity may potentially, motivate and guide individual women to create a personalized program based on different physical activities and adjusted to their age.
Limitations
The main limitation is that the study only involves one person, which implies that the reported data cannot be representative of healthy women or basis for conclusions about physical activity as long-term prevention or minimise body weight gain.
Conclusions
Across a 48-year study period on a single woman, time spent on five different physical activities, higher activity level was to some extent associated with lower body weight, but not with waist circumference.
Disclosure Status
No potential conflict of interest was reported by author.
Funding
The author reported that there is no funding associated when the work featured in this article.
References
2. Guh DP, Zhang W, Bansback N, Amarsi Z, Birmingham CL, Anis AH. The incidence of co-morbidities related to obesity and overweight: a systematic review and meta-analysis. BMC Public Health. 2009 Mar 25;9:88.
3. Guthold R, Stevens GA, Riley LM, Bull FC. Worldwide trends in insufficient physical activity from 2001 to 2016: a pooled analysis of 358 population-based surveys with 1·9 million participants. Lancet Glob Health. 2018 Oct;6(10):e1077–e1086.
4. Stehr MD, von Lengerke T. Preventing weight gain through exercise and physical activity in the elderly: a systematic review. Maturitas. 2012 May;72(1):13–22.
5. Jakicic JM, Powell KE, Campbell WW, Dipietro L, Pate RR, Pescatello LS, et al. Physical Activity and the Prevention of Weight Gain in Adults: A Systematic Review. Med Sci Sports Exerc. 2019 Jun;51(6):1262–69.
6. Hupin D, Roche F, Gremeaux V, Chatard JC, Oriol M, Gaspoz JM, et al. Even a low-dose of moderate-to-vigorous physical activity reduces mortality by 22% in adults aged ≥60 years: a systematic review and meta-analysis. Br J Sports Med. 2015 Oct;49(19):1262–7.
7. Armstrong A, Jungbluth Rodriguez K, Sabag A, Mavros Y, Parker HM, Keating SE, et al. Effect of aerobic exercise on waist circumference in adults with overweight or obesity: A systematic review and meta-analysis. Obes Rev. 2022 Aug;23(8):e13446.
8. Darsini D, Hamidah H, Notobroto HB, Cahyono EA. Health risks associated with high waist circumference: A systematic review. J Public Health Res. 2020 Jul 2;9(2):1811.
9. Su Y, Sun J, Zhou Y, Sun W. The Relationship of Waist Circumference with the Morbidity of Cardiovascular Diseases and All-Cause Mortality in Metabolically Healthy Individuals: A Population-Based Cohort Study. Rev Cardiovasc Med. 2024 Jun 13;25(6):212.
10. Piercy KL, Troiano RP, Ballard RM, Carlson SA, Fulton JE, Galuska DA, George SM, Olson RD. The Physical Activity Guidelines for Americans. JAMA. 2018 Nov 20;320(19):2020–28.
11. World Health Organization. Global recommendations on physical activity for health. Geneva: WHO; 2010. Available from: https://www.who.int/publications/i/item/9789241599979
12. Lee IM, Djoussé L, Sesso HD, Wang L, Buring JE. Physical activity and weight gain prevention. JAMA. 2010 Mar 24;303(12):1173–9.
13. Sims ST, Larson JC, Lamonte MJ, Michael YL, Martin LW, Johnson KC, et al. Physical activity and body mass: changes in younger versus older postmenopausal women. Med Sci Sports Exerc. 2012 Jan;44(1):89–97.
14. European Union. Population structure and ageing. Eurostat; 2023.
15. Rockhill B, Willett WC, Manson JE, Leitzmann MF, Stampfer MJ, Hunter DJ, Colditz GA. Physical activity and mortality: a prospective study among women. Am J Public Health. 2001 Apr;91(4):578–83.
16. Ainsworth BE, Haskell WL, Herrmann SD, Meckes N, Bassett DR Jr, Tudor-Locke Cet al. 2011 Compendium of Physical Activities: a second update of codes and MET values. Med Sci Sports Exerc. 2011 Aug;43(8):1575–81.
17. The R Core Team. R: A Language and Environment for Statistical Computing: Reference Index. Version 4.6.1 (2026-06-24). Vienna, Austria: R Foundation for Statistical Computing; 2025. Available from: https://cran.r-project.org/doc/manuals/r-release/fullrefman.pdf
18. Saito Y, Oguma Y, Inoue S, Tanaka A, Kobori Y. Environmental and individual correlates of various types of physical activity among community-dwelling middle-aged and elderly Japanese. Int J Environ Res Public Health. 2013 May 17;10(5):2028–42.
19. Omura JD, Carlson SA, Brown DR, Hopkins DP, Kraus WE, Staffileno BA, et al. Built Environment Approaches to Increase Physical Activity: A Science Advisory From the American Heart Association. Circulation. 2020 Sep 15;142(11):e160–6.
20. James DV, Johnston LH, Crone D, Sidford AH, Gidlow C, Morris C, et al. Factors associated with physical activity referral uptake and participation. J Sports Sci. 2008 Jan 15;26(2):217–24.
21. Rawal LB, Smith BJ, Quach H, Renzaho AMN. Physical Activity among Adults with Low Socioeconomic Status Living in Industrialized Countries: A Meta-Ethnographic Approach to Understanding Socioecological Complexities. J Environ Public Health. 2020 Apr 1;2020:4283027.
22. Macali IC, Smith L, Dale M, Lind E, DeShong HL, Holmes ME. Influences of motivation and personality on physical activity behavior: A systematic review . J Sports Sci. 2025 Mar;43(6):623–35.
23. Redondo-Flórez L, Ramos-Campo DJ, Clemente-Suárez VJ. Relationship between Physical Fitness and Academic Performance in University Students. Int J Environ Res Public Health. 2022 Nov 10;19(22):14750.
24. Hallock R, Ufholz K, Patel N. Self-Monitoring of Weight as a Weight Loss Strategy: A Systematic Review. Curr Cardiovasc Risk Rep. 2024 Nov;18(11):163–72.
25. Akima H, Kano Y, Enomoto Y, Ishizu M, Okada M, Oishi Y, et al. Muscle function in 164 men and women aged 20--84 yr. Med Sci Sports Exerc. 2001 Feb;33(2):220–6.
26. Ikezoe T. Age-Related Change in Muscle Characteristics and Resistance Training for Older Adults. Phys Ther Res. 2020 Dec 4;23(2):99–105.