Abstract
Background: Rheumatoid arthritis (RA) and Spondyloarthritis (SpA) are chronic inflammatory diseases characterized by joint inflammation and systemic involvement. Current diagnostic methods lack sufficient specificity and sensitivity, often leading to delayed or inaccurate diagnoses.
Objective: This study aims to utilize spatial transcriptomics and machine learning to identify differentially expressed genes (DEGs) and potential biomarkers associated with RA and SpA, enhancing our understanding of their molecular mechanisms.
Methods: High-dimensional spatial transcriptomics data and high-resolution tissue images from six synovial biopsy samples (three RA and three SpA) were analyzed. DEGs were identified using statistical criteria, and machine learning models were applied to classify disease status based on gene expression patterns. Functional enrichment analyses were performed to explore the biological significance of the identified DEGs.
Results: A total of 49 DEGs in SpA and 30 DEGs in RA were identified, all of which were upregulated. Key DEGs were further refined using feature selection methods. Machine learning models demonstrated moderate performance in classifying disease status, with the Light Gradient Boosting Machine (LGBM) model achieving the highest accuracy. Functional analyses indicated that the DEGs are predominantly involved in immune-related processes and cellular stress responses.
Conclusion: The study provides preliminary insights into the molecular mechanisms of RA and SpA, identifying potential biomarkers for further investigation. However, the limited sample size and lack of experimental validation necessitate caution in interpreting the results. Future studies with larger cohorts and experimental validation are required to confirm these findings and explore their clinical applicability.
Keywords
Rheumatoid Arthritis, Spondyloarthritis, Machine Learning, Diagnosis, Biomarker
Abbreviations
RA: Rheumatoid Arthritis; SpA: Spondyloarthritis; DEG: Differentially Expressed Gene; LGBM: Light Gradient Boosting Machine; SFS: Sequential Feature Selection; RFECV: Recursive Feature Elimination with Cross-Validation; CNN: Convolutional Neural Network; SVM: Support Vector Machine; AUC: Area Under the Curve; F1: F1 Score; GO: Gene Ontology; KEGG: Kyoto Encyclopedia of Genes and Genomes ; DO: Disease Ontology; UPR: Unfolded Protein Response;HDF5: Hierarchical Data Format; RNA-seq: RNA sequencing; SMOTE: Synthetic Minority Over-sampling Technique; SHAP: SHapley Additive exPlanations; ROI: Region of Interest; FC: Fold Change
Introduction
Rheumatoid arthritis (RA) and Spondyloarthritis (SpA) are chronic inflammatory diseases characterized by joint inflammation and varying degrees of systemic involvement. RA primarily affects the synovium, often leading to joint destruction and severe disability, while SpA includes diseases such as ankylosing spondylitis and psoriatic arthritis, impacting both axial and peripheral joints [1]. These conditions represent significant public health challenges, affecting millions worldwide and contributing substantially to the global burden of disability [2-4].
The pathophysiology of RA and SpA is complex, involving mechanisms such as autoimmunity, cytokine dysregulation, and aberrant immune responses [5,6]. Recent definitions have highlighted the need for advanced diagnostic tools and more targeted therapeutic approaches. Conventional methods for studying RA and SpA have been limited by insufficient specificity and sensitivity, often leading to delayed or inaccurate diagnosis [7-9].
Recent advances in transcriptomic technologies and machine learning have significantly transformed our understanding of these diseases. Techniques such as RNA sequencing (RNA-seq) and spatial transcriptomics have offered deep insights into the gene expression patterns within affected tissues, allowing for the identification of disease-specific cellular and molecular signatures [10,11]. Particularly, spatial transcriptomics has provided a nuanced view of gene expression within the context of tissue architecture, which is critical for understanding the complex interactions at the site of inflammation [12-14].
RA and SpA are both heterogeneous inflammatory diseases and there are continued endeavors to decipher the molecular mechanisms underlying these diseases using advanced complex approaches such as spatial transcriptomics and machine learning. These approaches allow for assembling of the map of disease-related gene expression profiles and also for investigation of cellular heterogeneity particularly in tissues, which opens news avenue for biomarker discovery and disease modeling. These approaches enable the identification of disease-relevant gene expression profiles at single-cell resolution, especially within tissues leading to new opportunities for biomarker identification and disease understanding. Developments in recent years have focused on the combination of spatial Transcriptomics with supervisors, to identify potential biomarkers for autoimmune diseases. For instance, investigating gene expression profiles of synovial tissues from RA patients using spatial transcriptomics revealed the upregulated immune-related pathways within the affected tissues [15]. Similarly, Zheng et al. [16] assessed differential gene expression (DEGs) in SpA specimens using spatial transcriptomics to establish specific pathophysiological processes at a cellular level.
Support Vector Machines (SVM) and Convolutional Neural Networks (CNN) have been used to improve the classification and prediction of autoimmune disease status using the transcriptome. The application of machine learning models in RA has also helped in the use of omics data to predict the disease prognosis [17]. However, there are several drawbacks like small sample sizes that can affect its findings. Nascimben [18] expanded about this problem as pathological for machine learning, and discussed possible remedies, such as cross-validation and synthetic data generation, particularly in relation to autoimmune diseases. In addition, Zhou et al. [19] also performed a systematic review on the challenges and possibilities of employing machine learning approaches to biomarker confirmation step in autoimmune diseases and the need for large and precise validation datasets. The review mentioned that since the major limitation was the small sample sizes, the use of multi-omics data integration and statistical methods can minimize these challenges and improve the prediction accuracy of RA and SpA [20].
Feng et al. [21] identified the gene expression profile using the spatial transcriptomics method of synovial tissues in SpA and observed that immune cell infiltration has comparatively worsened the disease which is agreed with our study. Similarly, Shulman et al. [22] used machine learning models trained from spatial transcriptomic data to predict disease activity in SpA, despite the noted drawbacks and limited sample size in their clinical studies [22].
Moreover, the integration of machine learning with transcriptomic has brought forward new approaches for diagnosis and finding therapeutic targets. Machine learning algorithms are also capable of processing large amounts of data and finding patterns that are not easily discovered through other means. It has been highly effective in distinguishing between different types of arthritis and exploring both individual and general biomarkers to create individual treatment plans [23-26].
This study aims to leverage cutting-edge transcriptomic technologies and machine learning to explore novel diagnostic and prognostic biomarkers, as well as potential therapeutic targets for RA and SpA, ultimately aiming to enhance patient outcomes through more precise diagnostics and targeted therapies.
Methodology
Data acquisition
The dataset comprises high-dimensional spatial transcriptomics data and high-resolution tissue images from 6 synovial biopsy samples: three from RA patients and three from SpA patients. These biopsies were obtained from knee or hip joints during orthopedic total replacement surgery. The data was originally collected by [10] and subsequently processed and made available by [27]. For each biopsy sample, the dataset provides normalized gene expression count data stored in Hierarchical Data Format (HDF5) files with the ‘.h5ad’ extension, containing a matrix of normalized expression values for each gene across multiple spatial locations within the tissue section. Additionally, high-resolution tissue images are provided, corresponding to the areas where spatial transcriptomics was performed. The dataset includes spatial coordinates for each spot where gene expression was measured, allowing the transcriptomic data to be mapped back to specific locations on the tissue image.
Data preprocessing
The preprocessing pipeline was designed to filter, annotate, and visualize spatial transcriptomics data against the backdrop of corresponding tissue sections. The primary purpose of this preprocessing was to label the samples as either infiltrated or non-infiltrated by immune cells, as this information was not originally present in the genetic dataset. This labeling is crucial for subsequent analyses of differential gene expression between infiltrated and non-infiltrated regions.
The input for this preprocessing step consists of normalized gene expression data in .h5ad format, high-resolution tissue images corresponding to the gene expression data, and spatial coordinates for each gene expression measurement spot. The goal is to label each sampling spot in the dataset as either ”infiltrated” or ”non-infiltrated” based on its location relative to regions of immune cell infiltration visible in the tissue images. The output is an annotated dataset where each gene expression measurement is labeled with its infiltration status, along with visualizations of these annotated regions.
The preprocessing steps were as follows:
- Region of Interest (ROI) Detection: Tissue images were subjected to grayscale conversion and thresholding techniques to isolate specific regions annotated for analysis. Contours delineating these regions were identified, scaled, and subsequently used to generate masks that isolated ROIs within the tissue images. Pixel coordinates within these ROIs were extracted for annotation to samples.
- Spatial Coordinate Transformation: Spatial coordinates from the transcriptomic data were converted to match the pixel coordinates of the tissue images, allowing for a direct comparison and overlay of gene expression data onto the tissue images. This transformation facilitated the identification of transcriptomic signals within the specified ROIs.
- Immune Cell Infiltration Sample Identification: Utilizing the ROI-specific pixel coordinates, samples within the black line marked regions were identified as infiltrated. These samples were flagged within the dataset for subsequent analysis.
- Data Annotation and Visualization: The final step involved the annotation of the processed spatial transcriptomics data with the infiltration status of each sample. Visualization tools were employed to generate plots displaying the spatial distribution of gene expression with overlays indicating ROIs and infiltrated regions.
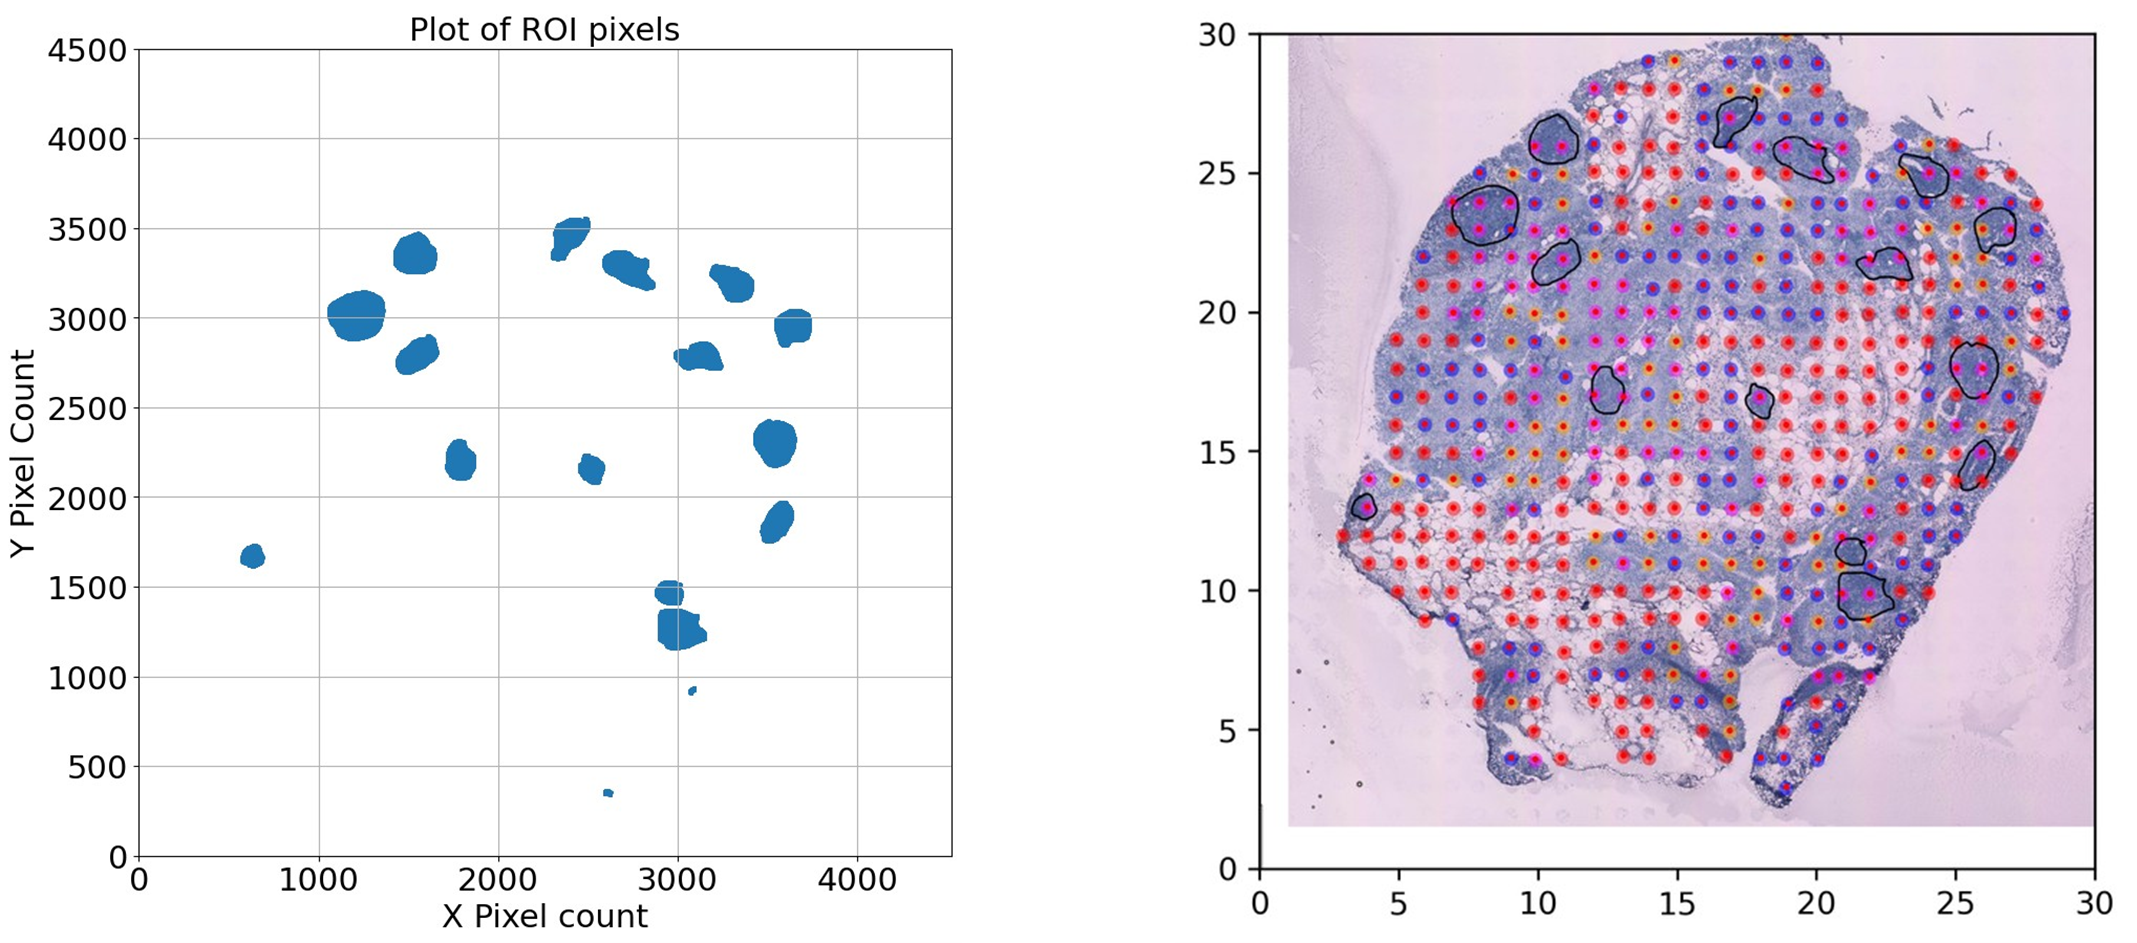
Figure 1. Region of Interest (ROI) detection and sample point mapping. (A) Scatter plot of pixels detected within the ROI after grayscale conversion and thresholding. These pixels are used to determine whether the position of a spatial sample lies within the ROI. (B) Tissue image overlaid with red dots representing sample points detected by our recognition program. The red dots correspond to spatial transcriptomic sampling spots, which are mapped to pixel coordinates to determine their location relative to the ROI. This mapping is essential for annotating each sample with infiltration status based on immune cell presence.
Identification of differentially expressed genes
Differentially expressed genes (DEGs) between RA and SpA samples and control samples were identified using the ‘limma’ package in R [28,29]. The selection criteria were adjusted P value <0.05 and |log2-fold change (FC)| >0.6. Volcano plots and heatmaps of DEGs were created using the ‘ggplot2’ and ‘pheatmap’ packages in R, respectively.
GO, KEGG, and DO enrichment analysis
The R packages ‘clusterProfiler’ [30] and ‘DOSE’ [31] facilitated the analyses of Gene Ontology (GO), including Biological Process, Molecular Function, and Cellular Component, as well as KEGG pathway and Disease Ontology (DO) assessments. For GO analysis, both unadjusted and adjusted p-value thresholds were established at less than 0.05. For the KEGG and DO analyses, the significance threshold was set at a p-value of less than 0.1.
Machine learning methodology
Feature selection: Robust feature selection methods were employed before model training to harness the full potential of our high-dimensional spatial transcriptomics data. We utilized Sequential Feature Selection (SFS), Lasso Regression, and Recursive Feature Elimination with Cross-Validation (RFECV) within Python to identify significant predictors. We incorporated the LogisticRegressionCV and RFECV modules from Python’s scikit-learn library for implementing Lasso Regression and RFECV. SFS was implemented using a custom-written algorithm in Python. Additionally, to explore the overlapping genes among SFS, Lasso Regression, and RFECV, we employed the venn3 function from Python’s matplotlib library to generate Venn diagrams. To further understand the impact of various features on model predictions, we applied the SHAP (SHapley Additive exPlanations) library in Python to conduct SHAP value analysis, revealing the relative importance of different features within the model [25].
- LASSO: This method imposes a penalty proportional to the absolute value of the regression coefficients, effectively reducing less significant feature coefficients to zero. It is particularly beneficial in scenarios with high multicollinearity or when simplifying the model’s interpretation by minimizing the number of predictor variables.
- RFECV: This technique iteratively removes features while building models and assessing accuracy via cross-validation. It aims to isolate a subset of features that most significantly predict the target variable, thereby enhancing computational efficiency and predictive accuracy. Specifically, RFECV utilizes the LGBM (Light Gradient Boosting Machine) model to ensure robust feature selection and model training.
- SFS: Unlike RFECV, which removes features, SFS adds them sequentially based on a specific criterion until no further improvements are seen in model performance. This approach is advantageous for models sensitive to feature interactions, as it carefully considers the effects of each new feature added to those previously selected. SFS is also implemented using the LGBM model, allowing for precise and effective feature integration.
Model training: After feature selection, we trained various machine learning models to classify disease status based on gene expression data. The models included:
- Convolutional Neural Networks (CNN): Implemented using TensorFlow and Keras libraries, the CNN model was trained on visualized gene expression images. Hyperparameters such as learning rate, batch size, and number of epochs were optimized using grid search. The input images were standardized, and data augmentation techniques were applied to enhance model robustness.
The CNN model was trained through a visualized image of the genes. The 5404 genes provided by the dataset were filled into a 74x74 image, each gene representing a pixel. The grey scale intensity of each pixel/gene, on a scale from 0-255, was mapped from the normalized expression count values provided by StomicDB [27]. Figure 2 is an example visualization of the image input into the CNN model. Each square on the figure represents the normalized count of a gene.
- Light Gradient Boosting Machine (LGBM): The LGBM model was implemented using the LightGBM library. We set the number of leaves to 31, the learning rate to 0.05, and used 100 boosting iterations. Early stopping was applied based on validation loss to prevent overfitting.
- Support Vector Machine (SVM): The SVM model was implemented using scikit-learn’s SVC class with a radial basis function (RBF) kernel. Hyperparameters such as the regularization parameter C and kernel coefficient γ were optimized using cross-validation.
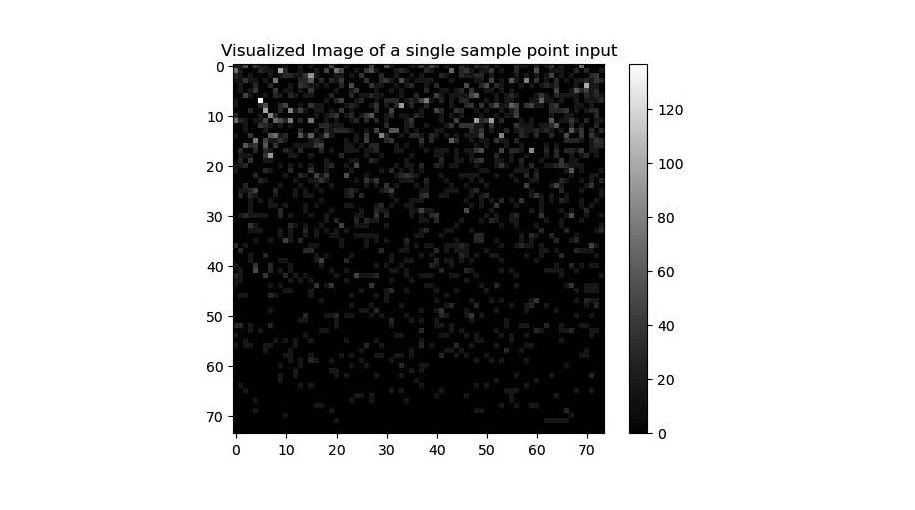
Figure 2. An example visualization of the image input into the CNN model.
Addressing Class Imbalance: Given the limited and potentially imbalanced dataset, we employed strategies to mitigate class imbalance effects. Techniques such as synthetic minority over-sampling (SMOTE) were considered, but due to the small sample size, we opted for stratified cross-validation to maintain the original class distribution in training and validation splits. Performance metrics were selected to account for imbalances, focusing on area under the curve (AUC) and F1 score, which provide a balanced assessment of model performance.
Model Evaluation: The final step involved evaluating each model’s performance, to ensure the robustness and generalizability of the predictive models. Metrics such as Area Under the Curve (AUC), accuracy, precision, sensitivity, and F1 score were computed to evaluate each model comprehensively.
Result
Result of SPA
DEGs between diseased and normal samples in SPA were screened with a criteria of p <0.05 and |logFC| >0.6. As depicted in the volcano plot in (Figure 3A), there were 49 DEGs identified between the two groups, all of which were upregulated. The corresponding heatmap is shown in (Figure 3B). Intersecting the DEGs identified by the LASSO model, RFECV, and SFS resulted in the Venn diagram shown in (Figure 3C), including XBP1, UBC, SSR4 and HLA-A. The descriptions of these four DEGs are listed in (Table 1).
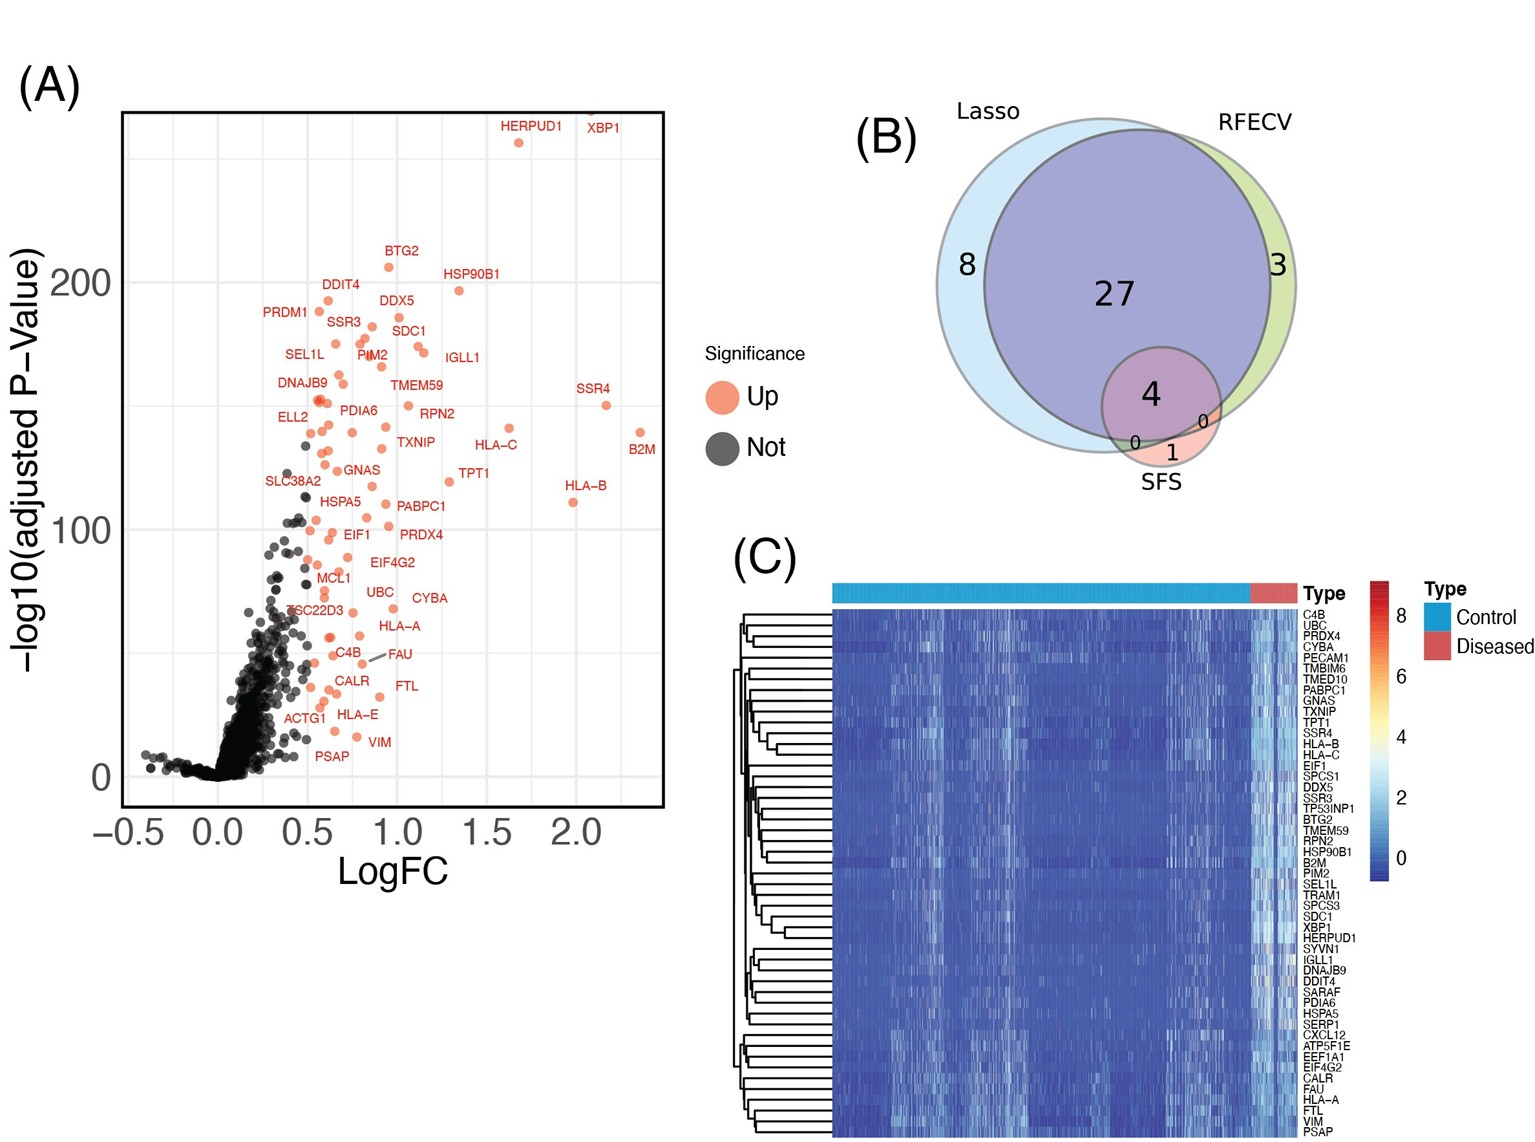
Figure 3. Identification of DEGs in SPA. (A) Volcano plot of all DEGs between SPA patients and healthy control groups. Red plots represent up-regulated genes with P <0.05 and logFC >0.6. There are no down-regulated genes, as all identified DEGs were upregulated. Black plots represent genes that are not differentially expressed. (B) Venn diagram showing the overlap of DEGs identified by the LASSO model, RFECV, and SFS. (C) Heatmap of all DEGs identified between SPA and control samples. The horizontal axis represents the samples, and the vertical axis represents the different genes; red indicates samples with differentially expressed genes.
SHAP summary plots were utilized to elucidate the roles of DEGs identified through various feature selection methods in assessing SPA risk. The DEGs identified by LASSO, RFECV, and SFS were systematically ranked based on their mean absolute SHAP values, highlighting the genes most significantly associated with increased SPA risk (Figures 4A, 4C, and 4E). Specifically, the top ten DEGs identified by LASSO included VIM, PSAP, HLA-A, DDX5, PIM2, C4B, DDIT4, ATP5F1E, SERP1, and HSP90B1, as shown in (Figure 4B). The RFECV method identified PSAP, VIM, HLA-A, PIM2, CALR, XBP1, DDX5, DDIT4, HSP90B1, and B2M as the principal genes (Figure 4D), while SFS highlighted XBP1, UBC, SSR4, HLA-A, and BTG2 as the most influential (Figure 4F). Genes with higher SHAP values were found to exert a greater impact on SPA, indicating their potential as critical biomarkers or therapeutic targets.
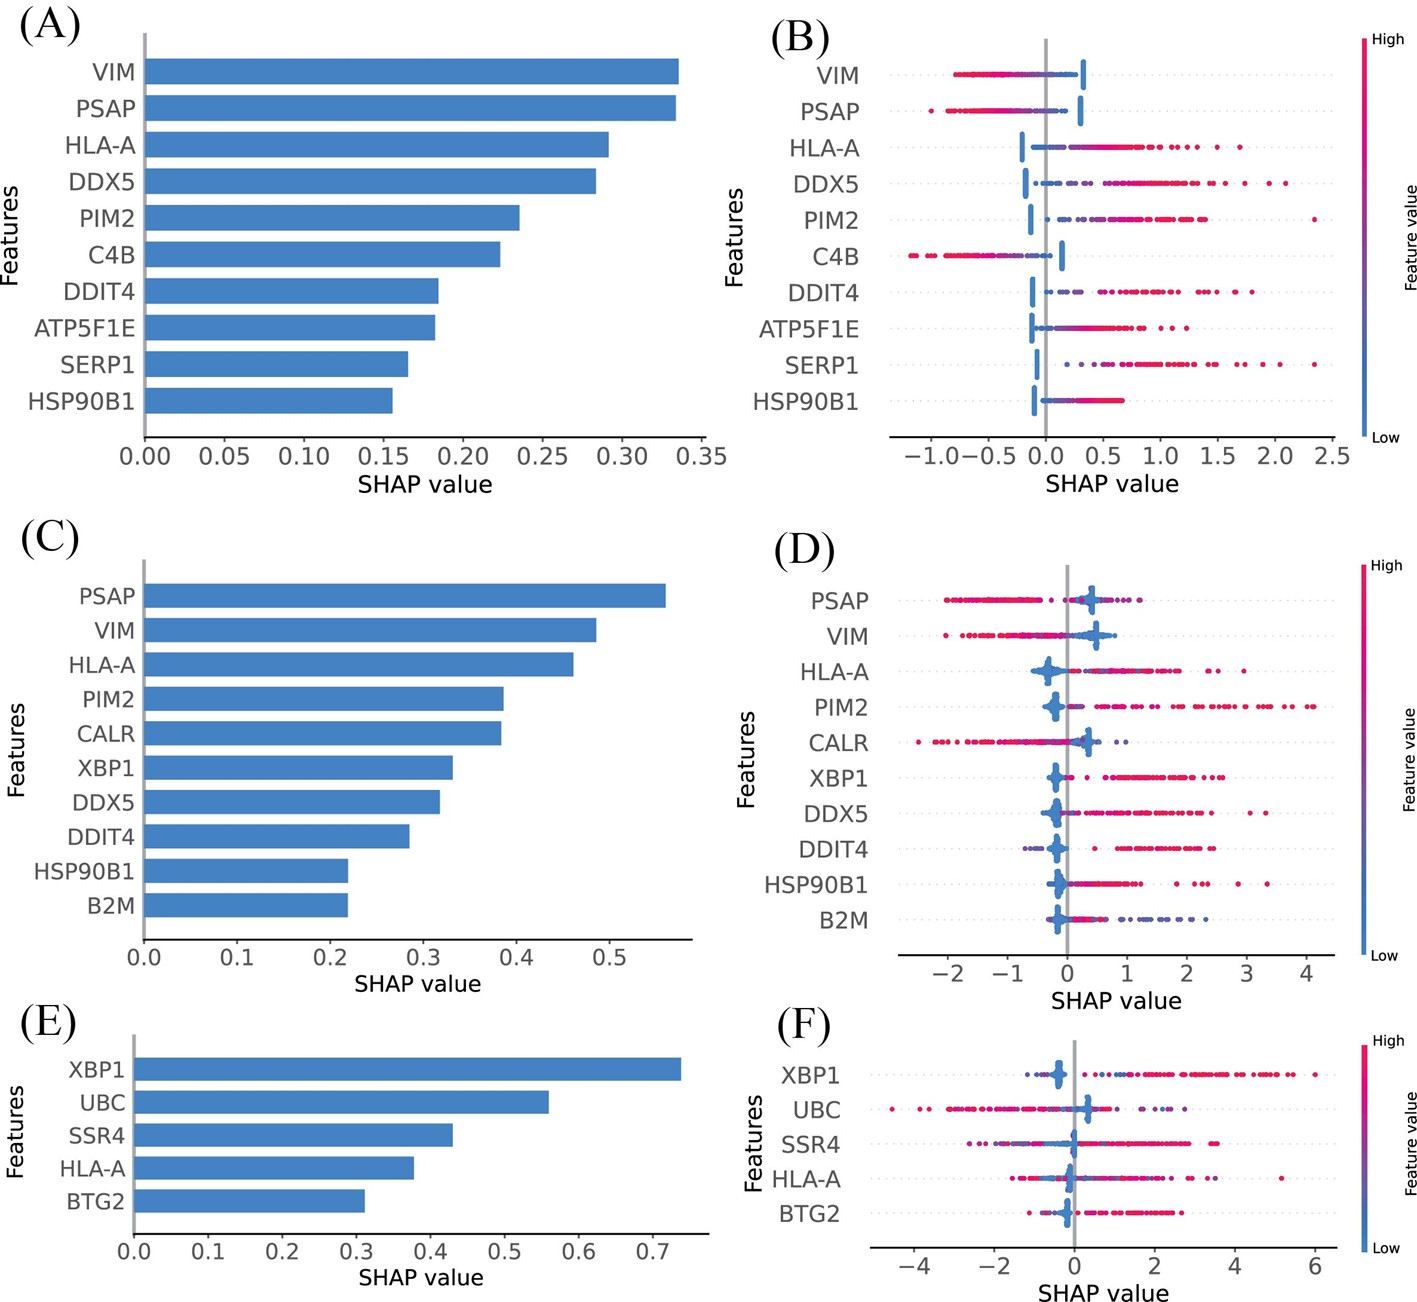
Figure 4. Model’s interpretation of SPA based on SHAP values across different feature selection methods. (A) The top 10 most important DEGs ranked according to the mean absolute SHAP values, identified using LASSO. (B) Ranking of the top 10 most impactful DEGs according to SHAP values using LASSO. Higher SHAP values indicate a higher risk associated with the gene. Red portions of feature values signify higher values, whereas blue indicates lower values. (C) Importance ranking of DEGs based on mean absolute SHAP values, identified using RFECV. (D) Ranking of the top 10 most impactful DEGs according to SHAP values using RFECV. Higher SHAP values indicate a higher risk associated with the gene. Red portions of feature values signify higher values, whereas blue indicates lower values. (E) Ranking of the top 10 most impactful DEGs according to SHAP values using SFS. (F) Ranking of the top 10 most impactful DEGs according to SHAP values using SFS. Higher SHAP values indicate a higher risk associated with the gene. Red portions of feature values signify higher values, whereas blue indicates lower values.
|
Gene Symbol |
Description |
|
XBP1 |
X-box binding protein 1 |
|
UBC |
Ubiquitin C |
|
SSR4 |
Signal sequence receptor subunit 4 |
|
HLA-A |
Major histocompatibility complex, class I, A |
Result of RA
DEGs between diseased and normal samples in RA were identified using a cutoff of p <0.05 and an absolute logFC greater than 0.6. As illustrated in the volcano plot (Figure 5A), a total of 30 DEGs were detected, all of which were upregulated. The corresponding heatmap is displayed in (Figure 5B). Additionally, the Venn diagram in (Figure 5C) shows the overlap of DEGs identified by the LASSO model, RFECV, and SFS, including VIM, TRAM1, FTL, ATP5F1E, TPT1, SARAF, FAU, B2M, and SSR4. The descriptions of these nine DEGs are listed in (Table 2).
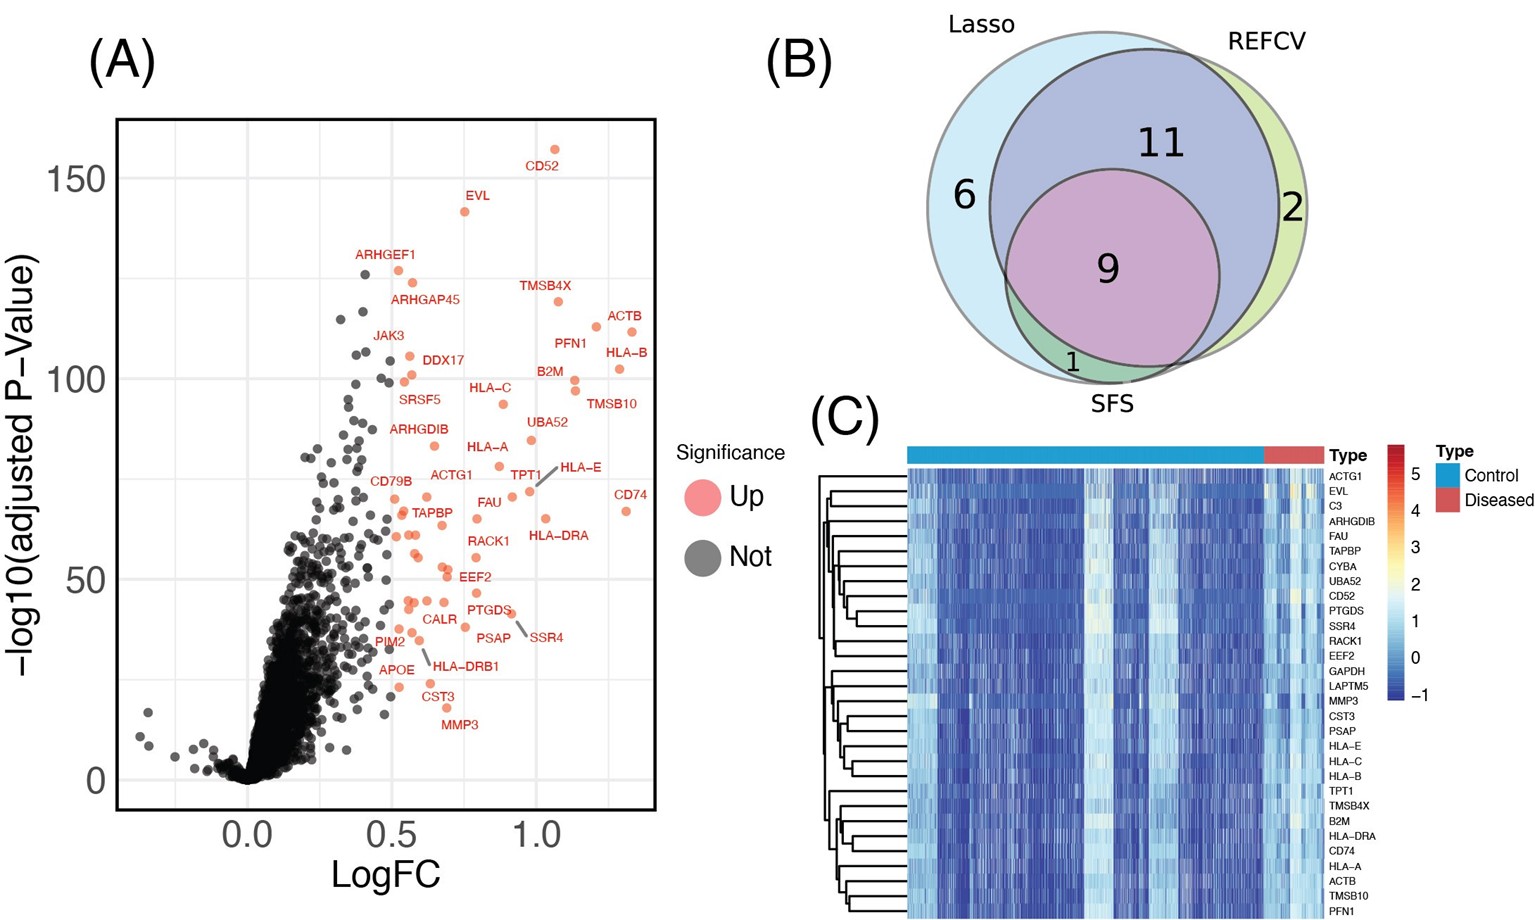
Figure 5. Identification of DEGs in RA. (A) Volcano plot of all DEGs between RA patients and healthy control groups. Red plots represent up-regulated genes with P <0.05 and logFC >0.6. There are no down-regulated genes, as all identified DEGs were upregulated. Black plots represent genes that are not differentially expressed. (B) Venn diagram showing the overlap of DEGs identified by the LASSO model, RFECV, and SFS. (C) Heatmap of all DEGs identified between RA and control samples. The horizontal axis represents the samples, and the vertical axis represents the different genes; red indicates samples with differentially expressed genes.
The SHAP summary plots were employed to elucidate the impact of DEGs identified through various feature selection methods, contributing to our understanding of their roles in RA. The DEGs identified by LASSO, RFECV, and SFS were ranked based on their mean absolute SHAP values, highlighting the genes most associated with increased RA risk (Figures 6A, 6C, and 6E). The top-10 mean SHAP values for LASSO, ranked from highest to lowest, included CST3, HLA-B, MMP3, CD52, PTGDS, EVL, TMSB4X, PFN1, HLA-E, and ACTB (Figure 6B). For RFECV, the top-10 leading genes were CST3, CD52, PFN1, HLA-E, EVL, SSR4, UBA52, MMP3, HLA-B, and TMSB4X (Figure 6D). SFS highlighted CD52, ACTB, FAU, EVL, MMP3, TMSB4X, SSR4, B2M, PTGDS, and HLA-C as the top influencers (Figure 6F). Genes depicted with higher SHAP values suggest a greater influence on RA.
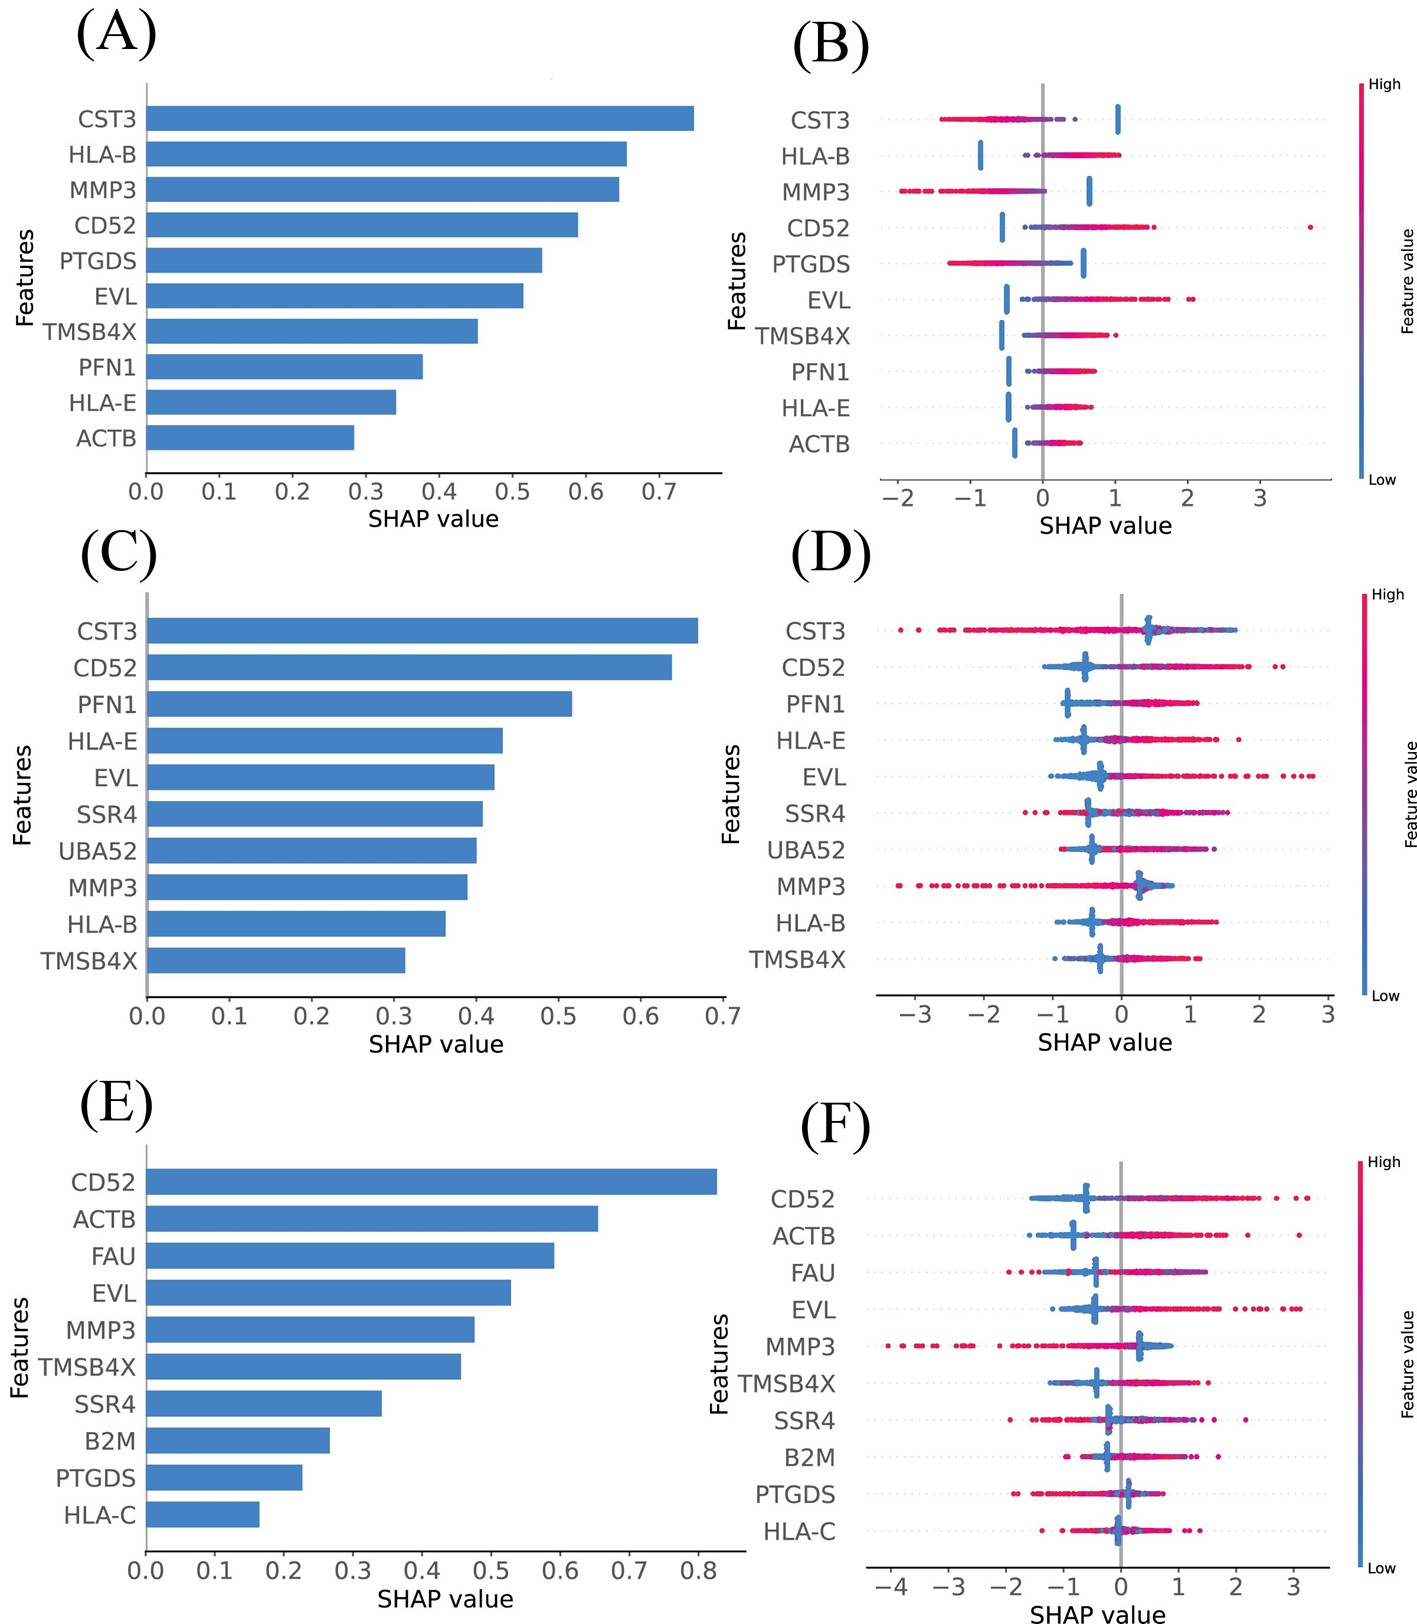
Figure 6. Model’s interpretation of RA based on SHAP values across different feature selection methods. (A) The top 10 most important DEGs ranked according to the mean absolute SHAP values, identified using LASSO. (B) Ranking of the top 10 most impactful DEGs according to SHAP values using LASSO. Higher SHAP values indicate a higher risk associated with the gene. Red portions of feature values signify higher values, whereas blue indicates lower values. (C) Importance ranking of DEGs based on mean absolute SHAP values, identified using RFECV. (D) Ranking of the top 10 most impactful DEGs according to SHAP values using RFECV. Higher SHAP values indicate a higher risk associated with the gene. Red portions of feature values signify higher values, whereas blue indicates lower values. (E) Ranking of the top 10 most impactful DEGs according to SHAP values using SFS. (F) Ranking of the top 10 most impactful DEGs according to SHAP values using SFS. Higher SHAP values indicate a higher risk associated with the gene. Red portions of feature values signify higher values, whereas blue indicates lower values.
|
Gene Symbol |
Description |
|
CD52 |
CD52 molecule |
|
ACTB |
Actin beta |
|
PTGDS |
Prostaglandin D2 synthase |
|
SSR4 |
Signal sequence receptor subunit 4 |
|
EVL |
Enah/Vasp-like |
|
MMP3 |
Matrix metallopeptidase 3 |
|
FAU |
FAU ubiquitin like and ribosomal protein S30 fusion |
|
B2M |
Beta-2-microglobulin |
|
TMSB4X |
Thymosin beta 4 X-linked |
The functional annotation of 4 DEGs for SPA was conducted using GO, KEGG, and DO enrichment analyses. The GO enrichment analysis demonstrated that these DEGs are primarily enriched in immune-related functions. Specifically, within the subset of Biological Processes (BP), the genes are mainly involved in T cell differentiation (Figure 7A). In the Cellular Component (CC) subset, enrichment was observed in the vesicle lumen (Figure 7B), and in the Molecular Function (MF) subset, the genes showed significant activity in immune receptor functions (Figure 7C). These findings highlight the critical role these genes play within the immune system, potentially influencing the development, communication, and response of immune cells. Additionally, the KEGG pathway analysis revealed significant enrichment in processes such as protein processing within the endoplasmic reticulum (ER), interactions with Kaposi sarcoma-associated herpesvirus, and the pathophysiology of Parkinson’s disease, among other neurodegenerative disorders. The analysis also highlighted pathways related to immune-related disorders including allograft rejection, Type I diabetes mellitus, graft-versus-host disease, and autoimmune thyroid disease. Furthermore, the DO enrichment analysis demonstrated that the differentially expressed genes were associated with a range of diseases such as multiple myeloma, vulva cancer, myeloid neoplasms, borna disease, bone marrow cancer, fibrous histiocytoma, and histiocytoma, underscoring their potential implications in diverse pathological conditions.
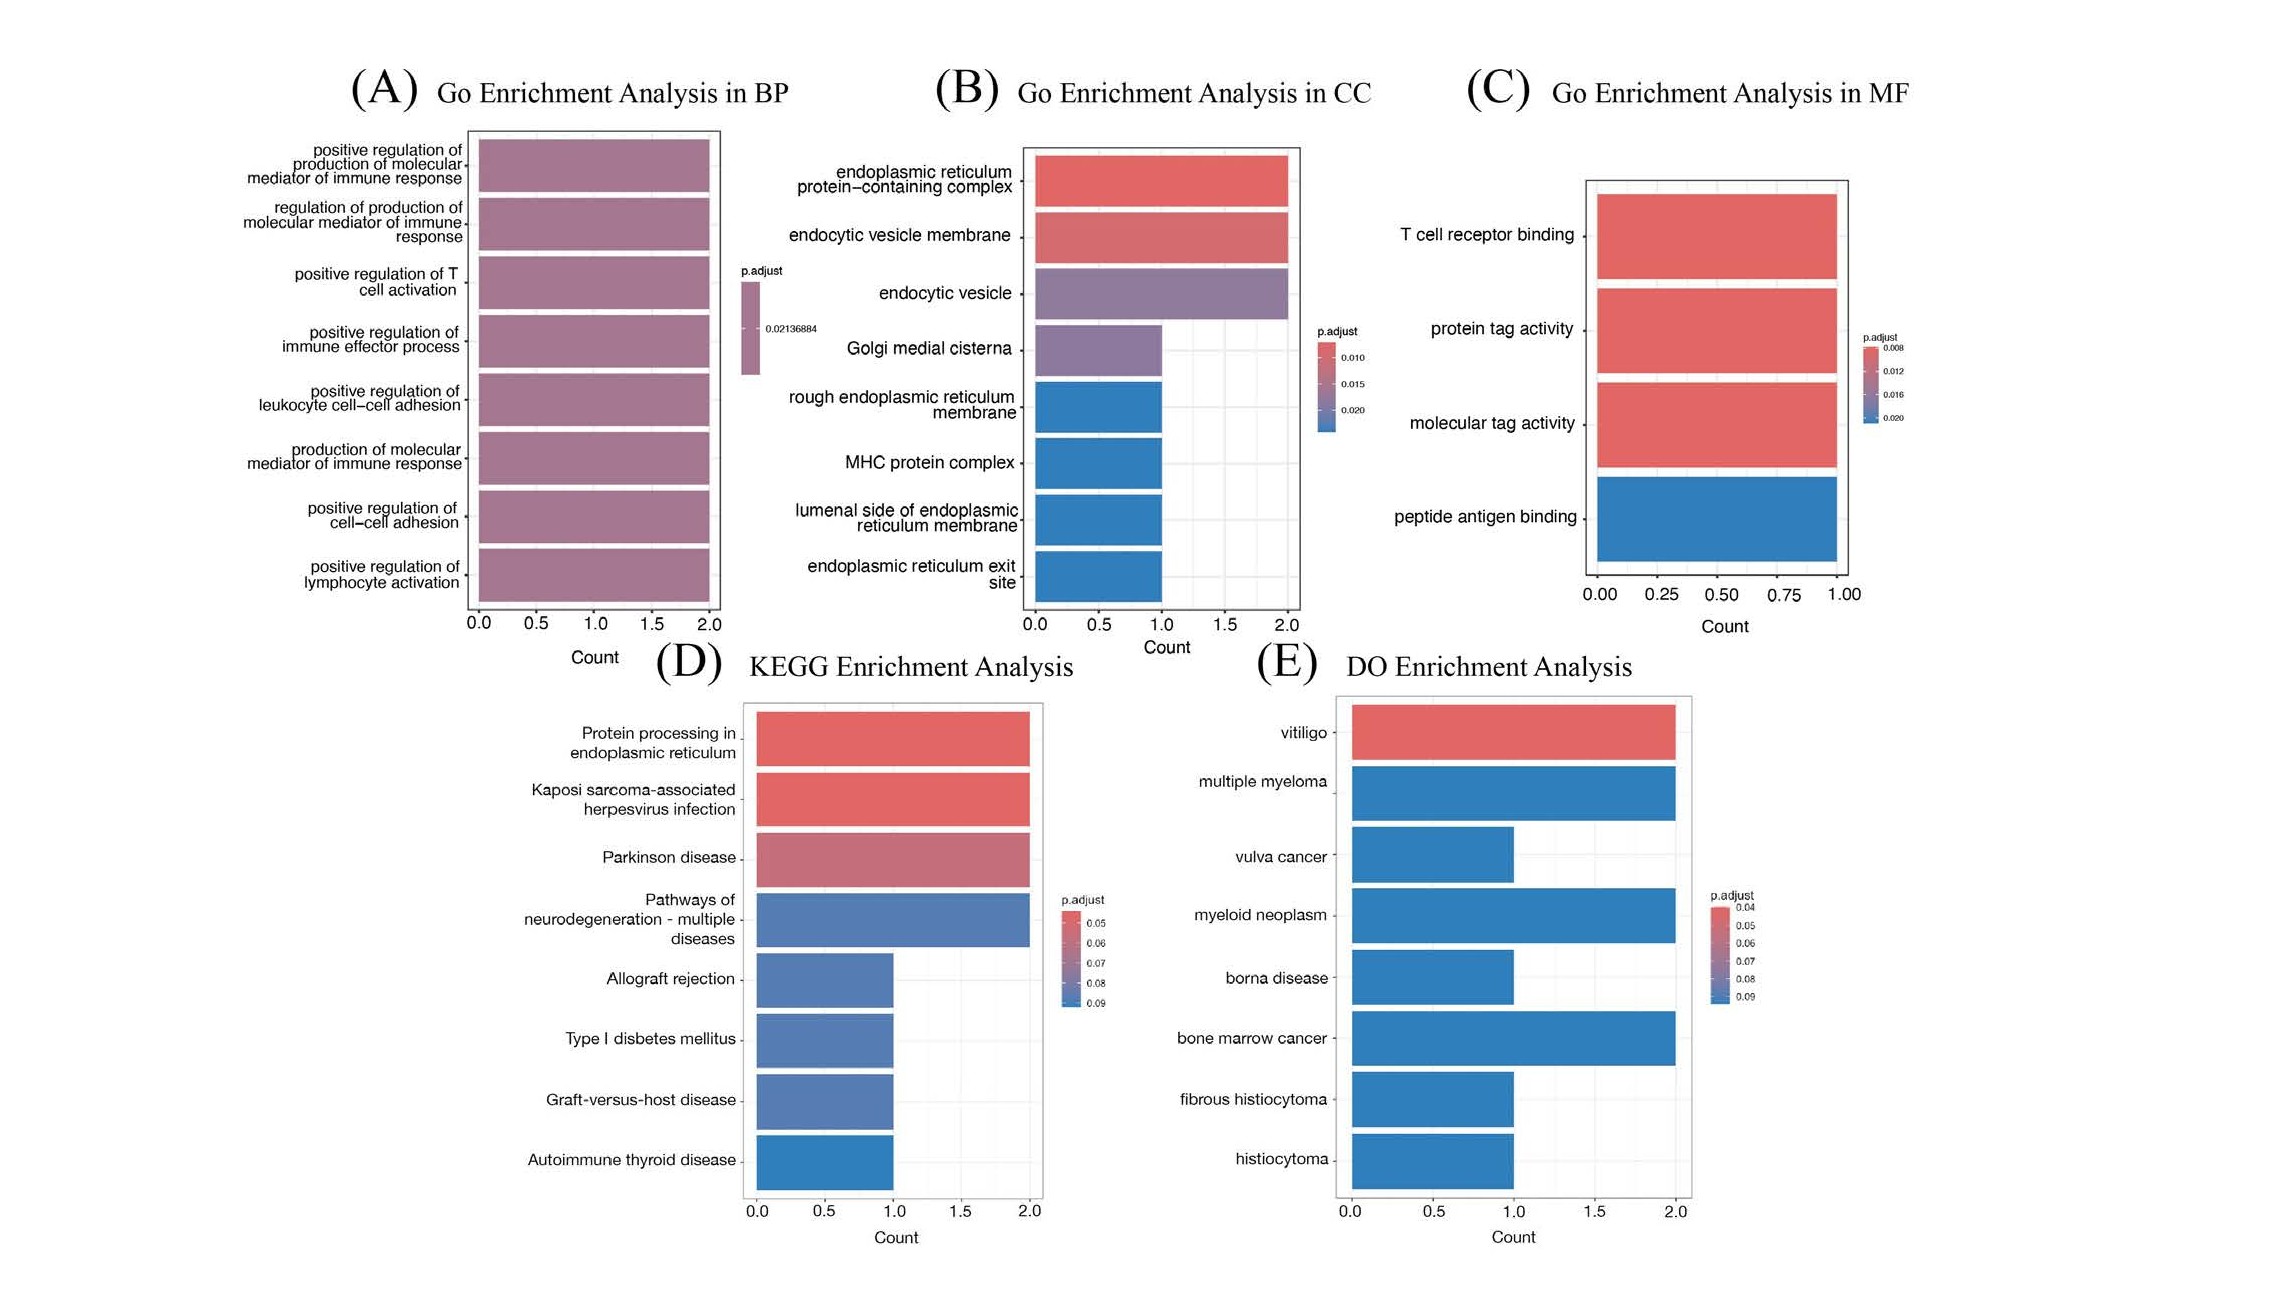
Figure 7. GO, KEGG, and DO enrichment analysis for SPA. (A) GO enrichment analysis in BP of the 4 DEGs. (B) GO enrichment analysis in CC of the 4 DEGs. (C) GO enrichment analysis in MF of the 4 DEGs. (D) KEGG enrichment analysis of the 4 DEGs. (E) DO enrichment analysis of the 4 DEGs.
GO, KEGG, and DO enrichment analysis
The 9 DEGs for RA underwent functional annotation through GO, KEGG, and DO enrichment analyses. The results revealed that these DEGs are predominantly enriched in immune-related functions. Specifically, they are involved in the negative regulation of binding within the BP category (Figure 8A), localized to the rough ER in the CC category (Figure 8B), and associated with profilin binding in the MF category (Figure 8C). In addition, the significantly enriched KEGG pathways included Rap1 signaling pathway, regulation of actin cytoskeleton, coronavirus disease - COVID-19, Vibrio cholerae infection, arachidonic acid metabolism, viral myocarditis, gastric acid secretion, and bacterial invasion of epithelial cells (Figure 8D). Finally, the DEGs were closely related to various diseases as per the DO analysis, including carotid artery disease, Moyamoya disease, cerebrovascular disease, amyloidosis, intracranial arterial disease, cerebral arterial disease, osteoarthritis, and bone sarcoma (Figure 8E).
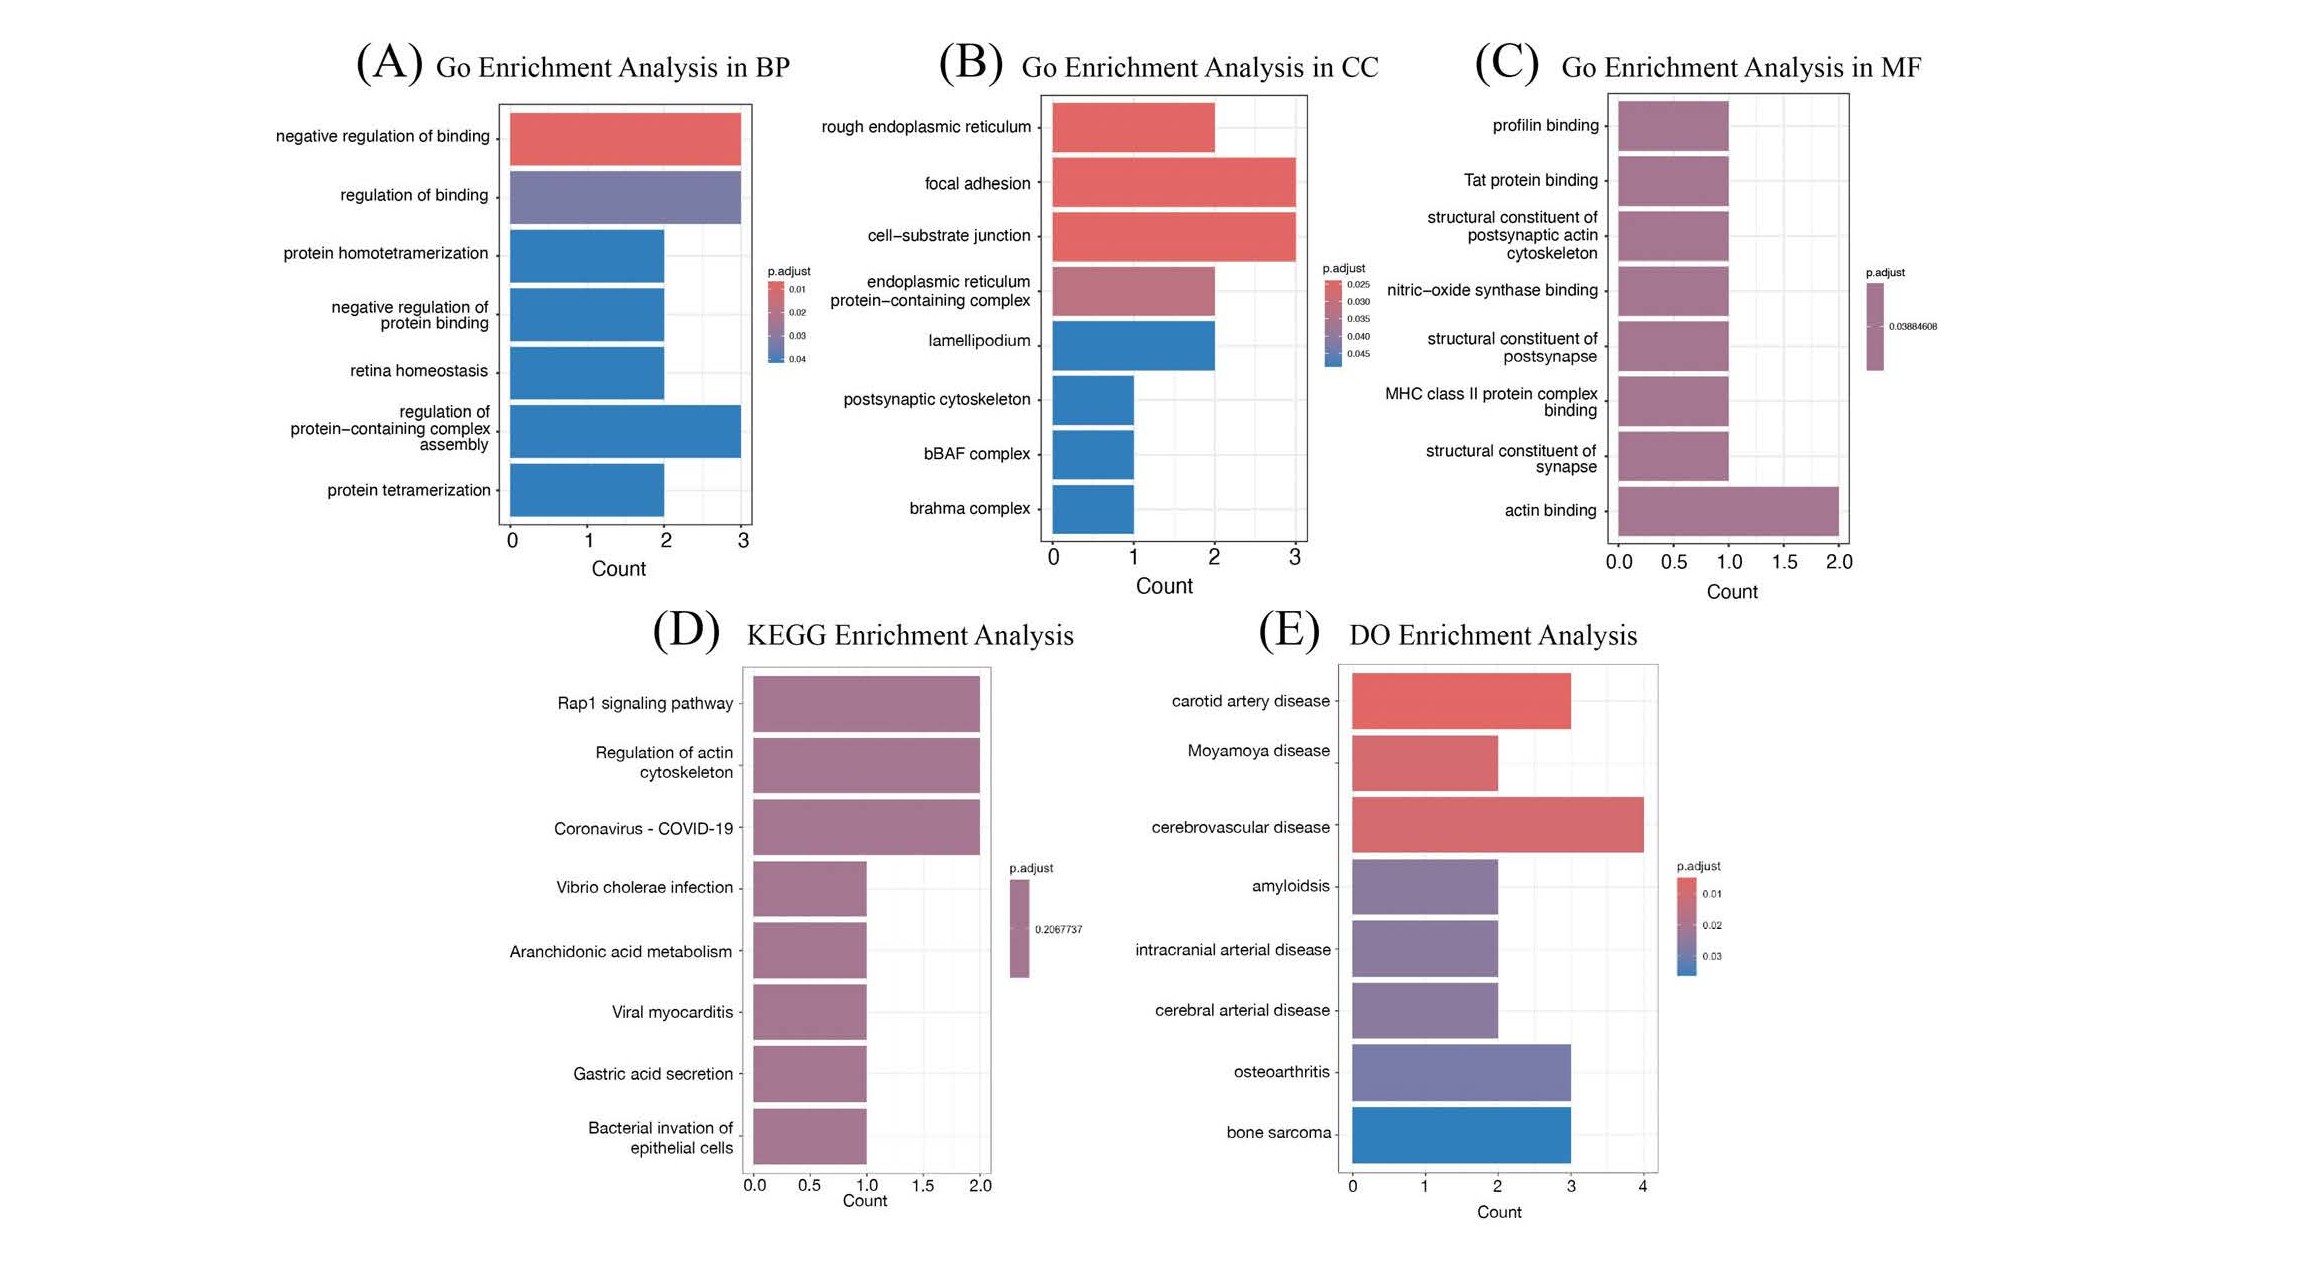
Figure 8. GO, KEGG, and DO enrichment analysis for RA. (A) GO enrichment analysis in BP of the 9 DEGs. (B) GO enrichment analysis in CC of the 9 DEGs. (C) GO enrichment analysis in MF of the 9 DEGs. (D) KEGG enrichment analysis of the 9 DEGs. (E) DO enrichment analysis of the 9 DEGs.
Model evaluation
Table 3 list performance Metrics of CNN, LGBM, and SVM Models. For the diseases SPA and RA, the LGBM model demonstrated superior performance across most metrics, particularly excelling in AUC (0.897) and Accuracy (0.933) for SPA. The SVM model led in Sensitivity (0.754) and F1 Score (0.694) for SPA, while the CNN model showed strong performance in AUC (0.906) and Accuracy (0.899) for RA. Each model displayed varied results in Precision and Sensitivity, reflecting their applicability and balance in different clinical scenarios.
|
Model Disease |
AUC |
Accuracy |
Precision |
Sensitivity |
F1 Score |
|
CNN SPA RA |
0.888 0.906 |
0.878 0.899 |
0.453 0.598 |
0.596 0.630 |
0.515 0.614 |
|
LGBM SPA RA |
0.897 0.933 |
0.933 0.900 |
0.775 0.619 |
0.544 0.565 |
0.639 0.591 |
|
SVM SPA RA |
0.882 0.884 |
0.928 0.797 |
0.642 0.367 |
0.754 0.826 |
0.694 0.508 |
The Comparison of Known Biomarkers
The identification of differentially expressed genes (DEGs) inThe identification of differentially expressed genes (DEGs) in this study provides valuable insights into potential biomarkers for RA and SpA. To contextualize these findings, we compare the DEGs identified here with known biomarkers from related autoimmune conditions, focusing on common and unique biomarkers that could enhance disease understanding and therapeutic strategies.
Both RA and SpA share several biomarkers associated with immune activation and inflammation. For instance, HLA antigens like HLA-A and HLA-B have In fact, been proven in both the conditions. HLA-B27 antigen is a confirmed risk factor gene in SpA with significant focus on AS and it has been shown that this antigen has significant role to play in antigen presentation process of immune reaction. Thus, the results of this study offer a rationale for the use of HLA-A as candidate biomarker of immune dysregulation and disease activity, and RA and SpA patient cohorts [32,33].
In addition to HLA markers, other shared biomarkers include MMP3, CD52, and B2M. These molecules play a role in immune moderation, tissue repair, and antigen display, and are related to both RA and SpA [34]. For instance, MMP3 is understood to mark joint degradation in RA and is sensitive to the progressive severity of the pathological condition [35]. Likewise, B2M has been found to have significant positive associations with disease activity in both RA and SpA due to immune response [36].
While many biomarkers are shared between RA and SpA, there are also disease-specific markers that may offer new avenues for diagnosis and treatment. For instance, XBP1 was found in our study as a DEG that is specific to SpA. This transcription factor is involved in unfolded protein response (UPR) and cellular stress, which is highly implicated in SpA, where immune cell infiltration and tissue remodeling occur [37]. Likewise, UBC (Ubiquitin C), which controls protein degradation, was also overexpressed in the SpA samples and has been associated with immune cell activation to inflammation in autoimmune disorders [38]. According to the results of RA genes, ACTB (Actin Beta) and PTGDS (Prostaglandin D2 Synthase) could be selected as significant biomarkers in the current work. ACTB contributes to cytoskeletal rearrangement which is important for immune cell migration in RA and therefore crucial in the disease progression [39]. PTGDS synthesized and released prostaglandin D2, which has both inflammatory and anti-inflammatory effects in RA [40].
Experimental Validation Approaches
To confirm the DEGs found in this study, the following experimental assays should be performed; qPCR, IHC, Western blotting, and FACS. These methods will not only validate gene expression but also offer further understanding of the functional characteristics of these biomarkers in the development of RA and SpA.
Real-time PCR is one of the most frequently utilized methods for the validation of gene expression. It shows alteration in the gene expression that is either up or down-regulated and quantifying mRNA ensures that there is a real and accurate increase of expression levels. It is particularly useful for ensuring the upregulation of DEGs in both RA and SpA. For instance, the HLA-A and CD52 with their roles in immune system activation and antigen presentation could be further examined using qPCR to determine the expression of the corresponding mRNA in affected tissues [41].
Another valuable technique of affirming gene expression at protein level is Immunohistochemistry (IHC). IHC also allows one to study the distribution of proteins within tissues; this embeds gene expression data into correct three-dimensional context. This method would be very useful for the validation of the presence and the location of protein such as HLA-A and CD52 in synovial tissue of samples of patients with RA and SpA. Hence, by using respective antibodies for these proteins, IHC would be applied to measure the inflamed tissue for amount of HLA-A, or CD52 proteins if the HLA-A or CD52 gene is transcribed as equal corresponding amounts of proteins. It also contains valuable data regarding the distribution of such biomarkers in tissue, which in turn helps in understanding the processes of immune cell infiltration as well as tissue remodeling [42].
In addition to qPCR and IHC, Western blotting is also very effective in protein validation. This technique could be used to confirm proteins like MMP3 and PTGDS that play the role of tissue remodeling and inflammation respectively. The direct quantity of protein can be measured through procedures such as the western blotting method which will also provide a strong evidence of protein expression at the post-translational level. Thus, confirmation of these proteins’ upregulation will aid in identifying their roles in joint degradation and inflammation in both RA and SpA [43].
Finally, the expression of CD 52 or any other immune cell stain on the specific cell type can be confirmed by flow cytometry. This method comes in handy as it permits viewing of protein expression on individual cells while especially applicable for analysis of immune cell activation and phenotype. For instance, flow cytometry may be used to determine the relative content of CD52 in T cells or B cells that infiltrate the synovial tissue in RA and SpA and demonstrate roles of this protein in immunopathogenesis and disease progression [44].
Regarding the DEGs uncovered in the current study, including HLA-A, CD52, MMP3, and UBC, the experimental validation utilizing these methods will offer additional evidence as to the biomarker candidacy of RA and SpA. Therefore, HLA-A and CD52 are singled out for further validation because of their roles in the immune system and as potential therapeutic targets. qPCR and IHC will be particularly applicable to these markers, as the technique will further indicate whether the genes and proteins of interest are expressed in diseased tissues. Second, due to the strong association of MMP3 and PTGDS with tissue remodeling and inflammation, these two proteins should be subjected to western blot analysis to verify their protein level and explore their biological function in disease development.
Sample Size and Power Limitations
However, the small sample size in this study is the biggest restriction that has to be taken into account in terms of both statistical and generalizability effects. Statistical power in turn is the capacity of a given study to identify a genuine effect if indeed there is one. A small number of participants tends to lower the sensitivity of the study—the probability of a Type II error rises, meaning that the researcher may fail to see a difference or an effect when they do exist.
In studies involving small cohorts, the reliability of findings becomes more uncertain. Small samples are generally more variable than large samples since their representation of the whole population is much smaller. This means that it is very difficult to generalize results based on a small sample, which is often the case when conducting such studies. Besides, narrower confidence intervals are obtained from studies with larger sample sizes; therefore, the studies included in this analysis had a small sample size leading to broader confidence intervals, and therefore the estimates are less precise. However, due to the small sample size, the CIs were wider and repeating the study with a bigger sample would give inconsistent results [45]. A primary challenge in studies with small sample sizes is low statistical power, which reduces the ability to detect significant differences, even when they exist. Small sample sizes increase the risk of not detecting an effect that exists due to inadequate subjects. Also, in any given study, differences in gene expression between two different people may not be truly significant, and variability obscures real differences. Small cohorts further have more artefacts and cannot be extrapolated to the general RA or SpA population with the consequent risk of making conclusions that only apply to the study sample. In addition, many subjects may restrict the choice of statistical techniques, and subsequently, the reliability of the results can be less strong as compared to those samples constituting large and diverse populations [46].
In light of these challenges, future investigations need to expand the number of participants to boost statistical conclusiveness. A sample that is involved with a large number will offer a good estimate and also enable the detection of small effects that could biologically be important. Also, having more participants requires the investigators to be certain that all patients are selected, hence the findings will be generalizable to the population.
Plans for Larger Cohort Studies
To enhance the reliability and generalizability of findings, future studies should aim to include larger and more diverse cohorts of patients. Increasing the sample size will increase the statistical power and thus conduct more robust tests on the data as well as increase the chances of forming a sound conclusion as to the biological variability in disease groups. Larger cohorts also minimize some of the factors that arise when sample sizes are small; such factors include sampling bias and variation in the patterns of gene expression in other individuals.
Increasing the size of the cohort in autoimmune diseases, especially the RA and SpA, can be made easier by partnering with other centers. In this way, undertakings like these collaborations where many research centers accumulate data from their patient samples can yield a more representative database of disease patients included in their studies. Regional factors can also be addressed in multi-center trials, and this enhances the external validity of the results in different geographical areas and other characteristics age, sex, ethnicity, and severity of disease amongst the patients. Such an approach may address the difficulties of a single-center study in terms of the accessibility to patients.
For instance, the International Genetics of Rheumatoid Arthritis Consortium (GRA) and the Spondyloarthritis Research Consortium of Canada (SPARCC) are large, centralized genetic studies that have previously merged data from multiple centers to compare the genetic factors and clinical attitudes of RA and SpA. Such large consortia have allowed for more extensive analyses and greater statistical confidence for the identification of disease etiology.
Discussion
In this study, we leveraged advanced spatial transcriptomic technologies and machine learning algorithms to investigate the molecular underpinnings of RA and SpA. By analyzing high-dimensional spatial transcriptomics data from synovial biopsy samples, we identified DEGs that may serve as potential biomarkers or therapeutic targets. Our integrative approach allowed us to discern specific genes and pathways implicated in the pathogenesis of RA and SpA, providing novel insights that could enhance diagnostic precision and inform targeted therapies.
Differentially expressed genes and their implications
Our analysis revealed 49 DEGs in SpA and 30 DEGs in RA with significant differential expression compared to control samples. Through rigorous feature selection methods, including LASSO, RFECV, and SFS, we refined these to 4 key DEGs for SpA (HLA-A, UBC, XBP1, SSR4) and 9 for RA (CD52, ACTB, PTGDS, SSR4, EVL, MMP3, FAU, B2M, TMSB4X). The identification of these genes underscores their potential roles in the pathogenesis of these diseases.
In SpA, the DEGs identified are predominantly involved in immune regulation and cellular stress responses. For instance, HLA-A is a major histocompatibility complex class I gene crucial for antigen presentation to cytotoxic T cells, implicating it in immune surveillance and response [47,48]. The strong association of SpA, particularly ankylosing spondylitis, with HLA-B27 has been well-documented, and our findings suggest that other HLA class I molecules like HLA-A may also contribute to disease pathogenesis.
The ubiquitin C gene (UBC) plays a critical role in protein degradation through the ubiquitin-proteasome system, which is essential for regulating immune responses and maintaining cellular homeostasis [49]. Dysregulation of ubiquitination processes can lead to aberrant immune activation, a hallmark of SpA. XBP1 is a key transcription factor in the UPR, which manages ER stress [50,51]. Chronic activation of the UPR has been implicated in inflammatory diseases, suggesting that XBP1 may contribute to the persistent inflammation observed in SpA. SSR4, encoding the translocon-associated protein δ, is involved in protein translocation across the ER and has been linked to immune cell infiltration in various tissues [52]. The upregulation of SSR4 may reflect enhanced protein synthesis demands in activated immune cells within inflamed synovial tissue.
In RA, the identified DEGs are integral to immune modulation, cytoskeletal organization, and tissue remodeling. CD52 encodes a glycoprotein expressed on the surface of lymphocytes and other immune cells, playing a vital role in immune regulation [53]. Therapeutic targeting of CD52 with monoclonal antibodies like alemtuzumab has shown efficacy in depleting lymphocytes and modulating autoimmune responses [54,55], highlighting its potential as a therapeutic target in RA.
ACTB, encoding β-actin, is essential for cytoskeletal integrity and cell motility. Altered expression of β-actin can affect immune cell migration into the synovium, exacerbating inflammation and joint destruction [56,57]. PTGDS, which encodes prostaglandin D2 synthase, is involved in the production of prostaglandin D2 (PGD2), a lipid mediator with complex roles in inflammation [58]. PGD2 can exhibit both pro-inflammatory and anti-inflammatory effects depending on receptor interactions [59,60], suggesting that PTGDS expression levels may influence inflammatory pathways in RA.
The consistent identification of SSR4 in both RA and SpA underscores its potential importance in inflammatory joint diseases. Its role in protein translocation and the UPR may contribute to synovial hyperplasia and immune cell activation [61]. EVL, encoding the Enah/VASP-like protein, is involved in actin cytoskeleton remodeling, affecting immune cell migration and potentially the invasive behavior of synovial fibroblasts in RA [62-64].
MMP3 is a matrix metalloproteinase that degrades extracellular matrix components, facilitating tissue remodeling and contributing to cartilage destruction in RA [65,66]. Elevated levels of MMP3 correlate with disease severity, making it a valuable biomarker and potential therapeutic target. FAU, involved in protein degradation and ribosome synthesis, may influence immune responses and cell proliferation through the ubiquitin-proteasome system [67,68]. B2M, a component of MHC class I molecules, is essential for antigen presentation, and its elevated levels have been associated with increased disease activity in RA [69-71]. TMSB4X, encoding thymosin beta-4, plays a role in actin binding and may affect immune cell function and tissue repair mechanisms [72,73].
Interpretation of upregulated DEGs
An unusual finding in our analysis was that all identified DEGs in both RA and SpA were upregulated. Typically, differential expression studies reveal a mix of upregulated and downregulated genes. This pattern may suggest a global activation of certain pathways or cellular processes in diseased tissues compared to controls. One possible explanation is that the diseased synovial tissues exhibit heightened inflammatory activity, leading to increased expression of genes involved in immune responses and cellular stress. However, this could also result from limitations in our dataset or analytical approach. The small sample size and lack of technical replicates may have affected the sensitivity of detecting downregulated genes. Additionally, our criteria for DEG selection might have favored the identification of upregulated genes. This limitation highlights the need for cautious interpretation of the results and underscores the importance of validating these findings in larger, independent cohorts.
Biological explanations for upregulated DEGs
The finding that all DEGs in our study were upregulated in both RA and SpA is an atypical result. Generally, DEG analysis brings out both upregulated and downregulated genes, which is a sign of study on gene expression in diseases. Nonetheless, increased expression of the DEGs solely in these autoimmune diseases may be due to several reasons that are biological and interrelated, namely immune activation, inflammation, and stress.
Immune system activation in RA and SpA: RA and SpA are both autoimmune diseases that involve inflammation and immune overactivity, which might explain the global increases in gene activation that were detected. In these conditions, the immune system of the body becomes self-destructive and attacks the healthy tissues but most affected are the joint tissues as they always exhibit continuous inflammation. This is due to the continuous stimulation of several immune cells like T cells and macrophages leading to the enhancement of experimental expression of genes related to immune signaling. For example, HLA molecules play a role in antigen presentation in immune responses; depending on HLA types, these molecules may be upregulated in autoimmune diseases [74]. Such overactivation could well account for the worldwide increase in the expression of genes associated with immune response, cell migration, and tissue remodeling [75].
Cellular stress responses in chronic inflammation: The chronic inflammation observed in RA and SpA induces cellular stress, particularly within immune cells and synovial tissue. Another possible reason for the increased DEGs is the activation of the UPR. This response occurs when cells are under stress brought about by the presence of misfolded proteins, which are characteristic of chronic inflammation [76]. Both in RA and SpA immune cells invade the affected tissues requiring increased biosynthesis of proteins and utilization of quality control mechanisms. Some of the specific targets of ER stress include genes like XBP1 and SSR4, which can be upregulated due to the attempt made by the cell to respond to this specific stress [77]. In this regard, the global increase in gene expression could be indicative of a cellular attempt at restoration of normalcy when under stress, a process which may be generalized in inflamed tissues where protein synthesis is increased.
Tissue remodeling and immune cell infiltration: Another potential cause for the upregulation of all DEGs is the extensive tissue remodeling occurring in RA and SpA. These diseases are characterized by synovial inflammation where the synovial intima layer known as the synovial membrane becomes thicker and is made up of new fibroblast cells as well as immune cells. T cells, B cells, and macrophages are invoked in the synovium and cartilage and regulate genes that are involved in inflammation and remodeling of the matrix. For example, MMP3 and ACTB which are involved in tissue remodeling may be upregulated for cellular migration and matrix degradation in the inflamed synovium [78].
Chronic inflammatory state and immune dysregulation: Immune dysregulation in RA and SpA, additionally, entails a chronic elevation of inflammation in which cytokines such as TNF-α, IL-6, and IL-17 are implicated. These pro-inflammatory cytokines reinforce the signals of inflammation to continue the inflammatory process and promote the increased expression of genes concerning immune response, cell attachment, and cytokine signaling [79]. This enhancement of immune responses could lead to the exclusive increase of DEGs in our study, indicating an immune system that has been heightened to fight threats, threats which may not necessarily be posed by pathogens.
Possible mechanisms behind global upregulation: Several biological processes may be likely to attribute to the global upregulation of genes of RA and SpA; as both the disorders are characterized by persistent inflammation, one can also note that immune-related gene and cytokine signaling pathways are constantly active in these conditions and promote immune responses. However, ER stress and the UPR upregulated genes related to protein quality control, including immune-activated cells under stress conditions. Finally, the path of cytokine dysregulation factor causes an imbalance of pro-inflammatory cytokines which in turn activate other immune cells and result in constant gene expression programs. Altogether, these mechanisms are attributed to the upregulation of several genes that persist due to immune activation and cellular stresses in the inflamed joint.
Functional pathway analysis
Gene Ontology (GO), KEGG pathway, and Disease Ontology (DO) enrichment analyses provided further insights into the biological functions and pathways associated with the identified DEGs. In SpA, the DEGs were enriched in processes related to T cell differentiation, vesicle lumen localization, and immune receptor activity (Figure 7). KEGG pathways included protein processing in the ER and immune-related disorders, emphasizing the role of protein homeostasis and immune responses in SpA pathogenesis. The DO analysis linked these genes to diseases such as multiple myeloma and bone marrow cancer, suggesting common underlying mechanisms involving immune dysregulation.
For RA, GO analysis highlighted enrichment in negative regulation of binding and localization to the rough ER (Figure 8), indicating disruptions in protein processing and cellular trafficking. KEGG pathways implicated included the Rap1 signaling pathway, which influences cell adhesion and migration [80], and regulation of the actin cytoskeleton, essential for immune cell movement and synovial fibroblast invasion. The association with viral myocarditis and other diseases in the DO analysis may reflect shared inflammatory mechanisms.
These findings align with the current understanding that both RA and SpA involve complex interactions between immune cells, cytokines, and cellular stress responses. The identification of common pathways and genes provides a foundation for exploring shared therapeutic targets.
Integration of machine learning models
The application of machine learning models enhanced our ability to predict disease status based on gene expression data. The use of SHAP values allowed us to interpret the contribution of individual genes to the model predictions, adding transparency to the machine learning process [81]. The LGBM model demonstrated superior performance in AUC and accuracy for both RA and SpA (Table 3), suggesting its suitability for high-dimensional genomic data.
The CNN model, applied to visualized gene expression images, also showed strong performance, particularly in RA. This indicates that spatial patterns of gene expression captured through imaging can be effectively utilized for disease classification. The SVM model excelled in sensitivity and F1 score for SpA, highlighting its potential in identifying true positive cases.
However, it is important to acknowledge that the moderate precision and sensitivity values indicate room for improvement. The limited sample size may have affected the generalizability of the models, and future studies with larger cohorts are necessary to validate and refine these predictive models.
Limitations and future directions
While our study provides valuable insights, several limitations must be considered. The sample size was relatively small, which may limit the statistical power and generalizability of the findings. All data were derived from publicly available datasets and validated in silico; therefore, experimental validation using independent cohorts is essential to confirm the relevance of the identified DEGs.
However, despite functional annotations based on these results, continued and more intricate molecular characterization is needed for understanding the roles of these DEGs in RA and SpA pathogenesis. A study of these genes’ dynamics as well as the functions of the genes within distinct pathways may shed light on new targets for treatment.
Therefore, built on the results of this research, future research should concentrate on the expanding of the sample size to increase the statistical strength to the findings and generalizability. Incorporation of clinical researchers could also bring in more synovial biopsy samples from the other groups of patients as well. For the purposes of this review, experimental confirmation of the identified DEGs with techniques such as quantitative PCR or immunohistochemistry is necessary. The functional studies focused on examining the functions of these genes in disease development may give further understanding of their therapeutic function. Furthermore, if other related omics data experiences proteomics and metabolomics were included, there would be more accurate understanding of RA and SpA. With the clearer class sets and enhanced ability of the larger datasets to model more specific slices of reality, the models are expected to produce enhanced accuracy and reliability. Finally, it will be perspective to translate these findings into clinical practice and to evaluate the scenarios that defined biomarkers are really diagnostic and prognostic factors.
Recommendations for future studies
Research on RA and SpA in the future must contemplate sample size to have adequate power. This can be done by having multiple centers where recruitment is done to incorporate various areas of the world and patients with different characteristics and distribution of disease forms. The next priority is patient characteristics, for example, age, gender, race, and disease severity, to compare manifestations of RA and SpA in their different subgroups. Furthermore, since the new biomarkers will involve CD52 and HLA-A, longitudinal research that will follow the history of diseases will be useful in evaluating how these biomarkers change with time and the impact on the clinical results of the treatments administered.
Furthermore, the studies at the molecular level should be extended in the context of RA and SpA by identifying the multi-omics data, including genomics, proteomics, and metabolomics, associated with clinical data in the future. Multiple countries and healthcare settings will also be useful in confirming the results and minimizing sampling errors, making results generalizable. These approaches will also enhance the accuracy and validity of tested outcomes while increasing the sample statistic, therefore, shaping a strategy to implement suitable therapeutic intercessions for a variety of RA and SpA patients to increase their effective treatment and management.
Conclusion
Our integrative approach combining spatial transcriptomics and machine learning has identified key DEGs and pathways involved in RA and SpA. The findings enhance our understanding of the molecular mechanisms underlying these diseases and highlight potential biomarkers and therapeutic targets. While preliminary, these results lay the groundwork for future studies aimed at improving diagnostic accuracy and developing targeted therapies, ultimately contributing to better patient outcomes.
References
2. Black RJ, Cross M, Haile LM, Culbreth GT, Steinmetz JD, Hagins H, et al. Global, regional, and national burden of rheumatoid arthritis, 1990–2020, and projections to 2050: a systematic analysis of the Global Burden of Disease Study 2021. The Lancet Rheumatology. 2023 Oct 1;5(10):e594-610.
3. Allado E, Moussu A, Bigna JJ, Hamroun S, Camier A, Chenuel B, et al. Global prevalence of spondyloarthritis in low-income and middle-income countries: a systematic review and meta-analysis protocol. BMJ Open. 2020 Oct 29;10(10):e041180.
4. Banerjee S, Khubchandani J, Noonan L, Batra K, Pai A, Schwab M. Risk of mortality among people with rheumatoid arthritis and depression. The Egyptian Rheumatologist. 2024 Jan 1;46(1):43-6.
5. Guo Q, Wang Y, Xu D, Nossent J, Pavlos NJ, Xu J. Rheumatoid arthritis: pathological mechanisms and modern pharmacologic therapies. Bone Res. 2018 Apr 27;6:15.
6. Sharip A, Kunz J. Understanding the Pathogenesis of Spondyloarthritis. Biomolecules. 2020 Oct 20;10(10):1461.
7. Navarro-Compán V, Ermann J, Poddubnyy D. A glance into the future of diagnosis and treatment of spondyloarthritis. Ther Adv Musculoskelet Dis. 2022 Jul 22;14:1759720X221111611.
8. Poddubnyy D. Classification vs diagnostic criteria: the challenge of diagnosing axial spondyloarthritis. Rheumatology (Oxford). 2020 Oct 1;59(Suppl4):iv6-iv17.
9. Aletaha D, Smolen JS. Diagnosis and Management of Rheumatoid Arthritis: A Review. JAMA. 2018 Oct 2;320(13):1360-1372.
10. Carlberg K, Korotkova M, Larsson L, Catrina AI, Ståhl PL, Malmström V. Exploring inflammatory signatures in arthritic joint biopsies with Spatial Transcriptomics. Sci Rep. 2019 Dec 12;9(1):18975.
11. Allard-Chamard H, Li Q, Rahman P. Emerging Concepts in Precision Medicine in Axial Spondyloarthritis. Curr Rheumatol Rep. 2023 Oct;25(10):204-12.
12. Ermann J, Lefton M, Wei K, Gutierrez-Arcelus M. Understanding Spondyloarthritis Pathogenesis: The Promise of Single-Cell Profiling. Curr Rheumatol Rep. 2024 Apr;26(4):144-54.
13. Zhang L, Chen D, Song D, Liu X, Zhang Y, Xu X, et al. Clinical and translational values of spatial transcriptomics. Signal Transduct Target Ther. 2022 Apr 1;7(1):111.
14. Rao A, Barkley D, França GS, Yanai I. Exploring tissue architecture using spatial transcriptomics. Nature. 2021 Aug;596(7871):211-20.
15. Zheng H, Aihaiti Y, Cai Y, Yuan Q, Yang M, Li Z, et al. The m6A/m1A/m5C-Related Methylation Modification Patterns and Immune Landscapes in Rheumatoid Arthritis and Osteoarthritis Revealed by Microarray and Single-Cell Transcriptome. J Inflamm Res. 2023 Nov 1;16:5001-25.
16. Zheng G, Chen S, Ma W, Wang Q, Sun L, Zhang C, et al. Spatial and Single-Cell Transcriptomics Unraveled Spatial Evolution of Papillary Thyroid Cancer. Adv Sci (Weinh). 2024 Nov 14:e2404491.
17. Stankovic B, Kotur N, Nikcevic G, Gasic V, Zukic B, Pavlovic S. Machine Learning Modeling from Omics Data as Prospective Tool for Improvement of Inflammatory Bowel Disease Diagnosis and Clinical Classifications. Genes (Basel). 2021 Sep 18;12(9):1438.
18. Nascimben M. Machine learning approaches for personalized medicine. 2024.
19. Zhou X, Cai F, Li S, Li G, Zhang C, Xie J, et al. Machine learning techniques for prediction in pregnancy complicated by autoimmune rheumatic diseases: Applications and challenges. Int Immunopharmacol. 2024 Jun 15;134:112238.
20. Coskun A, Ertaylan G, Pusparum M, Van Hoof R, Kaya ZZ, Khosravi A, et al. Advancing personalized medicine: Integrating statistical algorithms with omics and nano-omics for enhanced diagnostic accuracy and treatment efficacy. Biochim Biophys Acta Mol Basis Dis. 2024 Oct;1870(7):167339.
21. Feng S, Li J, Tian J, Lu S, Zhao Y. Application of Single-Cell and Spatial Omics in Musculoskeletal Disorder Research. Int J Mol Sci. 2023 Jan 23;24(3):2271.
22. Shulman ED, Campagnolo EM, Lodha R, Cantore T, Hu T, Nasrallah M, et al. Path2Space: An AI Approach for Cancer Biomarker Discovery Via Histopathology Inferred Spatial Transcriptomics. bioRxiv. 2024:2024-10.
23. Ahmed Z, Mohamed K, Zeeshan S, Dong X. Artificial intelligence with multi-functional machine learning platform development for better healthcare and precision medicine. Database (Oxford). 2020 Jan 1;2020:baaa010.
24. DeGroat W, Mendhe D, Bhusari A, Abdelhalim H, Zeeshan S, Ahmed Z. IntelliGenes: a novel machine learning pipeline for biomarker discovery and predictive analysis using multi-genomic profiles. Bioinformatics. 2023 Dec 1;39(12):btad755.
25. Sharma A, Lysenko A, Jia S, Boroevich KA, Tsunoda T. Advances in AI and machine learning for predictive medicine. J Hum Genet. 2024 Oct;69(10):487-97.
26. Lu S, Yang J, Gu Y, He D, Wu H, Sun W, et al. Advances in Machine Learning Processing of Big Data from Disease Diagnosis Sensors. ACS Sens. 2024 Mar 22;9(3):1134-48
27. Xu Z, Wang W, Yang T, Li L, Ma X, Chen J, et al. STOmicsDB: a comprehensive database for spatial transcriptomics data sharing, analysis and visualization. Nucleic Acids Res. 2024 Jan 5;52(D1):D1053-61.
28. Liu H, Peng Y. Identification of a Novel Gene Expression Signature Associated with Amino Acid Metabolism (AAM) in Ankylosing Spondylitis (AS). Int J Gen Med. 2024 Feb 19;17:597-609.
29. Ritchie ME, Phipson B, Wu D, Hu Y, Law CW, Shi W, et al. limma powers differential expression analyses for RNA-sequencing and microarray studies. Nucleic Acids Res. 2015 Apr 20;43(7):e47.
30. Wu T, Hu E, Xu S, Chen M, Guo P, Dai Z, et al. clusterProfiler 4.0: A universal enrichment tool for interpreting omics data. Innovation (Camb). 2021 Jul 1;2(3):100141.
31. Yu G, Wang LG, Yan GR, He QY. DOSE: an R/Bioconductor package for disease ontology semantic and enrichment analysis. Bioinformatics. 2015 Feb 15;31(4):608-9.
32. Nagit RE, Rezus E, Cianga P. Exploring the Pathogenesis of Spondylarthritis beyond HLA-B27: A Descriptive Review. Int J Mol Sci. 2024 May 31;25(11):6081.
33. Canossi A, Oumhani K, Del Beato T, Sebastiani P, Colanardi A, Aureli A. The Role of CD1 Gene Polymorphism in the Genetic Susceptibility to Spondyloarthropathies in the Moroccan Population and the Possible Cross-Link with Celiac Disease. Vaccines (Basel). 2023 Jan 20;11(2):237.
34. Mennillo E, Kim YJ, Lee G, Rusu I, Patel RK, Dorman LC, et al. Single-cell and spatial multi-omics highlight effects of anti-integrin therapy across cellular compartments in ulcerative colitis. Nat Commun. 2024 Feb 19;15(1):1493.
35. Prasad P, Verma S, Surbhi, Ganguly NK, Chaturvedi V, Mittal SA. Rheumatoid arthritis: advances in treatment strategies. Mol Cell Biochem. 2023 Jan;478(1):69-88.
36. Maccarone MC, Scanu A, Coraci D, Masiero S. The Potential Role of Spa Therapy in Managing Frailty in Rheumatic Patients: A Scoping Review. Healthcare (Basel). 2023 Jun 30;11(13):1899.
37. Del Vescovo S, Venerito V, Iannone C, Lopalco G. Uncovering the Underworld of Axial Spondyloarthritis. Int J Mol Sci. 2023 Mar 30;24(7):6463.
38. Kim C, Kwon Y, Jeong J, Kang M, Lee GS, Moon JH, et al. Phytochrome B photobodies are comprised of phytochrome B and its primary and secondary interacting proteins. Nat Commun. 2023 Mar 27;14(1):1708
39. Du C, Cai N, Dong J, Xu C, Wang Q, Zhang Z, et al. Uncovering the role of cytoskeleton proteins in the formation of neutrophil extracellular traps. Int Immunopharmacol. 2023 Oct;123:110607.
40. Shen BQ, Sankaranarayanan I, Price TJ, Tavares-Ferreira D. Sex-differences in prostaglandin signaling: a semi-systematic review and characterization of PTGDS expression in human sensory neurons. Sci Rep. 2023 Mar 22;13(1):4670.
41. Chang YT, Prompsy P, Kimeswenger S, Tsai YC, Ignatova D, Pavlova O, et al. MHC-I upregulation safeguards neoplastic T cells in the skin against NK cell-mediated eradication in mycosis fungoides. Nat Commun. 2024 Jan 25;15(1):752.
42. Evertsson B. Soluble biomarkers to inform on pathophysiological mechanisms and for tailoring therapy in multiple sclerosis (Doctoral dissertation, Karolinska Institutet).
43. Fatica M, D'Antonio A, Novelli L, Triggianese P, Conigliaro P, Greco E, Bergamini A, Perricone C, Chimenti MS. How Has Molecular Biology Enhanced Our Undertaking of axSpA and Its Management. Curr Rheumatol Rep. 2023 Jan;25(1):12-33.
44. Kutija MB. Ophthalmological manifestations of systemic autoimmune diseases. In: Rezaei N, ed. Translational Autoimmunity. Academic Press; 2023 Jan 1. pp. 183-214.
45. Li C, Lin J, Jiang Q, Yang T, Xiao Y, Huang J, Hou Y, et al. Genetic Modifiers of Age at Onset for Amyotrophic Lateral Sclerosis: A Genome-Wide Association Study. Ann Neurol. 2023 Nov;94(5):933-41.
46. Guła Z, Łosińska K, Kuszmiersz P, Strach M, Nowakowski J, Biedroń G, et al. A comparison of comorbidities and their risk factors prevalence across rheumatoid arthritis, psoriatic arthritis and axial spondyloarthritis with focus on cardiovascular diseases: data from a single center real-world cohort. Rheumatol Int. 2024 Nov 11.
47. Díaz-Peña R, Castro-Santos P, Durán J, Santiago C, Lucia A. The Genetics of Spondyloarthritis. J Pers Med. 2020 Oct 2;10(4):151.
48. Yu HC, Huang KY, Lu MC, Huang Tseng HY, Liu SQ, Lai NS, et al. Down-Regulation of LOC645166 in T Cells of Ankylosing Spondylitis Patients Promotes the NF-κB Signaling via Decreasingly Blocking Recruitment of the IKK Complex to K63-Linked Polyubiquitin Chains. Front Immunol. 2021 Feb 25;12:591706.
49. Ebner P, Versteeg GA, Ikeda F. Ubiquitin enzymes in the regulation of immune responses. Crit Rev Biochem Mol Biol. 2017 Aug;52(4):425-60.
50. Sriburi R, Jackowski S, Mori K, Brewer JW. XBP1: a link between the unfolded protein response, lipid biosynthesis, and biogenesis of the endoplasmic reticulum. J Cell Biol. 2004 Oct 11;167(1):35-41.
51. Valdés P, Mercado G, Vidal RL, Molina C, Parsons G, Court FA, et al. Control of dopaminergic neuron survival by the unfolded protein response transcription factor XBP1. Proc Natl Acad Sci U S A. 2014 May 6;111(18):6804-9.
52. He W, Wang B, He J, Zhao Y, Zhao W. SSR4 as a prognostic biomarker and related with immune infiltration cells in colon adenocarcinoma. Expert Rev Mol Diagn. 2022 Feb;22(2):223-31.
53. Li Z, Richards S, Surks HK, Jacobs A, Panzara MA. Clinical pharmacology of alemtuzumab, an anti-CD52 immunomodulator, in multiple sclerosis. Clin Exp Immunol. 2018 Dec;194(3):295-314.
54. Hale G. The CD52 antigen and development of the CAMPATH antibodies. Cytotherapy. 2001;3(3):137-43.
55. Muskat KK. Modeling the Synovium In Vitro. University of California, San Diego; 2018.
56. Aihaiti Y, Tuerhong X, Ye JT, Ren XY, Xu P. Identification of pivotal genes and pathways in the synovial tissue of patients with rheumatoid arthritis and osteoarthritis through integrated bioinformatic analysis. Molecular Medicine Reports. 2020 Oct;22(4):3513-24.
57. Zeng L, Yu G, Yang K, He Q, Hao W, Xiang W, et al. Exploring the mechanism of Celastrol in the treatment of rheumatoid arthritis based on systems pharmacology and multi-omics. Sci Rep. 2024 Jan 18;14(1):1604.
58. Marín-Méndez JJ, Patiño-García A, Segura V, Ortuño F, Gálvez MD, Soutullo CA. Differential expression of prostaglandin D2 synthase (PTGDS) in patients with attention deficit-hyperactivity disorder and bipolar disorder. J Affect Disord. 2012 May;138(3):479-84.
59. Kupczyk M, Kuna P. Targeting the PGD2/CRTH2/DP1 Signaling Pathway in Asthma and Allergic Disease: Current Status and Future Perspectives. Drugs. 2017 Aug;77(12):1281-94.
60. Mishima S, Kashiwakura JI, Toyoshima S, Sasaki-Sakamoto T, Sano Y, Nakanishi K, et al. Higher PGD2 production by synovial mast cells from rheumatoid arthritis patients compared with osteoarthritis patients via miR-199a-3p/prostaglandin synthetase 2 axis. Sci Rep. 2021 Mar 11;11(1):5738.
61. Agyemang AF, Harrison SR, Siegel RM, McDermott MF. Protein misfolding and dysregulated protein homeostasis in autoinflammatory diseases and beyond. Semin Immunopathol. 2015 Jul;37(4):335-47.
62. Estin ML, Thompson SB, Traxinger B, Fisher MH, Friedman RS, Jacobelli J. Ena/VASP proteins regulate activated T-cell trafficking by promoting diapedesis during transendothelial migration. Proc Natl Acad Sci U S A. 2017 Apr 4;114(14):E2901.
63. Mascarenhas JB, Gaber AA, Larrinaga TM, Mayfield R, Novak S, Camp SM, et al. EVL is a novel focal adhesion protein involved in the regulation of cytoskeletal dynamics and vascular permeability. Pulm Circ. 2021 Oct 4;11(4):20458940211049002.
64. Yu-Kemp HC, Kemp JP Jr, Brieher WM. CRMP-1 enhances EVL-mediated actin elongation to build lamellipodia and the actin cortex. J Cell Biol. 2017 Aug 7;216(8):2463-79.
65. Mohammed FF, Smookler DS, Khokha R. Metalloproteinases, inflammation, and rheumatoid arthritis. Ann Rheum Dis. 2003 Nov;62 Suppl 2(Suppl 2):ii43-7.
66. Konda VR, Desai A, Darland G, Bland JS, Tripp ML. META060 inhibits osteoclastogenesis and matrix metalloproteinases in vitro and reduces bone and cartilage degradation in a mouse model of rheumatoid arthritis. Arthritis Rheum. 2010 Jun;62(6):1683-92.
67. Park Y, Jin HS, Aki D, Lee J, Liu YC. The ubiquitin system in immune regulation. Adv Immunol. 2014;124:17-66.
68. Behl T, Chadha S, Sachdeva M, Kumar A, Hafeez A, Mehta V, et al. Ubiquitination in rheumatoid arthritis. Life Sci. 2020 Nov 15;261:118459.
69. Wang H, Liu B, Wei J. Beta2-microglobulin(B2M) in cancer immunotherapies: Biological function, resistance and remedy. Cancer Lett. 2021 Oct 1;517:96-104.
70. Wang C, Wang Z, Yao T, Zhou J, Wang Z. The immune-related role of beta-2-microglobulin in melanoma. Front Oncol. 2022 Aug 16;12:944722.
71. Andersson L, Ståhl F. Distribution of candidate genes for experimentally induced arthritis in rats. BMC Genomics. 2010 Mar 2;11:146.
72. Scheller I, Beck S, Göb V, Gross C, Neagoe RAI, Aurbach K, et al. Thymosin β4 is essential for thrombus formation by controlling the G-actin/F-actin equilibrium in platelets. Haematologica. 2022 Dec 1;107(12):2846-58.
73. Feng Q, Xia W, Wang S, Dai G, Jiao W, Guo N, et al. Etodolac improves collagen induced rheumatoid arthritis in rats by inhibiting synovial inflammation, fibrosis and hyperplasia. Mol Biomed. 2021 Oct 25;2(1):33.
74. Pisetsky DS. Pathogenesis of autoimmune disease. Nat Rev Nephrol. 2023 Aug;19(8):509-24.
75. Christopoulou ME, Aletras AJ, Papakonstantinou E, Stolz D, Skandalis SS. WISP1 and Macrophage Migration Inhibitory Factor in Respiratory Inflammation: Novel Insights and Therapeutic Potentials for Asthma and COPD. Int J Mol Sci. 2024 Sep 18;25(18):10049.
76. Klyosova E, Azarova I, Buikin S, Polonikov A. Differentially Expressed Genes Regulating Glutathione Metabolism, Protein-Folding, and Unfolded Protein Response in Pancreatic β-Cells in Type 2 Diabetes Mellitus. Int J Mol Sci. 2023 Jul 27;24(15):12059.
77. Garcia-Ryde M. Stress Response in Chronic Obstructive Pulmonary Disease-Effect of Cigarette Smoke Extract and Hypoxia on Structural Lung Cells. 2024.
78. Horváth E, Sólyom Á, Székely J, Nagy EE, Popoviciu H. Inflammatory and Metabolic Signaling Interfaces of the Hypertrophic and Senescent Chondrocyte Phenotypes Associated with Osteoarthritis. Int J Mol Sci. 2023 Nov 17;24(22):16468.
79. Habanjar O, Bingula R, Decombat C, Diab-Assaf M, Caldefie-Chezet F, Delort L. Crosstalk of Inflammatory Cytokines within the Breast Tumor Microenvironment. Int J Mol Sci. 2023 Feb 16;24(4):4002.
80. Remans PH, Reedquist KA, Bos JL, Verweij CL, Breedveld FC, van Laar JM, et al. Deregulated Ras and Rap1 signaling in rheumatoid arthritis T cells leads to persistent production of free radicals. Arthritis Research & Therapy. 2002 Feb;4:52.
81. Ng S, Masarone S, Watson D, Barnes MR. The benefits and pitfalls of machine learning for biomarker discovery. Cell Tissue Res. 2023 Oct;394(1):17-31.