Abstract
Alzheimer’s disease (AD) is the most common form of dementia with hallmarks of ß-amyloid (Aß) plaques, tau tangles, and neurodegeneration. Studies have shown that neurodegeneration components, especially brain metabolic deficits, are more predictable for AD severity than Aß and tau. However, detailed knowledge of the biochemical composition of AD brain tissue vs. normal brain tissue remains unclear. In this study, we performed a metabolomics analysis on the brain tissue of 158 community-based older adults in the University of Kentucky AD Research Center brain bank to characterize the biochemical profiles of brains with and without AD based on white/gray matter type, apolipoprotein E genotype (ε3 vs ε4 variants), and disease stage (early vs late) as all these factors influence metabolic processes. We also used machine learning to rank the top metabolites separating controls and AD in gray and white matter. Compared with control samples, we found that glutamate and creatine metabolism were more critical for predicting AD in the gray matter, while glycine, fatty acid, pyrimidine, tricarboxylic acid (TCA) cycle, and phosphatidylcholine metabolism were more critical in the white matter. In ε4 carriers, metabolites associated with the TCA cycle and oxidative phosphorylation were prominent in advanced stages compared to the early stages. In ε3 carriers, metabolites related to oxidative DNA damage, changes in inhibitory neurotransmitters, and disruptions of neuronal membranes were prominent in advanced stages compared to the early stages. In early disease, ε4 carriers had metabolites related to poor kidney function and altered neuronal sterol metabolism compared to ε3 carriers, but there were few differences between genotypes in late disease. Our results indicate that metabolism plays a pivotal role in differentiating APOE- and stage-dependent changes in AD and may facilitate precision lifestyle and dietary interventions to mitigate AD risk in the early stages, especially for ε4 carriers.
Introduction
Alzheimer’s disease (AD) is a leading cause of death and morbidity in the United States [1]. The hallmarks of AD are β-amyloid (Aβ) and tau. However, studies have indicated that metabolic dysfunction may play a more pivotal role in the progression of AD [2]. Glucose hypometabolism and mitochondrial dysfunction are well-known features of AD [2].
These irregularities are likely influenced by Apolipoprotein E (APOE) genotype, the most common genetic risk factor for AD. APOE is a lipid transport carrier with a direct impact on metabolism whose function is dependent on the structure of the protein variant (whether it is ε2, ε3, or ε4). Those carriers of the APOE ε4 allele have a two- to four-fold increased risk for developing AD [3,4].
AD progresses differently in the white matter than the gray matter. While most research has been focused on reporting changes in the gray matter of the cortex, many studies are now reporting changes in white matter tracts [5]. Metabolism is different in gray versus white matter due to the unique composition of each type (more lipid metabolism in the white matter [6] and more glucose metabolism in the gray matter [7]). There is also evidence to suggest that there is more glycolytic metabolism in the white matter and more oxidative metabolism in the gray matter [8]. Understanding the metabolic demands of the two different brain environments could give important clues about the progression of AD.
Detailed knowledge of the biochemical composition of AD brain tissue vs normal brain tissue will be vital in understanding the metabolic processes underlying AD. To our knowledge, only three reports have been published describing a brain metabolomics signature of AD. These reports demonstrated that the principal metabolites that classify AD in brain tissue include glycerophospholipids, spermidine, sphingolipids, and changes in bile acids [9-11]. These reports analyzed between 15 and 111 samples per group to develop a brain metabolomics signature based on targeted lipids or bile acids assays. The analyses were based on the gray-enriched matter only. While these reports provide an introductory study of brain metabolomics, a complete understanding is needed that factors a larger patient population, an untargeted assay, and samples enriched for both gray and white matter. Furthermore, a better understanding of how AD progresses based on APOE genotype is needed to develop therapeutics for AD based on precision medicine eventually.
Here we performed a metabolomics analysis on the brain tissue of a large cohort of community-based participants in the University of Kentucky Alzheimer’s Disease Research Center (UK-ADRC) brain bank. We used machine learning to identify the differences between the biochemical profiles of whiteenriched matter and gray-enriched matter and identified the metabolites which were the top predictors in differentiating AD from normal brain tissue. We proceeded to characterize the biochemical profiles of brains with and without AD based on APOE genotype and disease stage.
Methods
Participant characteristics
Details of UK-ADRC research volunteers’ recruitment, inclusion/exclusion criteria, and clinical and pathological assessments have been described previously [12]. Briefly, community-based older adult volunteers agreed to be followed annually for cognitive, physical, and neurological examination and to donate their brains at the time of death. The UK Institutional Review Board approved protocols, and all participants provided written informed consent. Included subjects were ≥ 70 years of age at death. Research subjects with relatively rare dementia syndromes, e.g., prions, trinucleotide repeat diseases, or Frontotemporal lobar degeneration (FTLD), or any brain tumor were excluded.
Additionally, since our research questions focused on the association between APOE and tau pathology, cases also had to have APOE genotyping available and were dichotomized into APOE ε4 carriers and APOE ε3 homozygotes. Demographic information included our participants’ age at death (years), sex, race (nonwhite or white), and years of education. We describe diagnosed cognitive status (normal cognition, impaired not mild cognitive impairment [MCI], MCI, dementia), and primary clinical diagnosis (normal cognition, AD, LBD/Parkinson disease; vascular disease, other) at the participant’s last visit before death. Using Braak NFT staging [13], we defined those as the early stage with a Braak NFT score 0-III and those as the late stage with a Braak score IV-VI. Participant characteristics are listed in Table 1.
| Number of Participants | 158 |
| Age | 85.6 (84.4, 86.9) |
| APOE (% 4 carriers) | 36.7% |
| Braak Stage 0-3 | 51.3% |
| Braak Stage 4-6 | 48.7% |
| Gender (% Female) | 58.9% |
| Race (% White) | 94.9% |
| Race (% Black) | 5.1% |
| MMSE | 22.2 (20.8, 23.6) |
| Postmortem Interval | 3.7 (3.36, 4.02) |
| Consensus Diagnosis (% AD) | 10.8% |
| Consensus Diagnosis (% Mixed AD) | 42.7% |
| Consensus Diagnosis (% Other Dementia) | 17.2% |
| Consensus Diagnosis (% Normal) | 29.3% |
| TDP-43 (% Positive) | 27.9% |
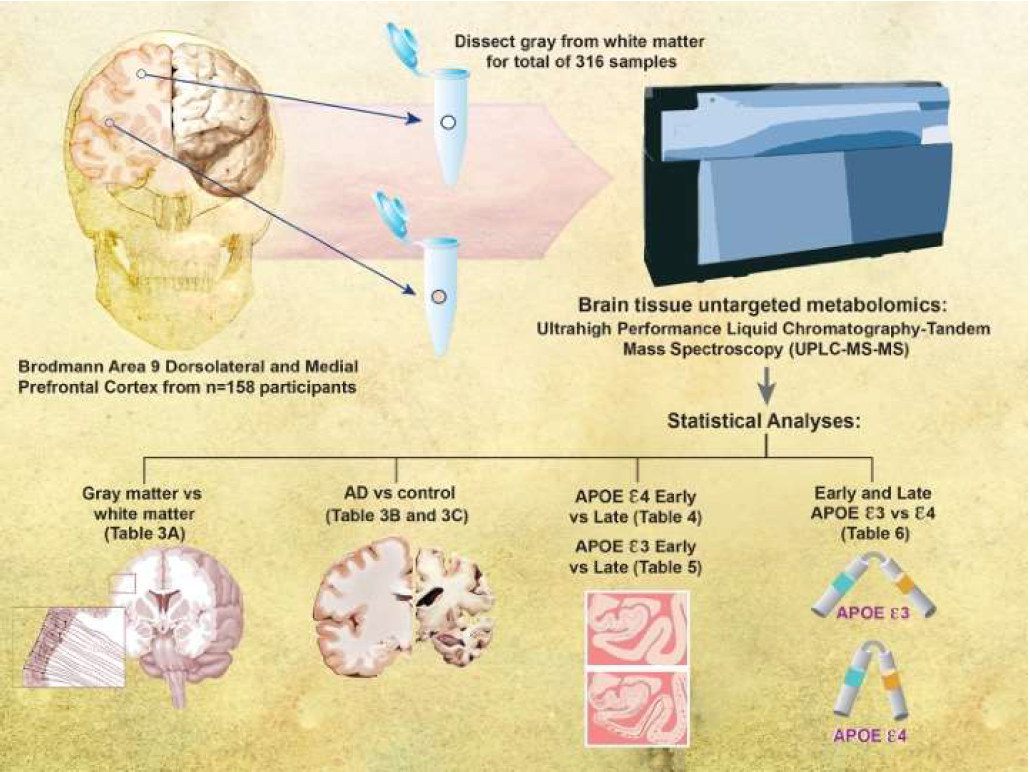
Figure 1 shows the schematic representation of the study design. Human brain tissue samples were collected and snapfrozen in liquid nitrogen at brain autopsy. For the present study, samples were obtained from Brodmann’s area 9 (the dorsolateral prefrontal cortex) of the left hemisphere of 158 community-based older adult volunteers. Brain tissue samples were further dissected into the gray-enriched matter and white-enriched matter samples, yielding 316 brain samples. The education level was the same across stage and genotype. Age differed between only late ε3 and late ε4 groups (87.97 ± 6.96 vs. 82.76 ± 8.45). We profiled the brain tissue metabolomics using Metabolon’s (Durham, NC) global screening platform. We separated our analyses by Braak NFT stages (early 0-III vs. late IV-VI) and APOE genotype (ε3 and ε4) (Table 2).
| APOE ε3/ε3 | APOE ε3/ε4 | Total | |
|---|---|---|---|
| Braak Stage 0-3 | 64 | 17 | 81 |
| Braak Stage 4-6 | 36 | 41 | 77 |
| Total | 100 | 58 | 158 |
Metabolon platform
We sent samples to Metabolon (Durham, NC) for a global metabolic profile for each sample. All samples were maintained at -80oC until processed. Samples were prepared using the automated MicroLab STAR® system from Hamilton Company. Proteins were precipitated with methanol under vigorous shaking for 2 min (Glen Mills GenoGrinder 2000) followed by centrifugation. The resulting extract was divided into five fractions: two for analysis by two separate reverse phases (RP)/ UPLC-MS/MS methods with positive ion mode electrospray ionization (ESI), one for analysis by RP/UPLC-MS/MS with negative ion mode ESI, one for analysis by HILIC/UPLC-MS/MS with negative ion mode ESI, and one sample was reserved for backup. Samples were placed briefly on a TurboVap® (Zymark) to remove the organic solvent.
Ultrahigh performance liquid chromatography-tandem mass spectroscopy (UPLC-MS/MS): All methods utilized a Waters ACQUITY ultra-performance liquid chromatography (UPLC) and a Thermo Scientific Q-Exactive high resolution/ accurate mass spectrometer interfaced with a heated electrospray ionization (HESI-II) source and Orbitrap mass analyzer operated at 35,000 mass resolution. The sample extract was dried then reconstituted in solvents compatible with each of the four methods. Each reconstitution solvent contained a series of standards at fixed concentrations to ensure injection and chromatographic consistency. One aliquot was analyzed using acidic positive ion conditions, chromatographically optimized for more hydrophilic compounds. In this method, the extract was gradient eluted from a C18 column (Waters UPLC BEH C18-2.1x100 mm, 1.7 μm) using water and methanol, containing 0.05% perfluoropentanoic acid (PFPA) and 0.1% formic acid (FA). Another aliquot was also analyzed using acidic positive ion conditions; however, it was chromatographically optimized for more hydrophobic compounds. In this method, the extract was gradient eluted from the aforementioned C18 column using methanol, acetonitrile, water, 0.05% PFPA, and 0.01% FA and was operated at an overall higher organic content. Another aliquot was analyzed using basic negative ion optimized conditions using a separate dedicated C18 column. However, the essential extracts were gradient eluted from the column using methanol and water with 6.5mM Ammonium Bicarbonate at pH 8. The fourth aliquot was analyzed via negative ionization following elution from a HILIC column (Waters UPLC BEH Amide 2.1x150 mm, 1.7 μm) using a gradient consisting of water and acetonitrile with 10mM Ammonium Formate, pH 10.8. The MS analysis alternated between MS and data-dependent MSn scans using dynamic exclusion. The scan range varied slightly between methods but covered 70-1000 m/z.
Bioinformatics: The informatics system consisted of four major components, the Laboratory Information Management System (LIMS), the data extraction and peak-identification software, data processing tools for QC and compound identification, and a collection of information interpretation and visualization tools for use by data analysts. The hardware and software foundations for these informatics components were the LAN backbone, and a database server running Oracle 10.2.0.1 Enterprise Edition.
LIMS: The purpose of the Metabolon LIMS system was to enable fully auditable laboratory automation through a secure, easy-to-use, and highly specialized system. The scope of the Metabolon LIMS system encompasses sample accessioning, sample preparation and instrumental analysis, and reporting an advanced data analysis. All the subsequent software systems are grounded in the LIMS data structures. It has been modified to leverage and interface with the in-house information extraction and data visualization systems, as well as third-party instrumentation and data analysis software.
Data extraction and compound identification: Raw data was extracted, peak-identified, and QC processed using Metabolon’s hardware and software. These systems are built on a web-service platform utilizing Microsoft’s .NET technologies, which run on high-performance application servers and fiber-channel storage arrays in clusters to provide active failover and load-balancing. Compounds were identified by comparison to library entries of purified standards or recurrent unknown entities. Metabolon maintains a library based on authenticated standards that contain the retention time/index (RI), mass to charge ratio (m/z), and chromatographic data (including MS/MS spectral data) on all molecules present in the library. Furthermore, biochemical identifications are based on three criteria: retention index within a narrow RI window of the proposed identification, accurate mass match to the library ± 10 ppm, and the MS/MS forward and reverse scores between the experimental data and authentic standards. The MS/MS scores are based on a comparison of the ions present in the experimental spectrum to the ions present in the library spectrum. While there may be similarities between these molecules based on one of these factors, all three data points can be utilized to distinguish and differentiate biochemicals. More than 3300 commercially available purified standard compounds have been acquired and registered into LIMS for analysis on all platforms to determine their analytical characteristics. Additional mass spectral entries have been created for structurally unnamed biochemicals, identified by virtue of their recurrent nature (both chromatographic and mass spectral). These compounds can be identified by the future acquisition of a matching purified standard or by classical structural analysis.
Metabolite quantification and data normalization: Peaks were quantified using area-under-the-curve. For studies spanning multiple days, a data normalization step was performed to correct variation resulting from instrument inter-day tuning differences. Essentially, each compound was corrected in run-day blocks by registering the medians to equal one (1.00) and normalizing each data point proportionately (termed the “block correction”; Figure 2). For studies that did not require more than one day of analysis, no normalization is necessary, other than for data visualization purposes. In certain instances, biochemical data may have been normalized to an additional factor (e.g., cell counts, total protein as determined by Bradford assay, osmolality, etc.) to account for differences in metabolite levels due to differences in the amount of material present in each sample.
Statistical and analytical methods
Statistical calculations: For many studies, two types of statistical analysis are usually performed: (1) significance tests and (2) classification analysis. Standard statistical analyses are performed in ArrayStudio on log transformed data. For those analyses not standard in ArrayStudio, the programs R (http:// cran.r-project.org/) or JMP are used. Below are examples of frequently employed significance tests and classification methods followed by a discussion of p- and q-value significance thresholds.
Machine learning classification: Random Forest was used as a supervised classification technique to identify the relative importance of the different biochemicals in predicting grayenriched matter vs. white-enriched matter, Alzheimer’s disease vs. control, APOE ε4 vs. APOE ε3 genotypes in early stage and late stage, early stage vs. late stage in APOE ε4 and APOE ε3 genotypes, and Vascular dementia vs. control based on an ensemble of decision trees. For a given decision tree, a random subset of the data with identifying true class information was selected to build the tree, and the remaining data, the “out-of-bag” (OOB) variables, were passed down the tree to obtain a class prediction for each sample. This process was repeated thousands of times to produce the forest. The final classification of each sample was determined by computing the class prediction frequency (“votes”) for the OOB variables over the whole forest. This method is unbiased since the prediction for each sample is based on trees built from a subset of samples that do not include that sample. When the full forest is grown, the class predictions are compared to the true classes, generating the “OOB error rate” to measure prediction accuracy. Thus, the prediction accuracy is an unbiased estimate of how well one can predict sample class in a new data set. The random forest has several advantages – it makes no parametric assumptions, variable selection is not needed, does not overfit, is invariant to transformation, and is relatively easy to implement with R.
To determine which variables (biochemicals) make the largest contribution to the classification, a “variable importance” measure is computed. We use the “Mean Decrease Accuracy” (MDA) as this metric. The MDA is determined by randomly permuting a variable, running the observed values through the trees, and then reassessing the prediction accuracy. If a variable is not important, then this procedure will have little change in the class prediction accuracy (permuting random noise will give random noise). By contrast, if a variable is important to the classification, the prediction accuracy will drop after such a permutation, which we record as the MDA. Thus, the random forest analysis provides an “importance” rank ordering of biochemicals; we typically output the top 30 biochemicals in the list as potentially worthy of further investigation.
Results
Metabolomics differences in gray and white-enriched matters
In total, 540 of the 776 detected metabolites were either increased or decreased in the white-enriched matter vs gray-enriched matter. The white-enriched matter has more lipid metabolites associated with myelin than gray-enriched matter. A detailed list is found in Supplementary Table 1.
Using a random forest analysis, we found that the model could predict whether a sample was the grayenriched matter or white-enriched matter based on the metabolomics profile with 91.77% accuracy (Table 3A). Heat map of statistically significant biochemicals profiled when comparing groups are labeled as follows: Red and green shaded cells indicate p ≤ 0.05 (red specifies that the mean values are significantly higher for that comparison; green values significantly lower). The top 10 predictors were all lipids, which play a significant role in the brain as structural components of membranes and signaling molecules. Notably, there was an increase in prominent hexosylceramides, some phosphatidylcholines, lysoplasmalogen, some plasmalogens, and phosphatidylserine, whereas there was a decrease in other phosphatidylcholines, phosphatidylethanolamine, and some plasmalogen metabolites. Most of the observed changes were correlated with the known differences in whiteand gray-enriched matter lipid populations due to the diverse functions of neuron cell biology. All analyses were performed in both gray-enriched matter and white-enriched matter to account for these differences.
| A) GrayMattervsWhiteMatter | ||||||
|
Accuracy: 91.77% |
||||||
|
Rank Order |
Super Pathway | Sub Pathway | Biochemical Name | Fold Change | ||
|
1 |
Lipid | Hexosylceramides (HCER) | glycosyl ceramide (d18:2/24:1, d18:1/24:2)* |
2.35 |
||
|
2 |
Lipid | Phosphatidylcholine (PC) | 1,2-dipalmitoyl-GPC (16:0/16:0) |
0.38 |
||
|
3 |
Lipid | Phosphatidylcholine (PC) | 1,2-dioleoyl-GPC (18:1/18:1) |
2.61 |
||
|
4 |
Lipid | Lysoplasmalogen | 1-(1-enyl-oleoyl)-2-oleoyl-GPE (P-18:1/18:1)* |
3.01 |
||
|
5 |
Lipid | Plasmalogen | 1-(1-enyl-palmitoyl)-2-oleoyl-GPE (P-16:0/18:1)* |
2.37 |
||
|
6 |
Lipid | Hexosylceramides (HCER) | glycosyl ceramide (d18:2/25:1, d18:1/25:2) |
2.01 |
||
|
7 |
Lipid | Phosphatidylethanolamine (PE) | 1-palmitoyl-2-docosahexaenoyl-GPE (16:0/22:6)* |
0.41 |
||
|
8 |
Lipid | Phosphatidylserine (PS) | 1-stearoyl-2-oleoyl-GPS (18:0/18:1) |
2.11 |
||
|
9 |
Lipid | Phosphatidylethanolamine (PE) | 1-oleoyl-2-docosahexaenoyl-GPE (18:1/22:6)* |
0.54 |
||
|
10 |
Lipid | Plasmalogen | 1-(1-enyl-palmitoyl)-2-palmitoyl-GPC (P-16:0/16:0)* |
0.58 |
||
| B) GrayMatterAD vs Normal | ||||||
|
Accuracy: 80.00% |
||||||
|
Rank Order |
Super Pathway |
Sub Pathway |
Biochemical Name | Fold Change | ||
|
1 |
Lipid | Phospholipid Metabolism | glycerophosphorylcholine (GPC) |
1.51 |
||
|
2 |
Amino Acid | Alanine and Aspartate Metabolism | N-acetylasparagine |
0.67 |
||
|
3 |
Lipid | Fatty Acid, Monohydroxy | 13-HODE + 9-HODE |
0.50 |
||
|
4 |
Amino Acid | Lysine Metabolism | pipecolate |
0.47 |
||
|
5 |
Lipid | Phospholipid Metabolism | glycerophosphoethanolamine |
1.26 |
||
|
6 |
Amino Acid | Glycine, Serine and Threonine Metabolism | dimethylglycine |
0.58 |
||
|
7 |
Amino Acid | Glutamate Metabolism | N-acetyl-aspartyl-glutamate (NAAG) |
0.75 |
||
|
8 |
Amino Acid | Creatine Metabolism | Guanidinoacetate |
1.49 |
||
|
9 |
Amino Acid | Histidine Metabolism | N-acetylhistidine |
0.57 |
||
| C) White Matter AD vs Normal | ||||||
| Accuracy: 81.54% | ||||||
| Rank Order | Super Pathway | Sub Pathway | Biochemical Name | Fold Change | ||
| 1 | Lipid | Fatty Acid, Monohydroxy | 13-HODE + 9-HODE |
0.56 |
||
| 2 | Lipid | Phospholipid Metabolism | glycerophosphorylcholine (GPC) |
1.47 |
||
| 3 | Amino Acid | Lysine Metabolism | pipecolate |
0.48 |
||
| 4 | Amino Acid | Glycine, Serine and Threonine Metabolism | betaine |
0.74 |
||
| 5 | Amino Acid | Histidine Metabolism | N-acetylhistidine |
0.62 |
||
| 6 | Lipid | Fatty Acid, Monohydroxy | 2-hydroxyheptanoate* |
0.81 |
||
| 7 | Lipid | Phospholipid Metabolism | glycerophosphoethanolamine |
1.25 |
||
| 8 | Nucleotide | Pyrimidine Metabolism, Uracil containing | 3-ureidopropionate |
0.56 |
||
| 9 | Energy | TCA Cycle | 2-methylcitrate/homocitrate |
0.80 |
||
| 10 | Lipid | Phosphatidylcholine (PC) | 1,2-dilinoleoyl-GPC (18:2/18:2) |
0.74 |
||
| 11 | Amino Acid | Alanine and Aspartate Metabolism | N-acetylasparagine |
0.69 |
||
| 12 | Amino Acid | Glycine, Serine and Threonine Metabolism | dimethylglycine |
0.59 |
||
| Heat map of statistically significant biochemicals profiled when comparing groups are labeled as follows: Red and green shaded cells indicate p ≤ 0.05 (red specifies that the mean values are significantly higher for that comparison; green values significantly lower). | ||||||
Machine learning to classify AD from normal with Gray and white-enriched matter metabolomics
Using random forest analysis, we found that the model predicted whether a sample came from AD brain tissue or normal brain tissue based on the metabolomics profile with 80.0% accuracy in the gray-enriched matter (Table 3B) and an 81.54% accuracy in the white-enriched matter (Table 3C). The top 9 predictors in gray-enriched matter mainly consisted of increases in phospholipid and creatine metabolism, decreases in amino acid metabolism, and the monohydroxy fatty acid 13-HODE + 9-HODE. The top 12 predictors in whiteenriched matter mainly consisted of increases in phospholipid metabolism and decreases in amino acid metabolism, phosphatidylcholine, and some monohydroxy fatty acids. Glycerophosphocholine is formed in the breakdown of phosphatidylcholine and is increased in both the gray-enriched matter and white-enriched matter. N-acetylasparagine is a breakdown product of asparagine and is decreased in both the gray-enriched matter and white-enriched matter. The human body produces dimethylglycine when metabolizing choline into glycine, and it is decreased in the gray-enriched matter. N-acetyl-aspartyl-glutamate (NAAG) is a neuropeptide that is an agonist at mGluR3 receptors and an antagonist at NMDA receptors and is decreased in the gray-enriched matter. Pipecolic acid originates mainly from the catabolism of dietary lysine by intestinal bacteria rather than direct food intake, and it is decreased in both the gray-enriched matter and the white-enriched matter. Ureidopropionic acid is a urea compound and is an intermediate in the metabolism of uracil; it is decreased in the white-enriched matter.
Taken together, our findings indicate that glutamate and creatine metabolism is more important for predicting disease in the gray matter, while glycine, fatty acid, pyrimidine, tricarboxylic acid (TCA) cycle, and phosphatidylcholine metabolism are more important for predicting disease in the white matter.
Gray and white-enriched matter metabolomics between early- and late-stage in APOE ε4
We next investigated the differences between late-stage and early-stage disease in the ε4 genotype (Table 4). We found that, compared with the early stage, late-stage APOE ε4 carriers had significantly reduced metabolite levels in the gray matter. Notable changes were found in pathways associated with mitochondrial function, glucose metabolism, and neurotransmitters, including the TCA cycle, oxidative phosphorylation, pentose metabolism, and acetyl-CoA and glutamate metabolism. We observed lower levels of serine and aspartate, whose declines correlate with the amount of Aβ plaques and neuronal pathology [14], as well as tyrosine and leucine, which are known to reduce atherosclerosis by improving the lipid profile and reducing systemic inflammation [15]. Further, metabolites related to mitigating oxidative stress, such as cysteine, arginine, gamma-glutamyl amino acid, pentose, were also lower in gray matter in the late stage. We also saw lipid decreases in seven lysophospholipid (LPL) species. LPL receptor ligands are known to bind to and activate their cognate receptors located in the cell membrane with a wide range of effects on the cell; these include the primary effects of inhibition of adenylyl cyclase and the release of calcium from the endoplasmic reticulum, as well as the secondary effects of preventing apoptosis and increasing cell proliferation [16].
| E4 Late Stage vs Early Stage | ||||
|---|---|---|---|---|
| Super Pathway |
Sub Pathway |
Biochemical Name |
Gray Matter |
White Matter |
| Amino Acid |
Glycine, Serine and Threonine Metabolism | N-acetylserine |
0.84 |
0.91 |
| Alanine and Aspartate Metabolism | N-acetylasparagine |
0.74 |
0.80 |
|
| Glutamate Metabolism | N-acetyl-aspartyl-glutamate (NAAG) |
0.72 |
0.70 |
|
| Tyrosine Metabolism | 4-hydroxyphenylpyruvate |
0.81 |
0.67 |
|
| Leucine, Isoleucine and Valine Metabolism |
methylsuccinate |
0.65 |
0.70 |
|
| methylsuccinoylcarnitine |
0.73 |
0.72 |
||
| Methionine, Cysteine, SAM and Taurine Metabolism | cystathionine |
0.80 |
0.72 |
|
| Urea cycle; Arginine and Proline Metabolism | N-acetylarginine |
0.80 |
0.93 |
|
| Peptide |
Gamma-glutamyl Amino Acid |
gamma-glutamylisoleucine* |
0.63 |
0.95 |
| gamma-glutamylmethionine |
0.68 |
0.73 |
||
| gamma-glutamylthreonine |
0.81 |
0.96 |
||
| Carbohydrate |
Pentose Metabolism | ribitol |
0.73 |
0.77 |
| Fructose, Mannose and Galactose Metabolism | galactose 1-phosphate |
0.40 |
1.01 |
|
| Energy |
TCA Cycle |
fumarate |
0.80 |
0.86 |
| malate |
0.81 |
0.89 |
||
| Oxidative Phosphorylation | phosphate |
0.94 |
0.92 |
|
| Lipid |
Fatty Acid Metabolism | acetyl CoA |
0.69 |
0.66 |
| Phospholipid Metabolism | choline phosphate |
0.83 |
0.79 |
|
| Lysophospholipid (LPL) |
1-palmitoleoyl-GPC (16:1)* |
0.81 |
0.94 |
|
| 1-stearoyl-GPC (18:0) |
0.88 |
0.92 |
||
| 1-oleoyl-GPC (18:1) |
0.82 |
0.91 |
||
| 1-linoleoyl-GPC (18:2) |
0.79 |
0.88 |
||
| 1-arachidonoyl-GPC (20:4n6)* |
0.82 |
1.01 |
||
| 1-linoleoyl-GPE (18:2)* |
0.77 |
0.94 |
||
| 1-arachidonoyl-GPE (20:4n6)* |
0.80 |
0.98 |
||
| Diacylglycerol | palmitoyl-docosahexaenoyl- glycerol (16:0/22:6) [1]* |
1.26 |
1.69 |
|
| Heat map of statistically significant biochemicals profiled when comparing groups are labeled as follows: Red and green shaded cells indicate p ≤ 0.05 (red specifies that the mean values are significantly higher for that comparison; green values significantly lower). | ||||
In white matter, reductions were found in biochemicals related to glutamate, tyrosine, leucine, and methionine/ cysteine metabolism. Interestingly, diacylglycerol was increased in the white matter in later disease similar to levels found in the ε3 genotype. Since diacylglycerol has been shown to reduce atherosclerosis in an APOE-deficient mouse model [17], the increase in diacylglycerol in the ε4 genotype could be a compensatory mechanism to combat rising levels of atherosclerosis.
The results show that with the disease progression, APOE ε4 carriers had alterations in metabolites associated with increased Aβ retention, reducing atherosclerosis, and the impaired TCA cycle and oxidative phosphorylation.
Gray and white-enriched matter metabolomics between early- and late-stage in APOE ε3
We further investigated the differences between late-stage and early-stage in APOE ε3 genotype (Table 5). Individuals with ε3 variants had similar changes in the gray and white matters.
| E3 Late Stage vs Early Stage | ||||
|---|---|---|---|---|
| Super Pathway | Sub Pathway | Biochemical Name |
Gray Matter |
White Matter |
| Amino Acid |
Glycine, Serine and Threonine Metabolism |
N-acetylglycine |
1.75 |
1.62 |
| dimethylglycine |
0.61 |
0.59 |
||
| betaine |
0.71 |
0.69 |
||
| Alanine and Aspartate Metabolism | N-acetylasparagine |
0.69 |
0.70 |
|
| Glutamate Metabolism |
N-acetyl-aspartyl-glutamate (NAAG) |
0.80 |
0.88 |
|
| beta-citrylglutamate |
0.73 |
0.85 |
||
| Histidine Metabolism |
N-acetylhistidine |
0.62 |
0.67 |
|
| N-acetyl-3-methylhistidine* |
1.48 |
1.48 |
||
| homocarnosine |
0.67 |
0.74 |
||
| 1-methylhistamine |
0.65 |
0.67 |
||
| 1-methyl-4-imidazoleacetate |
0.63 |
0.82 |
||
| Lysine Metabolism |
2-aminoadipate |
1.21 |
1.24 |
|
| pipecolate |
0.51 |
0.56 |
||
| N-acetyl-2-aminoadipate |
1.05 |
1.15 |
||
| Tyrosine Metabolism | 3-methoxytyramine sulfate |
0.26 |
0.33 |
|
| Tryptophan Metabolism |
tryptophan betaine |
0.45 |
0.44 |
|
| 8-methoxykynurenate |
0.64 |
0.67 |
||
| 5-hydroxyindoleacetate |
0.62 |
0.72 |
||
| Urea cycle; Arginine and Proline Metabolism | argininate* |
1.21 |
1.14 |
|
| Polyamine Metabolism |
N-acetylputrescine |
0.76 |
0.74 |
|
| N1,N12-diacetylspermine |
0.21 |
0.32 |
||
| Glutathione Metabolism | S-lactoylglutathione |
0.70 |
0.94 |
|
| Carbohydrate |
Glycolysis, Gluconeogenesis, and Pyruvate Metabolism |
fructose 1,6-diphosphate/glucose 1,6-diphosphate/myo-inositol diphosphates |
0.51 |
0.92 |
| dihydroxyacetone phosphate (DHAP) | 0.57 |
0.79 |
||
| Nucleotide Sugar | UDP-galactose | 1.51 |
1.47 |
|
| Lipid |
Long Chain Polyunsaturated Fatty Acid (n3 and n6) | tetradecadienoate (14:2)* | 0.75 |
0.69 |
| Fatty Acid, Dicarboxylate | octadecenedioate (C18:1-DC) | 0.55 |
0.59 |
|
| Fatty Acid Metabolism (Acyl Carnitine, Short Chain) | acetylcarnitine (C2) | 0.86 |
0.70 |
|
| Fatty Acid Metabolism (Acyl Carnitine, Polyunsaturated) | arachidonoylcarnitine (C20:4) | 0.65 |
0.84 |
|
| docosahexaenoylcarnitine (C22:6)* | 0.52 |
0.53 |
||
| Fatty Acid, Monohydroxy |
2-hydroxyheptanoate* | 0.76 |
0.78 |
|
| 13-HODE + 9-HODE | 0.62 |
0.54 |
||
| Inositol Metabolism | myo-inositol | 1.15 |
1.21 |
|
| Phospholipid Metabolism |
glycerophosphorylcholine (GPC) | 1.34 |
1.34 |
|
| glycerophosphoethanolamine | 1.18 |
1.20 |
||
| Phosphatidylcholine (PC) |
1-palmitoyl-2-linoleoyl-GPC (16:0/18:2) | 0.96 |
0.90 |
|
| 1,2-dilinoleoyl-GPC (18:2/18:2) | 0.79 |
0.62 |
||
| Heat map of statistically significant biochemicals profiled when comparing groups are labeled as follows: Red and green shaded cells indicate p ≤ 0.05 (red specifies that the mean values are significantly higher for that comparison; green values significantly lower). | ||||
However, unlike ε4, which involves mitochondrial and glucose metabolism, notable key reductions in ε3 carriers were found in glycolysis, glutamate, tryptophan, and tyrosine metabolism. Glutamate is an excitatory neurotransmitter, which plays a critical role in learning and memory [18] and N-acetyl-aspartyl-glutamate (NAAG) has been shown to have precognitive effects by binding to metabotropic glutamate receptors [19]. Tryptophan metabolism is known to be altered in patients with AD [20], and tryptophan-derived metabolites can inhibit Aβ fibril formation in neurons and neuroblastoma cells [21]. Tryptophan is an essential amino acid and is the precursor of serotonin. Indole-3-propionic acid, a tryptophanderived metabolite, can inhibit Aβ fibril formation in neurons and neuroblastoma cells [21]. Metabolites that play a role in tyrosine metabolism, including phenol sulfate, phenol glucuronide, and p-cresol glucuronide, are associated with inflammation [22].
We observed lower levels of dimethylglycine, which is linked to increased oxidative DNA damage associated with Aβ deposition [23], and homocarnosine, which is part of the histidine pathway and generally declines with age [24]. Neuronal histamine, phenylalanine, and tryptophan have a role in memory, reinforcement, and emotions [25-27]. We also found lower levels of fatty acids, which are often found as oxidized linoleic acid metabolites (OXLAMs) in the serum of AD patients [28] and phosphatidylcholine, which provides a reservoir of choline that can be used for acetylcholine synthesis. Notable key increases were found in myo-inositol metabolism, urea cycle, lysine, nucleotide sugar, inositol, and phospholipid. Myo-inositol, a neuroinflammatory marker, is negatively correlated with visuospatial working memory [29]. Lysine can act as a neurotransmitter modulating GABAergic transmission. The phospholipid is known to be raised in AD by disrupting neural cell membranes and causing cell death [30].
Taken together, our findings indicate that increases in metabolites linked to oxidative DNA damage, changes in inhibitory neurotransmitters, disruptions of neuronal membranes, and decreases in metabolites related to acetylcholine synthesis drive the differences between earlyand late-stage of AD among APOE ε3 carriers.
Gray and white-enriched matter metabolomics between APOE ε3 and APOE ε4 at early- and late-stage
We next compared the differences between APOE ε4 and 3 carriers at early-stage disease (Table 6). Notable changes were found in pathways associated with leucine, glycine, arginine, gamma-glutamyl amino acid, pentose, and secondary bile acid metabolism in APOE ε4 carriers compared to non-carriers. N,N,N-trimethyl-alanylproline betaine (TMAP), part of arginine metabolism, was lower in ε4 and is associated with poor kidney function [31]. We also found decreases in glutathione, commonly decreased with age [32], eicosanoid, and sterol - carriers of the APOE ε3/ε4 allele are known to exhibit altered neuronal sterol metabolism.
|
Early Stage |
||||
|---|---|---|---|---|
| E4/E3 Fold Change | ||||
| Super Pathway |
Sub Pathway |
Biochemical Name |
Gray Matter |
White Matter |
| Amino Acid |
Glycine, Serine and Threonine Metabolism | dimethylglycine |
0.60 |
0.57 |
| Histidine Metabolism |
formiminoglutamate |
0.03 |
0.02 |
|
| histamine |
1.28 |
1.15 |
||
| 1-methyl-4-imidazoleacetate |
0.64 |
0.53 |
||
| Lysine Metabolism | 2-aminoadipate |
1.27 |
1.28 |
|
| Leucine, Isoleucine and Valine Metabolism |
1-carboxyethylisoleucine |
1.40 |
1.22 |
|
| methylsuccinate |
1.38 |
1.41 |
||
| methylsuccinoylcarnitine |
1.36 |
1.42 |
||
| Urea cycle; Arginine and Proline Metabolism |
N,N,N-trimethyl-alanylproline betaine (TMAP) |
0.52 |
0.49 |
|
| argininate* |
1.38 |
1.29 |
||
| Glutathione Metabolism | 4-hydroxy-nonenal-glutathione |
0.55 |
0.49 |
|
| Peptide |
Gamma-glutamyl Amino Acid |
gamma-glutamylisoleucine* |
1.81 |
1.31 |
| gamma-glutamylmethionine |
1.31 |
1.24 |
||
| gamma-glutamylthreonine |
1.54 |
1.47 |
||
| Carbohydrate | Pentose Metabolism | ribitol |
1.30 |
1.23 |
| Energy | Oxidative Phosphorylation | phosphate |
1.06 |
1.09 |
| Lipid |
Long Chain Polyunsaturated Fatty Acid (n3 and n6) | arachidonate (20:4n6) |
1.19 |
1.09 |
| Eicosanoid | 15-HETE |
0.54 |
0.50 |
|
| Endocannabinoid | docosahexaenoyl ethanolamide |
1.32 |
0.99 |
|
| Phosphatidylethanolamine (PE) | 1,2-dipalmitoyl-GPE (16:0/16:0)* |
0.94 |
0.73 |
|
| Phosphatidylglycerol (PG) | 1,2-dioleoyl-GPG (18:1/18:1) |
0.55 |
1.25 |
|
| Lysophospholipid |
1-oleoyl-GPC (18:1) |
1.11 |
1.09 |
|
| 1-palmitoyl-GPS (16:0)* |
1.36 |
0.96 |
||
| Sterol | 7-hydroxycholesterol (alpha or beta) |
0.42 |
0.42 |
|
| Secondary Bile Acid Metabolism | glycodeoxycholate |
0.46 |
0.59 |
|
|
Late Stage |
||||
| E4/E3 Fold Change | ||||
| Super Pathway | Sub Pathway | Biochemical Name |
GrayMatter |
White Matter |
| Amino Acid |
Tryptophan Metabolism | indolelactate |
2.58 |
1.76 |
| Urea cycle; Arginine and Proline Metabolism | homoarginine |
1.66 |
1.53 |
|
| Polyamine Metabolism | N1,N12-diacetylspermine |
6.95 |
10.26 |
|
| Lipid | Primary Bile Acid Metabolism | glycochenodeoxycholate |
2.67 |
3.68 |
| Heat map of statistically significant biochemicals profiled when comparing groups are labeled as follows: Red and green shaded cells indicate p ≤ 0.05 (red specifies that the mean values are significantly higher for that comparison; green values significantly lower). | ||||
Unique differences in gray-enriched matter include an amino acid increase of histamine and 1-carboxyethylisoleucine (part of isoleucine metabolism), a peptide increase of gammaglutamylisoleucine, a lipid increase of arachidonate (a long chain polyunsaturated fatty acid) and docosahexaenoyl ethanolamide (an endocannabinoid implicated in the pathology of neurodegenerative diseases).
Other differences were found only in the whiteenriched matter. Unique differences include amino acid decreases in formiminoglutamate (part of histidine metabolism) and increases of 2-aminoadipate (part of lysine metabolism), lipid decreases in 1,2-dipalmitoyl-GPE (a phosphatidylethanolamine) and palmitoyl-docosahexaenoylglycerol (a diacylglycerol) and increases in 1,2-dioleoyl-GPG (a phosphatidylglycerol), 1- 1-enyl-oleoyl)-2-oleoyl-GPE (a lysoplasmalogen).
Taken together, our findings indicate that increased metabolites in APOE ε4 carriers related to poor kidney function and altered neuronal sterol metabolism drive the differences between the genotypes at an early stage.
Four detected metabolites increased between APOE ε4 and ε3 carriers at late stages of AD. At an alpha=0.01, a random chance would be expected to generate ~8 significant observations. Since our results do not surpass this threshold, our analyses did not identify metabolic differences between ε3 and ε4 carriers at late stages of AD.
Discussion
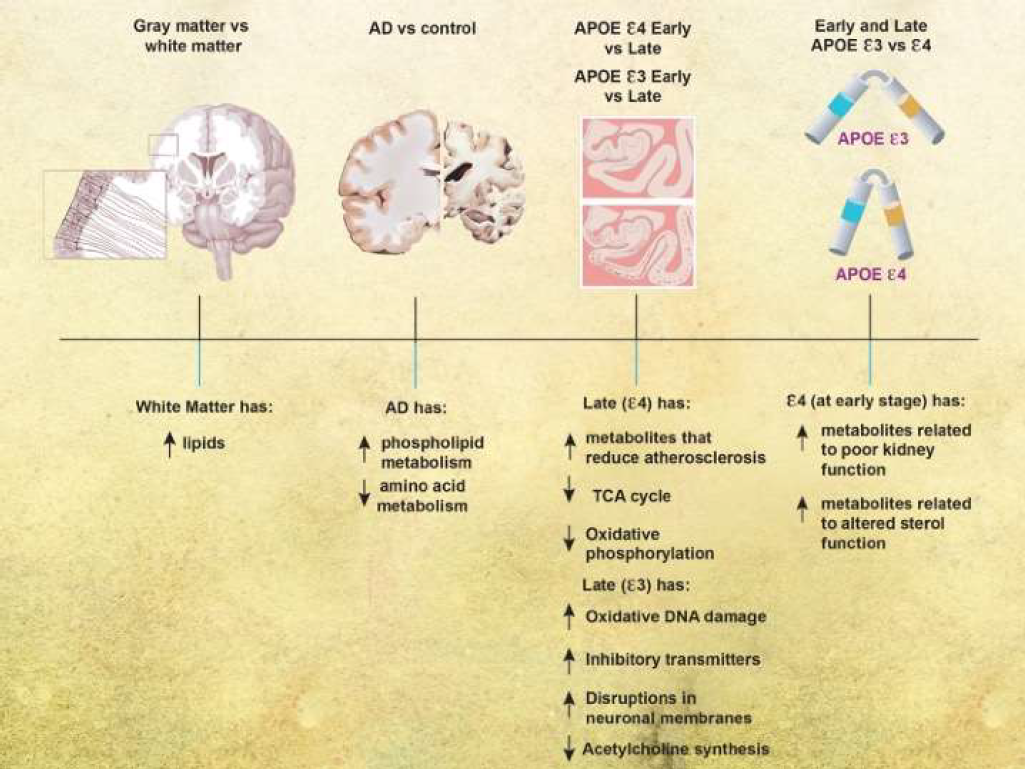
We analyzed frontal cortical tissue from subjects across a spectrum of AD severity, with different genotypes (APOE 3/3 or APOE ε3/4) (summary of results is in Figure 2). We found distinct changes in the white versus gray-enriched matter of subjects as demonstrated through peptide alterations and lipid changes that have been associated with brain matter. There were increases in phospholipid metabolism and decreases in amino acid metabolism in AD brains compared with normal brains. Taken together, our findings indicated that glutamate and creatine metabolism were more important for predicting disease in the gray matter, and glycine, fatty acid, pyrimidine, TCA cycle, and phosphatidylcholine metabolism are more important for predicting disease in the white matter. As disease progressed in the APOE ε4 genotype, brains were characterized by decreases in metabolites responsible for reducing atherosclerosis and the TCA cycle and oxidative phosphorylation. With disease progression in the APOE ε3 genotype, brains were characterized by increases in metabolites related to oxidative DNA damage, changes in inhibitory neurotransmitters, disruptions of neuronal membranes, and decreases in metabolites related to acetylcholine synthesis. In early disease, the APOE 4 genotype was associated with increased metabolites related to poor kidney function and altered neuronal sterol metabolism, but there were few metabolic differences between APOE ε3 and ε4 genotypes in more severe AD.
The major differences between the metabolite composition of white-enriched matter and gray-enriched matter were characterized mainly by the metabolite components inherent to the myelin sheath present in the white-enriched matter. The myelin sheath is primarily comprised of lipids that insulate axons to speed action potentials, and it is not surprising that our data show that the top predictors for distinguishing grayenriched matter from white-enriched matter were all lipids. Alpha-hydroxylated cerebrosides are the most abundant lipids in the myelin sheath [33], and the myelin sheath has lower phosphatidylcholine to phosphatidylethanolamine ratio compared with grey matter due to its unique composition of myelin, which is consistent with our data. It is crucial to separate white-enriched matter from gray-enriched matter in brain metabolomics analyses so that differences found between samples are not confounded by the inherent differences between tissue types (and sample-to-sample differences in ratios of white and gray matter).
Previous studies investigating metabolomics changes in AD reported changes in phosphatidylcholine and acylcarnitine metabolism [34], taurine transport, bile acid synthesis, and cholesterol metabolism [10,11,35], lipids, sphingolipids (notably GM3 gangliosides) and lipid classes previously associated with cardiometabolic disease (phosphatidylethanolamine and triglycerides) [36,37]. Results using Metabolon’s untargeted assay showed changes in not only phospholipid, phosphatidylcholine, and fatty acid metabolism, but also the TCA cycle, pyrimidine, and several amino acids including aspartate, lysine, glycine, glutamate, creatine, histidine. In addition to the lipid changes found by others, these critical changes in amino acid, energy, and nucleotide could give important clues about the underlying disease mechanism of AD.
Separating our analysis by Braak NFT stages and APOE genotype allowed us to better understand the nuances of metabolite changes unique to the disease stage and genotype. As the disease progresses in the APOE 4 carriers, metabolites associated with reducing atherosclerosis and the TCA cycle and oxidative phosphorylation appeared to correlate with (and perhaps to drive) the differences between early- and late-stage AD. Previous studies have reported that age-related vascular changes accompany or even precede the development of AD pathology [38], and a plant-based diet can reduce atherosclerosis [39]. Also, the impaired energy production is consistent with the findings from preclinical trials that APOE ε4 carriers experienced weakened glucose metabolism in the brain [40,41]. It suggests that intervention targeting impaired glucose metabolism may be critical for AD treatment, and early mediation in APOE ε4 carriers can be an essential path to avert the risk of AD.
Further, it has been observed that the TCA cycle can regulate the pathogenesis of neuroinflammation and neurodegeneration [42]. Interestingly, TCA cycle metabolite decreases are statistically more significant in the gray matter than the white matter in the ε4 genotype, but the machine learning analysis revealed TCA cycle metabolites to be more critical in predicting AD in the white matter. While TCA cycle decreases are more commonly seen in late-stage gray matter E4 in general, when TCA cycle decreases are seen in white matter, they are more likely to be predictive of AD, whereas other metabolites in the gray matter are more predictive of AD.
As AD progresses in the APOE ε3 genotype, metabolites linked to oxidative DNA damage, changes in inhibitory neurotransmitters, disruptions of neuronal membranes, and decreases in metabolites related to acetylcholine synthesis were correlated best with the differences between early- and late-stage AD. Oxidative stress may participate in AD development by promoting Aβ deposition, tau hyperphosphorylation, and the subsequent loss of synapses and neurons [43]. There is evidence that the Mediterranean diet is protective against oxidative DNA damage [44]. There is growing evidence supporting GABAergic remodeling in the AD brain, potentially beginning in early stages of disease pathogenesis [45]. Alterations of fatty acids at the level of lipid rafts and cerebral lipid peroxidation were found in the early stage of AD [46]. Cholinergic neurons located in the basal forebrain, including the neurons comprising the nucleus basalis of Meynert, are severely lost in AD [47].
Separating by APOE genotype was an essential part of our analysis as the APOE ε4 genotype is the most common genetic risk factor for developing AD. At the early stage of disease, APOE ε4 carriers differed from APOE ε3/3 in metabolites related to poor kidney function and altered neuronal sterol metabolism. Older patients on hemodialysis are at substantial risk of diagnosis with dementia and Alzheimer’s disease [48]. APOE ε4-expressing cultured astrocytes and neurons have reduced cholesterol and phospholipid secretion, decreased lipid-binding capacity, and increased intracellular degradation [49]. This is likely due to the changed domain interaction with cholesterol receptors and less stable conformation of the APOE ε4 genotype that changes its involvement in lipid metabolism and neurobiology, thereby impacting neuronal repair, remodeling, and degeneration [50]. There were far fewer metabolic differences between APOE ε3 and ε4 genotypes in later disease stages. Genotype differences may be pronounced during early disease, but the disease course causes both genotypes to exhibit a similar biochemical profile as the disease progresses and neurons are lost. These genotype differences should be further explored to determine whether precision interventions, like the consumption of inulin or the administration of rapamycin, could be implemented for ε4 carriers [51,52].
Taken together, our current findings and those of previous reports suggest that maintaining normal brain glucose metabolism is critical for cognitive resilience; therefore, therapeutic strategies for preventing or treating AD may need to shift focus from Aβ toward the preservation and restoration of normal brain metabolism. Recently, aducanumab, an Aβ directed antibody, was granted accelerated approval to verify its clinical benefit for use in early AD after decades of failed drugs targeted at Aβ; it is possible that metabolic interventions could be used across the disease course to provide clinical benefit to patients. Interventions with a metabolic therapeutic strategy have been reported that use intranasal insulin administration and a ketogenic diet. Regarding the potential benefits of a ketogenic diet, ketone bodies can function as an alternative fuel substrate in the brain when glucose is unavailable or when glucose metabolism is impaired due to insulin resistance [53-56]. One study showed that a ketogenic diet could modulate the deposition of Aβ and Tau in the CSF of MCI patients in conjunction with its modulation of the gut microbiome and the production of short-chain fatty acids [57]. This finding is consistent with an animal study showing that a ketogenic diet enhanced Aβ clearance across the blood-brain barrier and improved the composition of the gut microbiome [58].
The gut microbiome produces secondary bile acids. As mentioned above, alterations of bile acid production have been observed in AD patients due to gut microbiome imbalances, suggesting another mechanism by which AD patients may benefit from therapeutic strategies aiming to restore normal brain metabolism like the ketogenic diet [59,60]. Another animal study showed that by modulating the gut microbiome with a prebiotic diet, mice with the human APOE ε4 gene had enhanced systemic metabolism and reduced neuroinflammatory gene expression, another hallmark of AD pathology [51,61]. Collectively, modulating metabolic function and the gut microbiome may profoundly impact reducing the risk of AD.
This study is limited by the characterization of samples from only one area of the brain. Furthermore, our population consisted of participants with dementias from mixed pathologies. Future studies that evaluate the serum of subjects may be helpful to assess potential systemic metabolomic changes in subjects and if the differences observed here are limited to brain tissue. Similarly, analyses of cell-sorted tissue could give additional resolution to the results. Furthermore, minimizing drug usage in subjects (about 9% of biochemicals in the named dataset were pharmaceuticals that included AD therapies such as donepezil and memantine and the anti-diabetic medication metformin) may provide additional clarity to the above observations.
In conclusion, our study shows that metabolite differences are associated with disease stage, genotype, and cognitive decline in AD. Further investigation in AD metabolomics may elucidate new insights into disease mechanisms and therapeutics with precision medicine approaches.
Contributions
T.C.H., X.X., L.M.Y., A.S., P.T.N., and A.-L.L. participated in study design. T.C.H., X.X., L.M.Y., Y.-H. C. and P.T.N. participated in human brain sample processing. T.C.H., X.X., A.S., and A.-L.L. participated in machine learning analyses. T.C.H., X.X., A.S., and A.-L.L. participated in Pearson correlation and statistical analyses. T.C.H., X.X., L.M.Y., Y.-H. C., A.S., P.T.N., and A.-L.L. participated in data verification and result interpretation. T.C.H., X.X., L.M.Y., Y.-H. C., A.S., P.T.N., and A.-L.L. participated in manuscript writing.
Funding
This research was supported by NIH grants R01AG054459 to A. NIH/NIA TRIAD grant training T32AG057461 to T.C.H., NIH/NIDDK Training Grant T32DK007778 to L.M.Y., and P30AG028383 to UK-ADRC Brain Bank.
References
2. Yin F, Sancheti H, Patil I, Cadenas E. Energy metabolism and inflammation in brain aging and Alzheimer’s disease. Free Radic Biol Med. 2016;100:108-22.
3. Belloy ME, Napolioni V, Greicius MD. A Quarter Century of APOE and Alzheimer’s Disease: Progress to Date and the Path Forward. Neuron. 2019;101(5):820-38.
4. Hammond TC, Xing X, Wang C, Ma D, Nho K, Crane PK, et al. betaamyloid and tau drive early Alzheimer’s disease decline while glucose hypometabolism drives late decline. Commun Biol. 2020;3(1):352.
5. Pini L, Pievani M, Bocchetta M, Altomare D, Bosco P, Cavedo E, et al. Brain atrophy in Alzheimer’s Disease and aging. Ageing Res Rev. 2016;30:25-48.
6. Klosinski LP, Yao J, Yin F, Fonteh AN, Harrington MG, Christensen TA, et al. White Matter Lipids as a Ketogenic Fuel Supply in Aging Female Brain: Implications for Alzheimer’s Disease. EBioMedicine. 2015;2(12):1888-904.
7. Yu Y, Herman P, Rothman DL, Agarwal D, Hyder F. Evaluating the gray and white matter energy budgets of human brain function. Journal of cerebral blood flow and metabolism : official journal of the International Society of Cerebral Blood Flow and Metabolism. 2018;38(8):1339-53.
8. Morland C, Henjum S, Iversen EG, Skrede KK, Hassel B. Evidence for a higher glycolytic than oxidative metabolic activity in white matter of rat brain. Neurochem Int. 2007;50(5):703-9.
9. Varma VR, Oommen AM, Varma S, Casanova R, An Y, Andrews RM, et al. Brain and blood metabolite signatures of pathology and progression in Alzheimer disease: A targeted metabolomics study. PLoS Med. 2018;15(1):e1002482.
10. Baloni P, Funk CC, Yan J, Yurkovich JT, Kueider-Paisley A, Nho K, et al. Metabolic Network Analysis Reveals Altered Bile Acid Synthesis and Metabolism in Alzheimer’s Disease. Cell Rep Med. 2020;1(8):100138.
11. Wang J, Wei R, Xie G, Arnold M, Kueider-Paisley A, Louie G, et al. Peripheral serum metabolomic profiles inform central cognitive impairment. Scientific reports. 2020;10(1):14059.
12. Schmitt FA, Davis DG, Wekstein DR, Smith CD, Ashford JW, Markesbery WR. “Preclinical” AD revisited: neuropathology of cognitively normal older adults. Neurology. 2000;55(3):370-6.
13. Bancher C, Braak H, Fischer P, Jellinger KA. Neuropathological staging of Alzheimer lesions and intellectual status in Alzheimer’s and Parkinson’s disease patients. Neurosci Lett. 1993;162(1-2):179-82.
14. Jaarsma D, Veenma-van der Duin L, Korf J. N-acetylaspartate and N-acetylaspartylglutamate levels in Alzheimer’s disease postmortem brain tissue. J Neurol Sci. 1994;127(2):230-3.
15. Zhao Y, Dai XY, Zhou Z, Zhao GX, Wang X, Xu MJ. Leucine supplementation via drinking water reduces atherosclerotic lesions in apoE null mice. Acta Pharmacol Sin. 2016;37(2):196-203.
16. Chun J, Goetzl EJ, Hla T, Igarashi Y, Lynch KR, Moolenaar W, et al. International Union of Pharmacology. XXXIV. Lysophospholipid Receptor Nomenclature. Pharmacological Reviews. 2002;54(2):265-9.
17. Fujii A, Allen TJ, Nestel PJ. A 1,3-diacylglycerol-rich oil induces less atherosclerosis and lowers plasma cholesterol in diabetic apoEdeficient mice. Atherosclerosis. 2007;193(1):55-61.
18. Kennedy MB. Synaptic Signaling in Learning and Memory. Cold Spring Harb Perspect Biol. 2013;8(2):a016824.
19. Neale JH, Olszewski R. A role for N-acetylaspartylglutamate (NAAG) and mGluR3 in cognition. Neurobiol Learn Mem. 2019;158:9-13.
20. van der Velpen V, Teav T, Gallart-Ayala H, Mehl F, Konz I, Clark C, et al. Systemic and central nervous system metabolic alterations in Alzheimer’s disease. Alzheimers Res Ther. 2019;11(1):93.
21. Chyan YJ, Poeggeler B, Omar RA, Chain DG, Frangione B, Ghiso J, et al. Potent neuroprotective properties against the Alzheimer beta-amyloid by an endogenous melatonin-related indole structure, indole-3-propionic acid. J Biol Chem. 1999;274(31):21937-42.
22. He B, Nohara K, Ajami NJ, Michalek RD, Tian X, Wong M, et al. Transmissible microbial and metabolomic remodeling by soluble dietary fiber improves metabolic homeostasis. Sci Rep. 2015;5:10604.
23. Wang G, Zhou Y, Huang FJ, Tang HD, Xu XH, Liu JJ, et al. Plasma metabolite profiles of Alzheimer’s disease and mild cognitive impairment. J Proteome Res. 2014;13(5):2649-58.
24. Hipkiss AR. Could carnosine or related structures suppress Alzheimer’s disease? Journal of Alzheimer’s disease : JAD. 2007;11(2):229-40.
25. Dere E, Zlomuzica A, De Souza Silva MA, Ruocco LA, Sadile AG, Huston JP. Neuronal histamine and the interplay of memory, reinforcement and emotions. Behav Brain Res. 2010;215(2):209-20.
26. Choudhary AK, Lee YY. The debate over neurotransmitter interaction in aspartame usage. J Clin Neurosci. 2018;56:7-15.
27. Jenkins TA, Nguyen JC, Polglaze KE, Bertrand PP. Influence of Tryptophan and Serotonin on Mood and Cognition with a Possible Role of the Gut-Brain Axis. Nutrients. 2016;8(1).
28. Yoshida Y, Yoshikawa A, Kinumi T, Ogawa Y, Saito Y, Ohara K, et al. Hydroxyoctadecadienoic acid and oxidatively modified peroxiredoxins in the blood of Alzheimer’s disease patients and their potential as biomarkers. Neurobiol Aging. 2009;30(2):174-85.
29. Lind A, Boraxbekk CJ, Petersen ET, Paulson OB, Siebner HR, Marsman A. Regional Myo-Inositol, Creatine, and Choline Levels Are Higher at Older Age and Scale Negatively with Visuospatial Working Memory: A Cross-Sectional Proton MR Spectroscopy Study at 7 Tesla on Normal Cognitive Ageing. The Journal of neuroscience : the official journal of the Society for Neuroscience. 2020;40(42):8149-59.
30. Blusztajn JK, Lopez Gonzalez-Coviella I, Logue M, Growdon JH, Wurtman RJ. Levels of phospholipid catabolic intermediates, glycerophosphocholine and glycerophosphoethanolamine, are elevated in brains of Alzheimer’s disease but not of Down’s syndrome patients. Brain Res. 1990;536(1-2):240-4.
31. Velenosi TJ, Thomson BKA, Tonial NC, RaoPeters AAE, Mio MA, Lajoie GA, et al. Untargeted metabolomics reveals N, N, N-trimethyl- L-alanyl-L-proline betaine (TMAP) as a novel biomarker of kidney function. Scientific reports. 2019;9(1):6831.
32. Suri S, Emir U, Stagg CJ, Near J, Mekle R, Schubert F, et al. Effect of age and the APOE gene on metabolite concentrations in the posterior cingulate cortex. Neuroimage. 2017;152:509-16.
33. Eckhardt M, Yaghootfam A, Fewou SN, Zoller I, Gieselmann V. A mammalian fatty acid hydroxylase responsible for the formation of alpha-hydroxylated galactosylceramide in myelin. Biochem J. 2005;388(Pt 1):245-54.
34. Nho K, Kueider-Paisley A, Arnold M, MahmoudianDehkordi S, Risacher SL, Louie G, et al. Serum Metabolites Associated with Brain Amyloid Beta Deposition, Cognitive Dysfunction, and Alzheimer’s Disease Progression. bioRxiv. 2020:2020.11.25.394262.
35. Kling MA, Goodenowe DB, Senanayake V, MahmoudianDehkordi S, Arnold M, Massaro TJ, et al. Circulating ethanolamine plasmalogen indices in Alzheimer’s disease: Relation to diagnosis, cognition, and CSF tau. Alzheimer’s & dementia : the journal of the Alzheimer’s Association. 2020;16(9):1234-47.
36. Huynh K, Lim WLF, Giles C, Jayawardana KS, Salim A, Mellett NA, et al. Concordant peripheral lipidome signatures in two large clinical studies of Alzheimer’s disease. Nat Commun. 2020;11(1):5698.
37. Zhao N, Ren Y, Yamazaki Y, Qiao W, Li F, Felton LM, et al. Alzheimer’s Risk Factors Age, APOE Genotype, and Sex Drive Distinct Molecular Pathways. Neuron. 2020;106(5):727-42 e6.
38. Cortes-Canteli M, Iadecola C. Alzheimer’s Disease and Vascular Aging: JACC Focus Seminar. J Am Coll Cardiol. 2020;75(8):942-51.
39. Tuso P, Stoll SR, Li WW. A plant-based diet, atherogenesis, and coronary artery disease prevention. Perm J. 2015;19(1):62-7.
40. Wu L, Zhang X, Zhao L. Human ApoE Isoforms Differentially Modulate Brain Glucose and Ketone Body Metabolism: Implications for Alzheimer’s Disease Risk Reduction and Early Intervention. The Journal of neuroscience. 2018;38(30):6665-81.
41. Reiman EM, Chen K, Alexander GE, Caselli RJ, Bandy D, Osborne D, et al. Correlations between apolipoprotein E epsilon4 gene dose and brain-imaging measurements of regional hypometabolism. Proc Natl Acad Sci U S A. 2005;102(23):8299-302.
42. Garabadu D, Agrawal N, Sharma A, Sharma S. Mitochondrial metabolism: a common link between neuroinflammation and neurodegeneration. Behav Pharmacol. 2019;30(8):642-52.
43. Chen Z, Zhong C. Oxidative stress in Alzheimer’s disease. Neurosci Bull. 2014;30(2):271-81.
44. Del Bo C, Marino M, Martini D, Tucci M, Ciappellano S, Riso P, et al. Overview of Human Intervention Studies Evaluating the Impact of the Mediterranean Diet on Markers of DNA Damage. Nutrients. 2019;11(2).
45. Calvo-Flores Guzman B, Vinnakota C, Govindpani K, Waldvogel HJ, Faull RLM, Kwakowsky A. The GABAergic system as a therapeutic target for Alzheimer’s disease. J Neurochem. 2018;146(6):649-69.
46. Kao YC, Ho PC, Tu YK, Jou IM, Tsai KJ. Lipids and Alzheimer’s Disease. Int J Mol Sci. 2020;21(4).
47. Ferreira-Vieira TH, Guimaraes IM, Silva FR, Ribeiro FM. Alzheimer’s disease: Targeting the Cholinergic System. Curr Neuropharmacol. 2016;14(1):101-15.
48. McAdams-DeMarco MA, Daubresse M, Bae S, Gross AL, Carlson MC, Segev DL. Dementia, Alzheimer’s Disease, and Mortality after Hemodialysis Initiation. Clin J Am Soc Nephrol. 2018;13(9):1339-47.
49. Mahley RW. Central Nervous System Lipoproteins: ApoE and Regulation of Cholesterol Metabolism. Arterioscler Thromb Vasc Biol. 2016;36(7):1305-15.
50. Huang Y, Mahley RW. Apolipoprotein E: structure and function in lipid metabolism, neurobiology, and Alzheimer’s diseases. Neurobiology of disease. 2014;72 Pt A:3-12.
51. Yanckello LM, Hoffman JD, Chang YH, Lin P, Nehra G, Chlipala G, et al. Apolipoprotein E genotype-dependent nutrigenetic effects to prebiotic inulin for modulating systemic metabolism and neuroprotection in mice via gut-brain axis. Nutr Neurosci. 2021:1-11.
52. Lin AL, Parikh I, Yanckello LM, White RS, Hartz AMS, Taylor CE, et al. APOE genotype-dependent pharmacogenetic responses to rapamycin for preventing Alzheimer’s disease. Neurobiol Dis. 2020;139:104834.
53. Wang Y, Brinton RD. Triad of Risk for Late Onset Alzheimer’s: Mitochondrial Haplotype, APOE Genotype and Chromosomal Sex. Front Aging Neurosci. 2016;8:232.
54. Riedel BC, Thompson PM, Brinton RD. Age, APOE and sex: Triad of risk of Alzheimer’s disease. J Steroid Biochem Mol Biol. 2016;160:134-47.
55. Lin AL, Zhang W, Gao X, Watts L. Caloric restriction increases ketone bodies metabolism and preserves blood flow in aging brain. Neurobiol Aging. 2015;36(7):2296-303.
56. Zhang Y, Kuang Y, Xu K, Harris D, Lee Z, LaManna J, et al. Ketosis proportionately spares glucose utilization in brain. Journal of cerebral blood flow and metabolism : official journal of the International Society of Cerebral Blood Flow and Metabolism. 2013;33(8):1307-11.
57. Nagpal R, Neth BJ, Wang S, Craft S, Yadav H. Modified Mediterranean-ketogenic diet modulates gut microbiome and shortchain fatty acids in association with Alzheimer’s disease markers in subjects with mild cognitive impairment. EBioMedicine. 2019.
58. Ma D, Wang AC, Parikh I, Green SJ, Hoffman JD, Chlipala G, et al. Ketogenic diet enhances neurovascular function with altered gut microbiome in young healthy mice. Scientific reports. 2018;8(1):6670.
59. MahmoudianDehkordi S, Arnold M, Nho K, Ahmad S, Jia W, Xie G, et al. Altered bile acid profile associates with cognitive impairment in Alzheimer’s disease-An emerging role for gut microbiome. Alzheimers Dement. 2019;15(1):76-92.
60. Nho K, Kueider-Paisley A, MahmoudianDehkordi S, Arnold M, Risacher SL, Louie G, et al. Altered bile acid profile in mild cognitive impairment and Alzheimer’s disease: Relationship to neuroimaging and CSF biomarkers. Alzheimers Dement. 2019;15(2):232-44.
61. Hoffman JD, Yanckello LM, Chlipala G, Hammond TC, McCulloch SD, Parikh I, et al. Dietary inulin alters the gut microbiome, enhances systemic metabolism and reduces neuroinflammation in an APOE4 mouse model. PLoS One. 2019;14(8):e0221828.