Abstract
Cardiotoxicity is a well-known side-effect for the patients who are treated with different classes of anticancer drugs. In order to prevent potential drug-induced adverse effects, it is crucial to develop predictable human-based models and assays for drug screening. To that end, human induced pluripotent stem cell-derived cardiomyocytes (hiPSC-CMs) are becoming promising and important for disease modeling and drug-induced toxicity screening.
It is, however, a challenge to set up a fully automated high-throughput screening and analysis system especially geared for cardiotoxicity analysis on hiPSC-CMs. The major obstacle is to handle clustered cell growth patterns as well as strong intracellular and intercellular variation of a fluorescent signal.
We reported on the development of a fully automated image analysis system for quantification of cardiotoxic phenotypes from hiPSCCMs which are treated with varied concentrations of two anticancer drugs: doxorubicin and crizotinib.
We make use of signals from the nuclear channel and the a-actinin channel so as to segment single-cells by propagating segmented single nuclear region in the cardiac a-actinin region. In order to manage the heterogeneous a-actinin signals, we use enhanced fuzzy C-mean clustering to segment cardiac a-actinin signal. Compared to manual segmentation, our approach generates precision and recall scores of 0.81 and 0.93, respectively. The results show the reliability of our single-cell segmentation method even with heterogeneous a-actinin signals. We further quantify related phenotypes for each single cardiomyocyte. This fully automated image analysis system is dedicated to analyze high-throughput images and is capable of determining cardiotoxicity based on phenotypic changes in hiPSC-CMs.
Keywords
Cardiotoxicity, hiPSC-derived cardiomyocytes, High-throughput screening, Image analysis, Phenotype quantification
Introduction
Severe cardiotoxic side-effects are found in patients who are treated with anti-cancer drugs from both earliest chemotherapeutics (for example anthracyclines, such as Doxorubicin [1]) and novel therapeutic compounds, such as monoclonal antibodies and small molecules inhibiting tyrosine kinases; e.g. crizotinib [2]. During the drug development process, cardiotoxicity is mainly evaluated on non-human animal models which cannot adequately represent human biology. On the other hand, over a decade of development, the differentiation efficiency of HiPSC to specialized cell types, including functional cardiomyocytes, has been raised enormously. Furthermore, the importance of hiPSC-derived cardiomyocytes (hiPSC-CMs) for disease modeling and drug-induced toxicity screenings has been indicated by many studies [3-5].
High-throughput image analysis has been shown as a valuable method for molecules and drugs identification. It is a powerful method to alleviate labor and reduce computation time. Recently, high-throughput image analysis has been used for cardiotoxicity study [1,6,7]. However, all studies using hiPSC-CMs involved manual steps and cannot be used to perform fully automated analysis on the single cell level, mainly due to the fact that the signal of stained hiPSC-CMs is so heterogeneous.
We designed a fully automated image analysis system [8] for cardiotoxicity analysis. Cardiotoxic phenotypes were measured in image datasets obtained from immunofluorescence imaging of an α-actinin in hiPSCCMs in a high-throughput setting. In our approach we specifically applied an enhanced Fuzzy c-mean clustering algorithm in order to automatically take into consideration of signal heterogeneity of hiPSC-CMs in terms of α-actinin signal. We demonstrated proof-of-concept by showing cardiotoxic effects of doxorubicin and crizotinib. The segmentation result shows a close correlation with manual annotation.
Methods
Cell preparation and imaging
hiPSC-CMs (Pluriomics BV, The Netherlands) were obtained at day 14 of differentiation. The cells were seeded in a 96-well plate. The cell density for each well was 10,000. This is an optimized cell-density level based on our previous testing experiment. The cells were refreshed every other day with Cardiomyocyte medium (Pluriomics BV) and used for treatment on day 9 after seeding.
hiPSC-CMs were treated with dimethylsulfoxide (DMSO 4.23 mM) as control. For treated condition, hiPSC-CMs were exposed to doxorubicin or crizotinib with 0.1 μM, 0.3μM, 1 μM, 3 μM and 10 μM for 4 days. Subsequently, cells were fixed at room temperature. An antibody against α-actinin, was used to identify cardiomyocytes, displaying its specific striated pattern [6]. This cardiomyocyte protein is important for evaluation of phenotypic maturity of hiPSC-CMs [9]. In addition, it provides additional information on cell morphology. Nuclei were stained with DAPI.
High throughput screening of cardiomyocytes was realized using a high-throughput, high-content imaging BD-pathway 855 microscope. The red-channel was used for the α-actinin signal and the blue-channel was used for the cell nuclei. The whole monolayer cell culture was scanned through 7×7 (width × height) adjacent image tiles that were stitched to one montage image of 4700×3600 pixels.
Image analysis
The image analysis pipeline is depicted in Figure 1, is specifically designed to segment the single cardiomyocytes in the image with α-actinin and DAPI staining. Subsequently, the phenotype quantification of single cells can be realized.
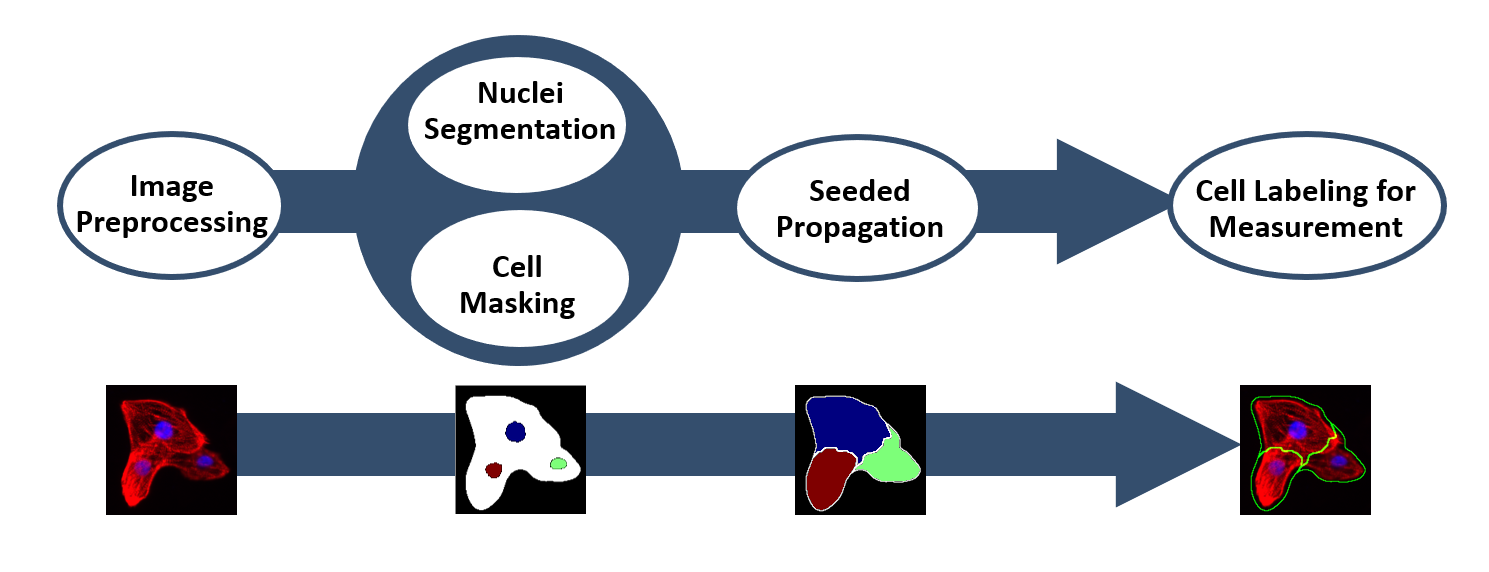
Prior to the segmentation procedure, several standard image preprocessing steps were applied to reduce the noise from the background and enhance the foreground signal. The segmentation procedure contains three main steps.
First, single nuclei are detected. Due to the fact that DAPI signal is quite strong and homogeneous, we used the Otsu thresholding method [10] to segment the DAPI stained nuclei. Subsequently, individual nuclei were caged using a watershed segmentation method based on the distance transformation.
Second, we identified the positive α-actinin signal in the red-channel. We observed that α-actinin signal is highly heterogenous and the Otsu thresholding method cannot segment the signal sufficiently because of its low tolerance with intensity variance [11,12]. Instead, a machine learning based segmentation method with a higher tolerance to the intensity variation, known as Fuzzy C-Means Clustering Algorithm (FCM) [13] is invoked. It is specifically selected for the thresholding of the redchannel. The FCM Algorithm, however, takes huge amount of computation time to segment our high-resolution image dataset. In order to solve the problems with computational load, several improved versions based on FCM have been reported [14]. We have chosen an accelerated version of the FCM Algorithm called EnFCM [15] to speed up the segmentation of α-actinin signal.
Lastly, individual cells were identified using a nuclear propagation approach [16]. We used single nuclei as the initial seeds and propagated in the α-actinin cell region until it reaches the border by comparing both intensity and distance of the neighborhood pixels.
Segmentation performance assessment
Regarding the segmentation performance, a qualitative assessment was primarily set out by comparing segmentation results of our method and a representative Otsu-based segmentation method [1] in our image dataset. Subsequently, a quantitative assessment was performed by comparing the results of the developed method with manual segmentation results. Two scientists with and without the knowledge of cardiotoxicity study were asked to independently segment the individual cells from 15 cropped images with 232 cells in total. Finally, we used the F-score to assess the accuracy of the segmentation methods [17]. We computed the F-score for our method, Otsu-based segmentation method [1] and the two manually segmented results for comparison.
Phenotype measurement
We included a list of phenotype measurements on the level of single cells in order to depict the phenotype changes between different treatment conditions. The measurements include shape measurements, texture measurements and other cardiotoxicity related measurements, e.g. cellcell contact [1]. Each treated condition was compared with control (DMSO) condition using the two-sample Kolmogorov-Smirnov test [18]; i.e. P<0.05 was considered as significant.
Results
Cell segmentation performance assessment
In order to assess the performance of our segmentation method, we started with evaluating the performance of cell masking for the α-actinin signal which was the biggest challenge in our study. We compared our method with a conventional Otsu-based method [1]. It turns out that our method is able to identify strong and weak signals better than Otsu-based method. In addition, we quantify the performance of the segmentation methods by using manually segmentation results as ground truth. The overall segmentation performance is represented by an F-score as shown in Table 1. We observed that the F-score is significantly improved from 71.89% using the conventional method to 86.54% using our method. It should be noted that our method is applied on human cardiomyocytes and uses high-resolution images as input.
| Precision | Recall | F-Score | ||
|---|---|---|---|---|
| Otsu-based method | Mean/SEM | 0.9727/0.0051 | 0.5826/0.0352 | .Otsu-based method |
| Our method | Mean/SEM | 0.8139/0.0119 | 0.9291/0.0116 | Our method |
Result of phenotype measurements
We applied our high-throughput image analysis pipeline on a dataset of 120 high resolution images of hiPSC-CMs with varied treatment. We had five replicates for each condition and did the experiment on two batches of cells at two individual plates. We used two anticancer drugs doxorubicin (a classical anthracycline antibiotic) and crizotinib (a novel tyrosine kinase inhibitor) to perform the dose-response studies.
Cell viability was represented by the number of cardiomyocytes in the image as shown in Figure 2A. Cell number was reduced with increasing concentrations of both drugs. The results implied that both doxorubicin and crizotinib led to cardiomyocyte loss at concentrations less than 10 μM.
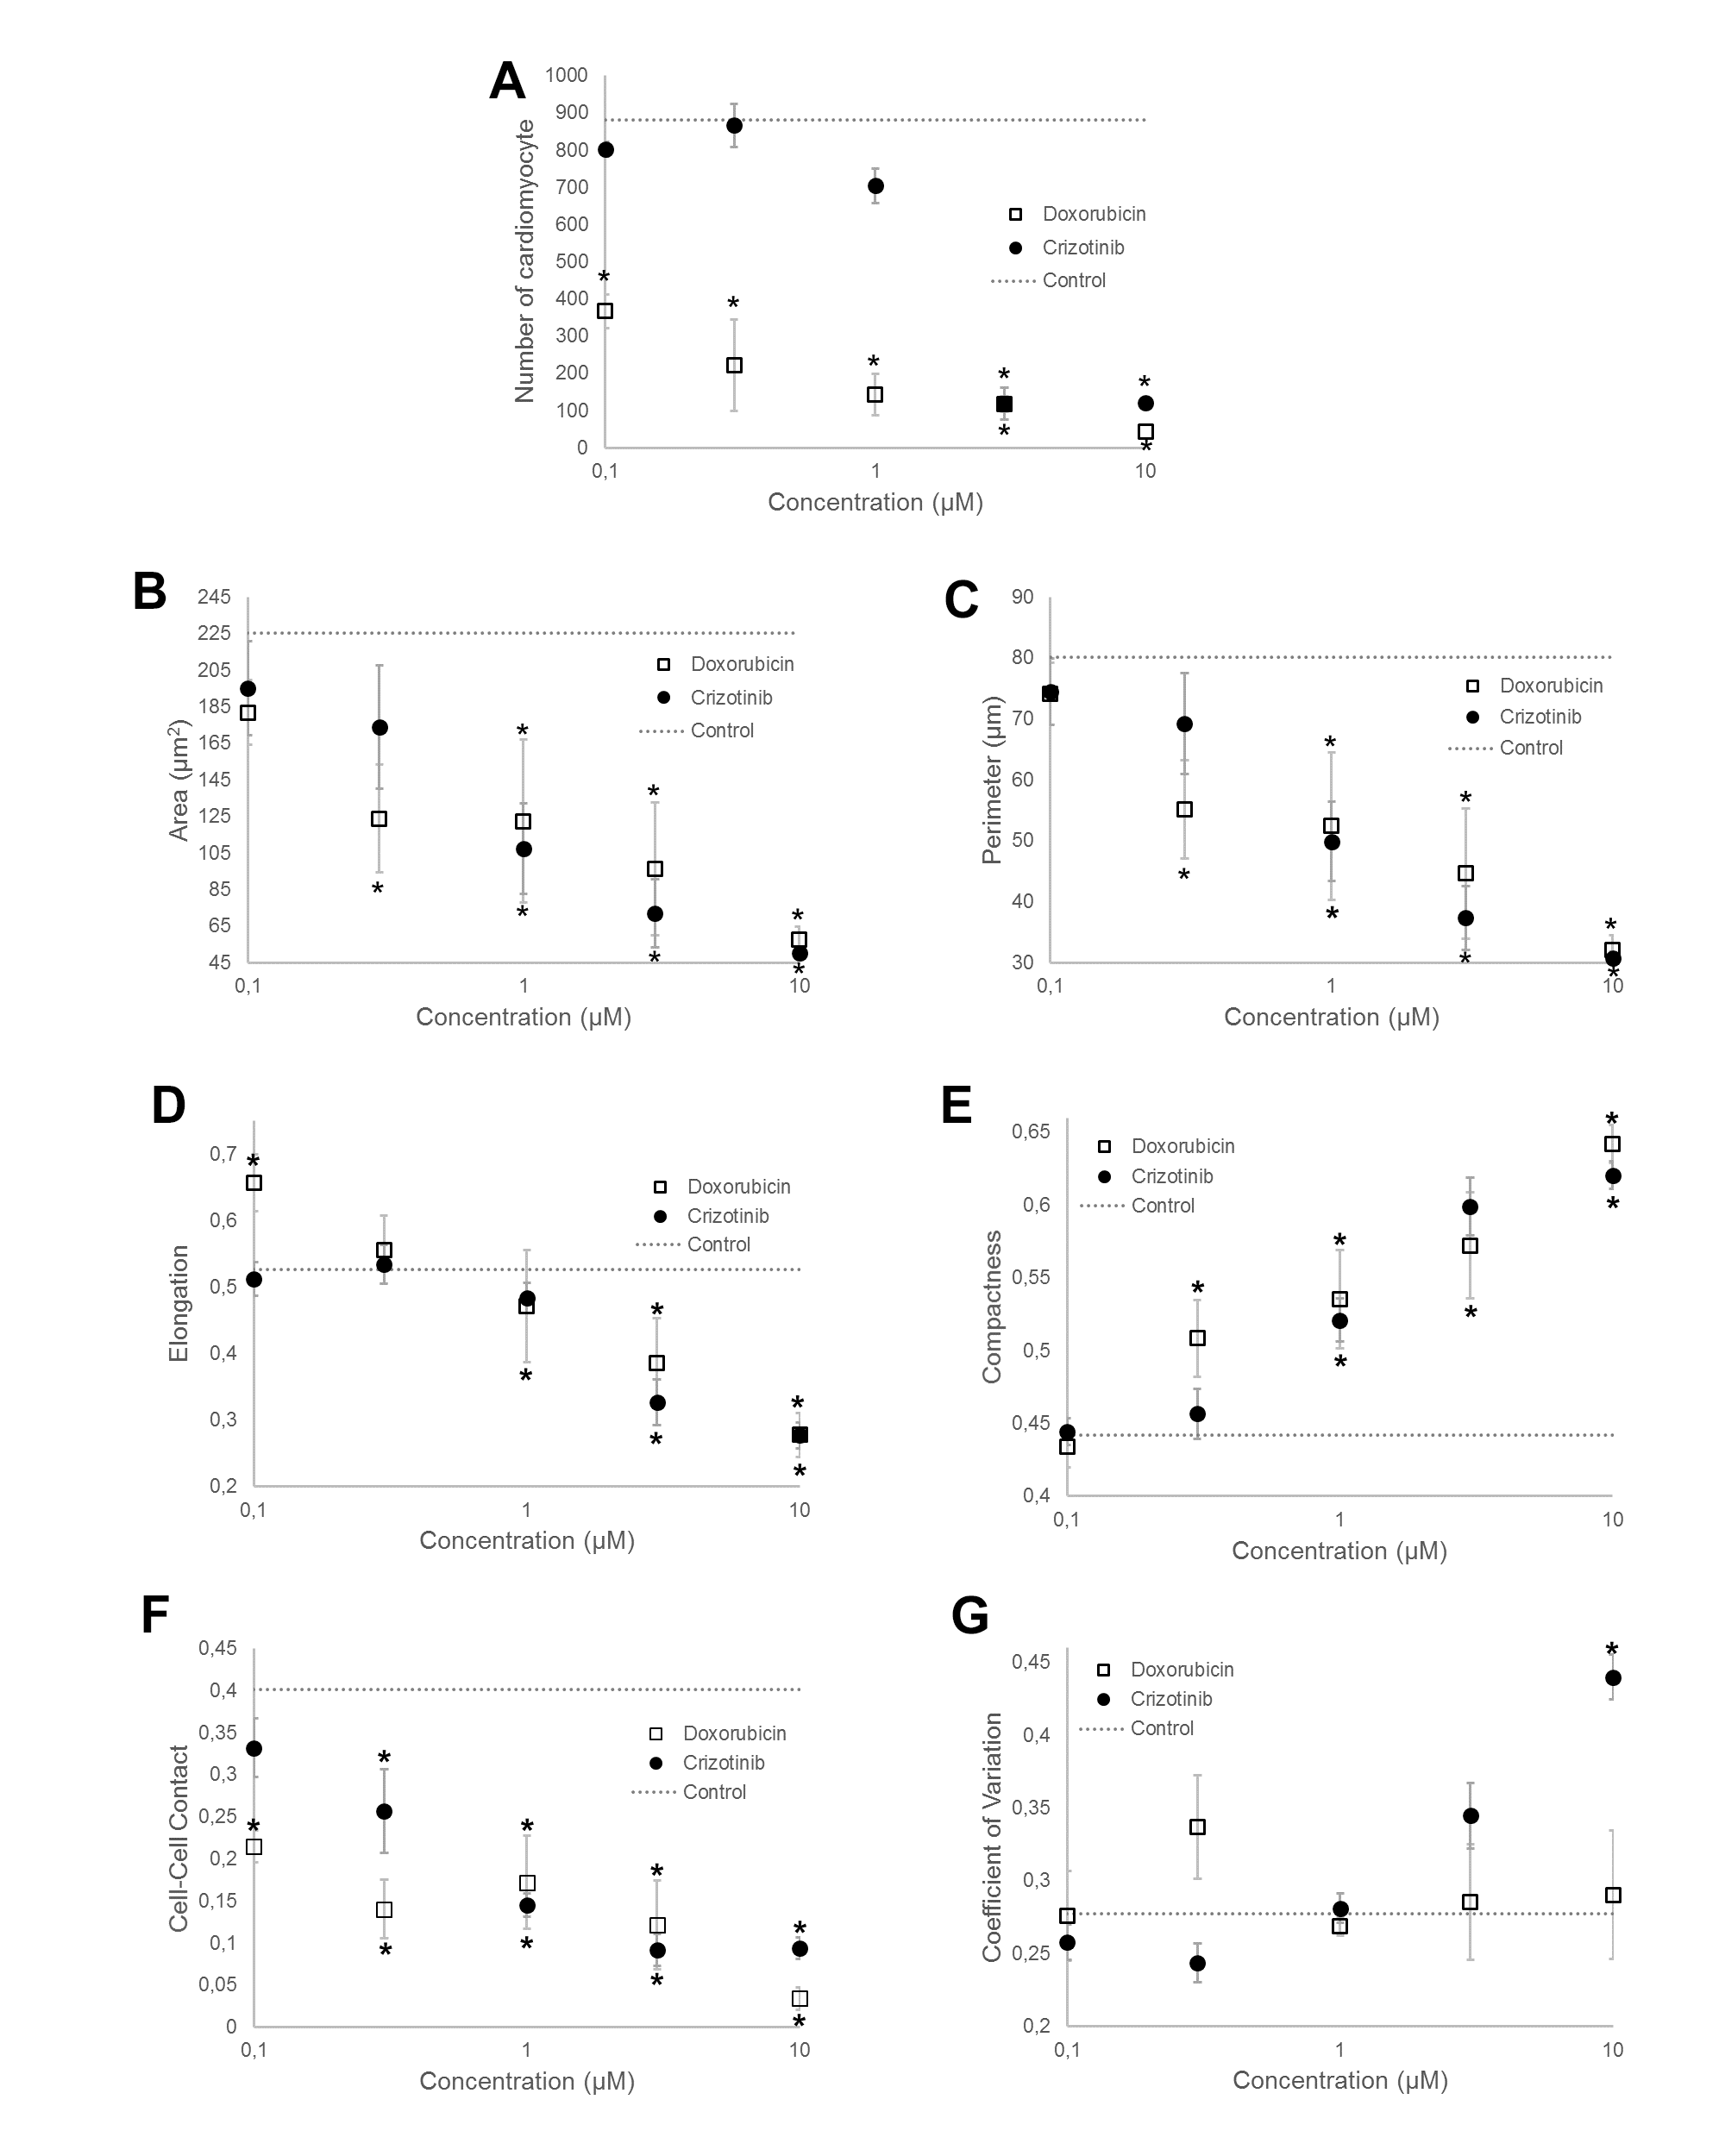
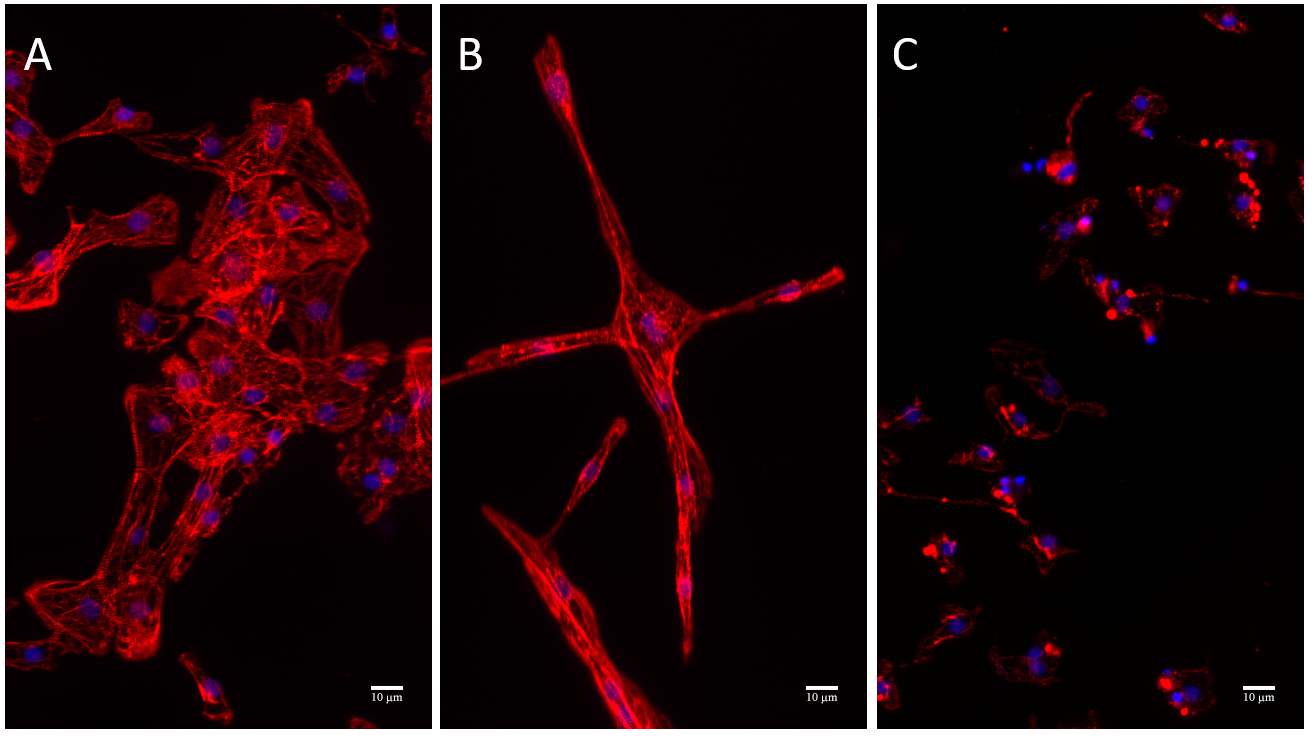
Shape descriptors were used to depict the cardiotoxicrelated morphological changes as depicted in Figure 2B-E and Figure 3. Cell area decreased with increasing dose concentration for both drugs. Doxorubicin-treated cells demonstrated an elongated spindle-like cellular morphology as indicated by increasing elongation [19]. At the higher concentrations of both drugs (3 μM and 10 μM), elongation was decreased since cells became smaller and more circular, which would typically be a sign of dying.
Moreover, we observed a significant reduction in cell-cell contacts as shown in Figure 2F after administration of the drugs. It corresponded with our observation that healthy cardiomyocytes form a tight network [20] while low viability cells tend to lose contact and die. Other phenotype measurements such as texture features were also measured to help depict the cardiotoxic-related changes in the cell.
Discussion
We developed a fully automated image analysis system for cardiotoxicity study. It reliably segments cells and extracts cardiotoxic-related phenotype measurements from each single cell. After treating the cells with two representative anti-cancer drugs i.e. doxorubicin and crizotinib, we observed the loss of cardiomyocytes at increasing drug concentrations. Morphological and texture features were quantified to provide a better insight on different aspects of drug-induced cardiomyocyte toxicity from different classes of anticancer drugs.
Our image analysis system is essentially helpful for drug testing on cardiotoxicity which is required for all drugs before entering clinical trials. Furthermore, the Food and Drug Administration (FDA) is in favor for performing these tests in human stem cell-based assays [21]. This high-throughput assay could be further enhanced by combining with other high-throughput assays using functional and biochemical parameters, such as cardiomyocyte contractility, electrophysiology, calcium signaling and mitochondrial activity [22]. By combining these high-throughput assays, we can collect a profound set of features to form a fingerprint so as to describe the phenotype variations of hiPSC-CMs in response to varied drugs and cardiac diseases.
For future works, we will continue developing image analysis systems for different assays or high-throughput setups in the cardiotoxicity study. One main focus will be identifying organized sarcomere structures and disrupted sarcomere structures from the image. In addition, we will explore deep- learning models, especially segmentation methods based on Convolutional Neural Network (CNN) such as U-Net [23] and Mask-RCNN [24]. We intend to include deep nets in our standardized pipeline. Last but not least, our research will include an assessment for distributed computing so as to balance the computational load between GPU and CPU.
References
2. Tartarone A, Gallucci G, Lazzari C, Lerose R, Lombardi L, Aieta M. Crizotinib-induced cardiotoxicity: the importance of a proactive monitoring and management. Future Oncology. 2015 Jul;11(14):2043-8.
3. Anson BD, Kolaja KL, Kamp TJ. Opportunities for use of human iPS cells in predictive toxicology. Clinical Pharmacology & Therapeutics. 2011 May;89(5):754-8.
4. Burridge PW, Li YF, Matsa E, Wu H, Ong SG, Sharma A, et al. Human induced pluripotent stem cell–derived cardiomyocytes recapitulate the predilection of breast cancer patients to doxorubicin-induced cardiotoxicity. Nature Medicine. 2016 May;22(5):547.
5. Sinnecker D, Laugwitz KL, Moretti A. Induced pluripotent stem cell-derived cardiomyocytes for drug development and toxicity testing. Pharmacology & Therapeutics. 2014 Aug 1;143(2):246-52.
6. Doherty KR, Wappel RL, Talbert DR, Trusk PB, Moran DM, Kramer JW, et al. Multi-parameter in vitro toxicity testing of crizotinib, sunitinib, erlotinib, and nilotinib in human cardiomyocytes. Toxicology and Applied Pharmacology. 2013 Oct 1;272(1):245-55.
7. Földes G, Mioulane M, Wright JS, Liu AQ, Novak P, Merkely B, et al. Modulation of human embryonic stem cell-derived cardiomyocyte growth: a testbed for studying human cardiac hypertrophy?. Journal of Molecular and Cellular Cardiology. 2011 Feb 1;50(2):367-76.
8. Cao L, der Meer AD, Verbeek FJ, Passier R. Automated image analysis system for studying cardiotoxicity in human pluripotent stem cell-Derived cardiomyocytes. BMC Bioinformatics. 2020 Dec;21:1-2.
9. Pasqualini FS, Sheehy SP, Agarwal A, Aratyn-Schaus Y, Parker KK. Structural phenotyping of stem cell-derived cardiomyocytes. Stem Cell Reports. 2015 Mar 10;4(3):340- 7.
10. Otsu N. A threshold selection method from gray-level histograms. IEEE Transactions on Systems, Man, and Cybernetics. 1979 Jan;9(1):62-6.
11. Kumar S, Ahirwar R, Jain YK. Efficient 3-class fuzzy c-means clustering algorithm with thresholding for effective medical image segmentation. The International Journal of Emerging Technology and Advanced Engineering. 2014;4(10).
12. Lee H, Chen YP. Skin cancer extraction with optimum fuzzy thresholding technique. Applied Intelligence. 2014 Apr 1;40(3):415-26.
13. Ahmed MN, Yamany SM, Mohamed N, Farag AA, Moriarty T. A modified fuzzy c-means algorithm for bias field estimation and segmentation of MRI data. IEEE Transactions on Medical Imaging. 2002 Mar;21(3):193-9.
14. Cai W, Chen S, Zhang D. Fast and robust fuzzy c-means clustering algorithms incorporating local information for image segmentation. Pattern Recognition. 2007 Mar 1;40(3):825-38.
15. Szilagyi L, Benyo Z, Szilágyi SM, Adam HS. MR brain image segmentation using an enhanced fuzzy c-means algorithm. InProceedings of the 25th annual international conference of the IEEE engineering in medicine and biology society (IEEE Cat. No. 03CH37439) 2003 Sep 17 (Vol. 1, pp. 724-726). IEEE.
16. Jones TR, Carpenter A, Golland P. Voronoi-based segmentation of cells on image manifolds. InInternational Workshop on Computer Vision for Biomedical Image Applications 2005 Oct 21 (pp. 535-543). Springer, Berlin, Heidelberg.
17. Du X, Dua S. Segmentation of fluorescence microscopy cell images using unsupervised mining. The Open Medical Informatics Journal. 2010;4:41.
18. Massey Jr FJ. The Kolmogorov-Smirnov test for goodness of fit. Journal of the American statistical Association. 1951 Mar 1;46(253):68-78.
19. Dunn GA, Brown AF. Alignment of fibroblasts on grooved surfaces described by a simple geometric transformation. Journal of Cell Science. 1986 Jul 1;83(1):313- 40.
20. Staudt DW, Liu J, Thorn KS, Stuurman N, Liebling M, Stainier DY. High-resolution imaging of cardiomyocyte behavior reveals two distinct steps in ventricular trabeculation. Development. 2014 Feb 1;141(3):585-93.
21. Colatsky T, Fermini B, Gintant G, Pierson JB, Sager P, Sekino Y, Strauss DG, Stockbridge N. The comprehensive in vitro proarrhythmia assay (CiPA) initiative—update on progress. Journal of Pharmacological and Toxicological Methods. 2016 Sep 1;81:15-20.
22. van Meer BJ, Tertoolen LG, Mummery CL. Concise review: measuring physiological responses of human pluripotent stem cell derived cardiomyocytes to drugs and disease. Stem Cells. 2016 Aug;34(8):2008-15.
23. Ronneberger O, Fischer P, Brox T. U-net: Convolutional networks for biomedical image segmentation. In Navab N, Hornegger J, Wells WM, Frangi AF, (Eds), Medical Image Computing and Computer-Assisted Intervention – MICCAI. 2015. Pp. 234-241, Springer International Publishing, Cham.
24. He K, Gkioxari G, Dollár P, Ross B. Girshick. Mask r-cnn. InProceedings of the IEEE International Conference on Computer Vision 2017 (pp. 2961-2969).