Abstract
Atrial fibrillation (AF) is the most common cardiac arrhythmia worldwide. The prevalence of AF increases significantly associated with increasing age, ranging from less than 0.5% of the population younger than 40 to 5% of those aged 65 and older and more than 10% of those surviving to the eighth decade of life. Therefore, AF is thought to be closely related to biological ageing. Telomeres (TL), repetitive DNA elements located at the ends of chromosomes, have been implicated as potential mediators of biological aging. TL is generally measured in leucocytes due to the easy accessibility of these cells in peripheral blood. Whether a causal effect of leucocytes TL (LTL) on AF is not clear. We used two-sample MR analysis model to evaluate the causal effect of LTL on AF. The summary statistics data for AF and LTL were derived from the recently published largest GWAS. Twenty SNPs at 17 genomic loci were discovered as genetic instruments for LTL. The MR analysis in the fixed-effect inverse-variance weighted models and MR Egger (bootstrap) method showed that LTL was associated with an increased risk of AF (odds ratio [OR], 1.145; 95% CI, 1.065-1.230, P<0.001; OR, 1.158; 95% CI, 1.007-1.331, P=0.021) based on 20 SNPs as the instrument variables. However, the opposite results were observed in other MR methods, which revealed LTL has no strong causal effect on AF at current evidence.
Keywords
Atrial fibrillation, Leukocyte telomere length, Mendelian randomization
Short Communication
Atrial fibrillation (AF) is the most common cardiac arrhythmia worldwide, the latest epidemiological studies show that North America (the prevalence is 2,364 per 100,000 population), Western Europe (the prevalence is 1,880 per 100,000 population), and Eastern Europe (the prevalence is 1,758 per 100,000 population) are the regions with the highest prevalence of AF in the world [1]. The prevalence of AF increases significantly associated with increasing age, ranging from less than 0.5% of the population younger than 40 to 5% of those aged 65 and older and more than 10% of those surviving to the eighth decade of life [2]. Therefore, AF is thought to be closely related to biological ageing, and age is the most important risk factor for atrial fibrillation.
Telomeres, repetitive DNA elements located at the ends of chromosomes, have been implicated as potential mediators of biological aging. Telomeres shorten progressively with each cell division and thus TL reflects the amount of cellular turn-over within an individual. Accelerated telomere attrition might also occur due to increased exposure to oxidative stress and chronic low-grade inflammation, both of which are considered important drivers of biological ageing [3]. Telomere length (TL) varies considerably between subjects with heritability estimates between 44%-86% [4]. TL is generally measured in leucocytes due to the easy accessibility of these cells in peripheral blood.
Several observational studies have demonstrated positive associations between short leucocyte TL (LTL) and AF or long-term prognosis after catheter ablation [5,6]. However, some other studies revealed no evidence of a significant association between LTL and risk of incident AF and no evidence of relative atrial cell telomere shortening in AF [7,8]. Observational studies have many confounding factors that need to be adjusted. Even for the same disease, different observational studies may reach different conclusions due to the adjustment of different confounding factors. Mendelian randomization (MR) is an epidemiological technique using genetic variants as instrumental variables for exposures such as TL. Because genotypes are randomly allocated at conception and are therefore not generally susceptible to reverse causation bias and confounding, in contrast to conventional epidemiological methods, MR can facilitate robust causal inference. Whether short TL is a cause or consequence of the AF remains unknown. We conducted a MR study to determine the association between genetically instrumented LTL and development of the AF.
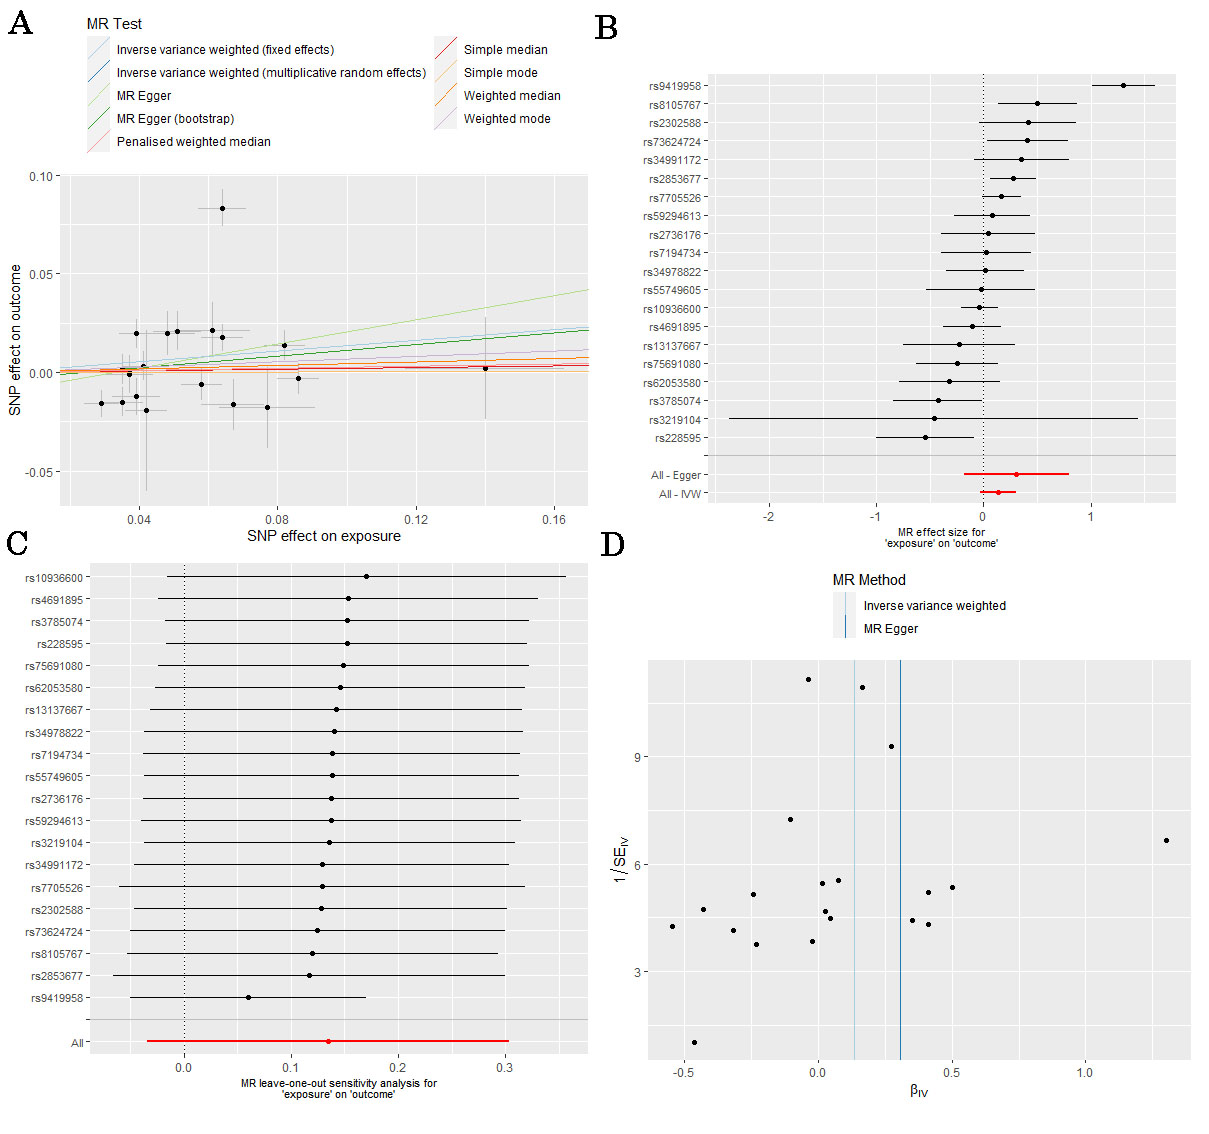
We used two-sample MR analysis model to evaluate the causal effect of LTL on AF (Figure 1A). We used published genetic variants associated with LTL from a recent published GWAS analysis in 78,592 individuals of European ancestry of LTL in a Network for Genetic and Genomic Epidemiology [4]. The outcome of this study was the lifetime risk of AF. The summary statistics data for AF were derived from the recently published largest GWAS [9]. Studies contributing data to these GWAS meta-analyses had received ethical approval from relevant institutional review boards. In this study, we only extracted the summarized data from these studies; thus, there was no additional ethics approval required. Twenty top SNPs were discovered as the genetic instruments for LTL. Twenty SNPs at 17 genomic loci were discovered as genetic instruments for LTL. There was no evidence that these SNPs were associated with the risk factors of AF (triglycerides, total cholesterol, Diabetes, hypertension and so on). Therefore, twenty SNPs were all included in the main MR analysis. We also performed sensitivity analysis to test the robustness of the final results. Table 1 shows the characteristics of the 20 SNPs. Effect estimates were evaluated using inverse-variance weighted (IVW), simple mode, weighted mode, simple median, weighted median, Penalised weighted median and MR-Egger method, as shown in Figure 1A. In the sensitivity analysis, the heterogeneity and pleiotropy of individual SNPs were evaluated using IVW method with Cochran's Q statistics and MR Egger intercept, respectively. Also, a leave-one-out analysis was performed to evaluate the robustness of MR analysis results through any outlier SNPs. All statistical analyses were undertaken using the “TwoSampleMR” package in R version 3.6.1 (R Foundation for Statistical Computing, Vienna, Austria) and a two-tailed p value <0.05 was considered statistically significant.
|
SNP |
Gene |
Chr: Bp |
EAF |
Effect |
Reference |
Leukocyte Telomere Length |
AF |
||||
|---|---|---|---|---|---|---|---|---|---|---|---|
|
|
|
|
|
allele |
allele |
Beta |
SE |
P |
Beta |
SE |
P |
|
rs3219104 |
PARP1 |
Chr1:226562621 |
0.83 |
C |
A |
0.042 |
0.006 |
9.60E-11 |
0.0195 |
0.0408 |
0.6327 |
|
rs55749605 |
SENP7 |
Chr3:101232093 |
0.58 |
A |
C |
-0.037 |
0.007 |
2.45E-08 |
-0.0009 |
0.0096 |
0.9244 |
|
rs10936600 |
TERC |
Chr3:169514585 |
0.24 |
T |
A |
-0.086 |
0.006 |
7.18E-51 |
0.0033 |
0.0077 |
0.6668 |
|
rs13137667 |
MOB1B |
Chr4:71774347 |
0.96 |
C |
T |
0.077 |
0.014 |
2.43E-08 |
-0.0179 |
0.0205 |
0.3818 |
|
rs4691895 |
NAF1 |
Chr4:164048199 |
0.78 |
C |
G |
0.058 |
0.006 |
1.58E-21 |
0.006 |
0.008 |
0.4519 |
|
rs7705526 |
TERT |
Chr5:1285974 |
0.33 |
A |
C |
0.082 |
0.006 |
5.34E-45 |
-0.0136 |
0.0075 |
0.06948 |
|
rs2853677 |
TERT |
Chr5:1287194 |
0.59 |
A |
G |
-0.064 |
0.006 |
3.35E-31 |
0.0175 |
0.0069 |
0.01189 |
|
rs34991172 |
CARMIL1 |
Chr6:25480328 |
0.07 |
G |
T |
-0.061 |
0.011 |
6.19E-09 |
-0.0215 |
0.0138 |
0.1205 |
|
rs2736176 |
PRRC2A |
Chr6:31587561 |
0.31 |
C |
G |
0.035 |
0.006 |
3.53E-10 |
-0.0015 |
0.0078 |
0.8426 |
|
rs59294613 |
POT1 |
Chr7:124554267 |
0.29 |
A |
C |
-0.041 |
0.006 |
1.17E-13 |
0.0031 |
0.0074 |
0.6784 |
|
rs9419958 |
STN1 |
Chr10:105675946 |
0.86 |
C |
T |
-0.064 |
0.007 |
5.05E-19 |
-0.0834 |
0.0096 |
5.36E-18 |
|
rs228595 |
ATM |
Chr11:108105593 |
0.42 |
A |
G |
-0.029 |
0.005 |
1.43E-08 |
-0.0158 |
0.0068 |
0.01983 |
|
rs2302588 |
DCAF4 |
Chr14:73404752 |
0.1 |
C |
G |
0.048 |
0.008 |
1.68E-08 |
-0.0198 |
0.0111 |
0.07389 |
|
rs3785074 |
TERF2 |
Chr16:69406986 |
0.26 |
G |
A |
0.035 |
0.006 |
4.64E-10 |
-0.015 |
0.0074 |
0.04383 |
|
rs62053580 |
RFWD3 |
Chr16:74680074 |
0.17 |
G |
A |
-0.039 |
0.007 |
4.08E-08 |
0.0124 |
0.0094 |
0.1834 |
|
rs7194734 |
MPHOSPH6 |
Chr16:82199980 |
0.78 |
T |
C |
-0.037 |
0.006 |
6.94E-10 |
0.0009 |
0.0079 |
0.9068 |
|
rs8105767 |
ZNF208 |
Chr19:22215441 |
0.3 |
G |
A |
0.039 |
0.005 |
5.42E-13 |
0.0196 |
0.0073 |
0.007308 |
|
rs75691080 |
RTEL1 |
Chr20:62269750 |
0.09 |
T |
C |
-0.067 |
0.009 |
5.99E-14 |
-0.0164 |
0.013 |
0.2086 |
|
rs34978822 |
RTEL1 |
Chr20:62291599 |
0.02 |
G |
C |
-0.14 |
0.023 |
7.26E-10 |
-0.002 |
0.0257 |
0.9377 |
|
rs73624724 |
RTEL1/ZB |
Chr20:62436398 |
0.13 |
C |
T |
0.051 |
0.007 |
6.33E-10 |
-0.0209 |
0.0098 |
0.03313 |
The MR analysis in the fixed-effect inverse-variance weighted models and MR Egger (bootstrap) method showed that LTL was associated with an increased risk of AF (odds ratio [OR], 1.145; 95% CI, 1.065-1.230, P<0.001; OR, 1.158; 95% CI, 1.007-1.331, P=0.021) based on 20 SNPs as the instrument variables, as shown in Figure 1B. However, the opposite results were observed in the method of simple mode (OR, 1.002; 95% CI, 0.802-1.253, P=0.986), weighted mode (OR, 1.069; 95% CI, 0.929-1.229, P=0.365), simple median (OR, 1.019; 95% CI, 0.892-1.165, P=0.777), weighted median (OR, 1.046; 95% CI, 0.932-1.173, P=0.448), Penalised weighted median (OR, 1.026; 95% CI, 0.910-1.158, P=0.671), MR-Egger method (OR, 1.360; 95% CI, 0.835-2.215, P=0.233), and random-effect inverse-variance weighted models (OR, 1.145; 95% CI, 0.967-1.355, P=0.117), as shown in Table 2. Therefore, we did not believe that there is a significant causal relationship between LTL and AF. The leave-one-out sensitivity analysis showed that the association between LTL and AF was not substantially driven by any individual SNP (Figure 1C). Asymmetry in the funnel plot indicates directional horizontal pleiotropy, which can bias MR methods; however, the funnel plot and MR Egger regression test showed no evidence of asymmetry (Figure 1D).
|
Method |
Beta |
SE |
OR |
95% CI |
P value |
|
IVW (random effects) |
0.135 |
0.086 |
1.145 |
0.967-1.355 |
0.117 |
|
IVW (fixed effects) |
0.135 |
0.037 |
1.145 |
1.065-1.230 |
<0.001 |
|
Simple mode |
0.002 |
0.114 |
1.002 |
0.802-1.253 |
0.986 |
|
Weighted mode |
0.066 |
0.071 |
1.069 |
0.929-1.229 |
0.365 |
|
Simple median |
0.019 |
0.068 |
1.019 |
0.892-1.165 |
0.777 |
|
Weighted median |
0.044 |
0.059 |
1.046 |
0.932-1.173 |
0.448 |
|
Penalized weighted median |
0.026 |
0.062 |
1.026 |
0.910-1.158 |
0.671 |
|
MR Egger |
0.307 |
0.249 |
1.360 |
0.835-2.215 |
0.233 |
|
MR Egger (bootstrap) |
0.146 |
0.071 |
1.158 |
1.007-1.331 |
0.021 |
|
IVW: Inverse-Variance Weighted; MR: Mendelian Randomization |
|||||
LTL measurement was increasingly recognized as a clinical gauge for age-related disease risk. However, our study did not demonstrate a strong causal effect of LTL on AF through MR analysis. The results of this study supported the conclusions of previous observational studies (the Framingham Heart Study). Our study is based on two GWAS analyses which were all derived from the cross-sectional study, the TL at a single time point cannot reflect the dynamic changes of biological age. Additionally, the TL at a single time point not only reflects the aging effect but also integrates the cumulative lifetime burdens of genetic, epigenetic, environmental, and lifestyle exposures. The considerable inter-individual variation in TL makes it difficult to fully appreciate TL dynamics in relation to age without knowing other unmeasured confounding factors. Roberts et al. tested the strength of telomere shortening and chronological age, and they also concluded that chronological aging was a stronger predictor of AF than telomere length as a biomarker for biological aging [10]. Overall, LTL measurement is a dynamic marker of biological health and well-being that together with genetically defined telomere lengths can provide insights into improved healthcare for the individual, but LTL has no strong causal effect on AF at current evidence.
Declarations
Acknowledgements
None.
Competing interests
All other authors have no conflicts of interests.
Authors’ contributions
CJ conceived and designed the research; CJ collected the data and conducted the research; CJ analyzed and interpreted the data; LJM wrote the initial paper; CJ revised the paper; CJ approved the final version to be submitted. CJ had primary responsibility for the final content. All authors read and approved the final manuscript.
Funding
Not applicable.
Availability of data and materials
All data generated or analysed during this study are included in this published article [and its supplementary information files].
Ethics approval and consent to participate
Not applicable.
Consent for publication
Not applicable.
References
2. Desai Y, El-Chami MF, Leon AR, Merchant FM. Management of Atrial Fibrillation in Elderly Adults. J Am Geriatr Soc. 2017 Jan;65(1):185-193.
3. Li C, Stoma S, Lotta LA, Warner S, Albrecht E, Allione A, et al. Genome-wide Association Analysis in Humans Links Nucleotide Metabolism to Leukocyte Telomere Length. Am J Hum Genet. 2020 Mar 5;106(3):389-404.
4. Mather KA, Jorm AF, Parslow RA, Christensen H. Is telomere length a biomarker of aging? A review. J Gerontol A Biol Sci Med Sci. 2011 Feb;66(2):202-13.
5. Carlquist JF, Knight S, Cawthon RM, Le VT, Jared Bunch T, Horne BD, et al. Shortened telomere length is associated with paroxysmal atrial fibrillation among cardiovascular patients enrolled in the Intermountain Heart Collaborative Study. Heart Rhythm. 2016 Jan;13(1):21-7.
6. Wang Q, Liu Z, Dong Y, Yang X, Chen M, Gao Y. Leukocyte Telomere Length Predicts Progression From Paroxysmal to Persistent Atrial Fibrillation in the Long Term After Catheter Ablation. Front Cardiovasc Med. 2022 Jan 24;8:813390.
7. Roberts JD, Dewland TA, Longoria J, Fitzpatrick AL, Ziv E, Hu D, et al. Telomere length and the risk of atrial fibrillation: insights into the role of biological versus chronological aging. Circ Arrhythm Electrophysiol. 2014 Dec;7(6):1026-32.
8. Staerk L, Wang B, Lunetta KL, Helm RH, Ko D, Sherer JA, et al. Association Between Leukocyte Telomere Length and the Risk of Incident Atrial Fibrillation: The Framingham Heart Study. J Am Heart Assoc. 2017 Nov 14;6(11):e006541.
9. Nielsen JB, Thorolfsdottir RB, Fritsche LG, Zhou W, Skov MW, Graham SE, et al. Biobank-driven genomic discovery yields new insight into atrial fibrillation biology. Nat Genet. 2018 Sep;50(9):1234-1239.
10. Roberts JD, Dewland TA, Longoria J, Fitzpatrick AL, Ziv E, Hu D, et al. Telomere length and the risk of atrial fibrillation: insights into the role of biological versus chronological aging. Circ Arrhythm Electrophysiol. 2014 Dec;7(6):1026-32.