Abstract
The microarray-based Illumina Infinium MethylationEpic BeadChip (Epic 850k) has become a useful and standard tool for epigenome wide deoxyribonucleic acid (DNA) methylation profiling. Data from this technology may suffer from batch effects due to improper handling of the samples during the plating process. Batch effects are a significant issue and can give rise to spurious and inaccurate results and reduction in power to detect real biological differences. Careful study design, such as randomizing the samples to uniformly distribute the samples across the factors responsible for batch effects, is crucial to address batch effects and other technical artifacts. Randomization helps to reduce the likelihood of bias and impact of difference among groups. This process of randomizing the samples can be a tedious, error-prone, and time-consuming task without a user-friendly and efficient tool. We present RANDOMIZE, a web-based application designed to perform randomization of relevant metadata to evenly distribute samples across the factors typically responsible for batch effects in DNA methylation microarrays, such as rows, chips and plates. We demonstrate that the tool is efficient, fast and easy to use. The tool is freely available online at https://coph-usf.shinyapps.io/RANDOMIZE/ and can be accessed using any web browser. Sample data and tutorial is also available with the tool.
Introduction
Deoxyribonucleic acid (DNA) methylation is a critical type of epigenetic modification that typically occurs in a specialized region of DNA, CpG-rich regions in the mammalian genome and is associated with regulating gene expression [1,2]. Previous studies have revealed a strong association of change in DNA methylation with various diseases such as cancer [3,4], obesity [5] and posttraumatic stress disorder (PTSD) [6].
High throughput microarray technology has made it possible to measure methylation levels of thousands of probes simultaneously in an inexpensive manner. The microarray-based Illumina Infinium MethylationEpic BeadChip (Epic 850k) has become a useful and standard tool for epigenome wide DNA methylation profiling. The technology interrogates over 850,000 selected methylation sites (CpGs) per sample at single-nucleotide resolution, including >90% of the CpGs from the Illumina HumanMethylation450 BeadChip and an additional 413,743 CpGs [7]. Each Epic 850k chip can accommodate eight samples, and each 96 well plate has 12 chips for 96 samples in total. Thus, the samples in large studies are often assayed across different chips and plates and processed in different batches. Accordingly, there could be a lot of non-biological variations due to experimental factors such as conditions in the laboratory, time of the experiment, reagent differences, personnel differences in preparing the samples, and chip position (row). This variation may give rise to batch effects [8,9] that affect the methylation level of different probes. Batch effects are a significant issue and can lead to spurious and inaccurate results and reduction in power to detect real biological differences [10].
Batch effects are difficult to remove entirely during the normalization process following data collection. Even the effectiveness of advanced techniques like ComBat [11] to adjust for batch effects depends on the study design. It was found that even powerful techniques such as ComBat could not wholly remove batch effects when the samples are not randomized across chips, thus leading to false detection of differentially methylated probes [8]. A recent study [12] running ComBat simulations showed that ComBat adjustment may lead to false-positive results under certain conditions. Since batch effects can’t be eliminated entirely from even a perfectly designed study, Hu et al., [13] emphasized that careful study design is crucial to address batch effects and other technical artifacts. For example, in a case-control study, the cases and controls should be uniformly distributed across the factors considered to be responsible for a batch effect. This can help to avoid problems such as those identified by [14], who found a surprising relationship between methylation data and assay date due to the unbalanced distribution of cases and controls on those dates.
All this tells us that it is essential to randomize the samples to reduce the likelihood of bias. Random assignment of samples to row, chip, and plate ensures that each sample has the same probability of being attached to a particular chip and thus satisfies the requirement of uniform distribution of the data. Randomizing the samples can be a tedious, error-prone, and time-consuming task when dealing with hundreds of samples. According to our knowledge, there is no tool existing to perform randomization. To facilitate this process, here we present a web-based tool that helps users to randomize samples in a user-friendly and efficient way. The tool can randomize hundreds of samples within a matter of a few seconds and is available online and free to use.
Materials & Methods
The underlying principle of the randomization method is based on stratified randomization, which first stratifies all the samples into subgroups based on similar characteristics (stratification/grouping variable). The samples from each group are then randomly selected and assigned to plates/ chips. Stratified randomization has been adapted for the specific requirements of methylation assays using Illumina BeadChip assays, which have extensive covariance between methylation and chip/row/plate. The criteria for defining the subgroups is based on the covariate categories, e.g., gender, age.
The primary advantage over a randomized design is that it stratifies known methylation covariates (as specified), and randomizes after stratification to attempt to address any unknown (or unspecified) covariates. This is especially useful for experiments where blocking or other designs are not tractable (for example, analysis of historical or retained samples, or other cases where the number of covariates is not balanced or their product outnumbers the samples). The algorithm is described below.
Algorithm: Stratified Randomization
Start
Input: Metadata
Output: Randomized metadata
Steps:
1. Set seed for reproducibility
2. Initialize samples per chip to 8 // Each chip on Epic has 8 samples.
3. Calculate and initialize the total number of chips needed, i.e., total samples / 8
4. Initialize total plates needed, i.e., total samples / 12*8 // Each plate can accommodate 12 chips.
5. For i = 1 to i = n, do // n = covariates
Stratify the samples into subgroups based on
similar characteristics (covariate groups)
6. If controls = True // if users want to insert controls
Insert controls to the specified locations
7. For j = 1 to j = l, do // l = subgroups
For k = 1 to k = m, do // m = samples in each subgroup
Randomly select the samples and assign to chips
8. Shuffle samples within chips to get the ideal design
9. Assign ids to chips and plates
10. Plot and download the results
End
We developed the tool RANDOMIZE with the primary purpose of providing a user-friendly, graphical user interface (GUI) based tool for biologists to perform randomization of the metadata. The tool is very simple to use. Users do not need to prepare the system or install any software packages. All the required packages are already installed on the server. Users just need to use any web browser to access and use the tool. The workflow of the tool is shown in Figure 1. Following are the ten main steps:
1) Launch the tool using any browser. 2) Select and upload the metadata file. The input file should be in a CSV file format where the data is available across different columns and must have columns with the names “ParticipantID” and “SampleID”. These two columns should contain the ids for participants and samples. 3) Choose the option to insert controls or proceed without choosing the locations for controls. 4) If the user prefers to add controls, select

Figure 1: Shows the workflow of the tool. The process starts by launching the web browser and ends with downloading the results.
the control locations on chips. This option is to constrain known controls (or duplicate samples) at any position on the chips. 5) Select the columns on which the user wants to balance the data and perform randomization. 6) Hitting the submit button will submit the job for processing. 7) The data will be processed internally by the tool, and the randomized data and design for each plate will be displayed. 8) Next, users can download randomized data and the final design for each plate. 9) If the user chooses to plot the results, they can do so by first selecting the columns from the randomized data and then go to the plot tab to view the plot. Users can perform an exploratory analysis of the randomization results. Many plots are available for exploratory analysis and to check the goodness of randomization, including Sunflower, Violin, and Density plots. 10) Finally, users can download the plots for further usage.
As of now, the tool is compatible with randomizing samples on 96 well plates as it is widely used. In order to prepare for randomization a seed is set for reproducibility. The samples are assigned to chips on plates, and the chips on each plate are shuffled to obtain an ideal order. The samples on each chip and plate are balanced based on the user input. For example, there is an option to balance randomization on various factors such as case-control, male-female, etc.
The graphical user interface of the tool was designed and implemented using the Shiny R library [15], and the methodology was applied using R 3.6.1 [16] and RStudio 1.0.44. The tool can be run on any operating system, including Windows, Linux, and is available using web browser (best viewed on Firefox, Google Chrome, and Safari).
Results and Discussion
In this section, we will discuss the assessment of functions and illustrate the utility of the tool. We will briefly discuss various steps, such as the submission of data, selecting the control locations, randomizing the samples and plotting the results. For illustration, we have used sample data with 750 samples, which is available with the tool.
Data submission
To start the process, go to the main page of the tool and then click on the “Analysis” tab to start randomization. On the right side is the “Randomization” panel, shown below in Figure 2, where users can browse a computer to locate metadata file and upload the metadata file in a CSV file format. Successful uploads will be indicated as “Upload complete”, and the data should show up in the “Input Data” tab on the top left. The metadata file must include columns labeled as “ParticipantID” and “SampleID”.
Inserting controls
If users are interested in inserting known controls to the analysis, it can be done by checking the box ‘Insert controls’. Controls can then be added on individual chips as shown in Figure 3. Inserting known control samples in the data is used to assure quality of the data. It is an important step in quality control. No controls are inserted by default.
Performing randomization
As a next step, users need to select the columns to perform randomization. By clicking on the columns, users can choose the columns to randomize data, as shown in the tutorial. Selecting the columns will balance the data and uniformly distribute data across chips and plates. For example, it will make sure that there is equal representation of male and female or case and control
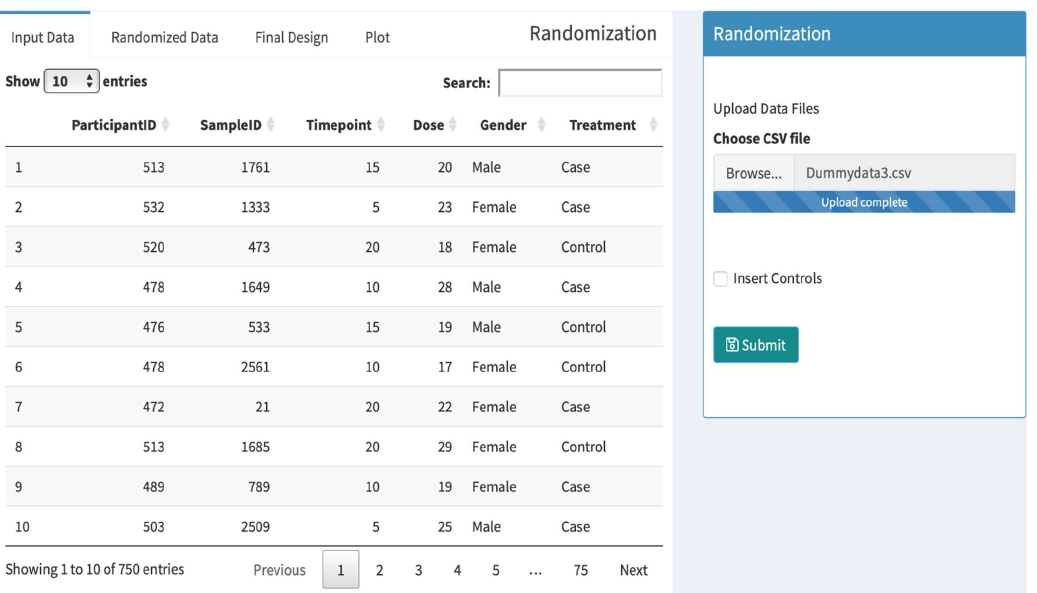
Figure 2: Shows the panel to upload data. Once the data is uploaded, it will be shown on the left side of the panel. Sorting and searching options are also available on top of the panel.
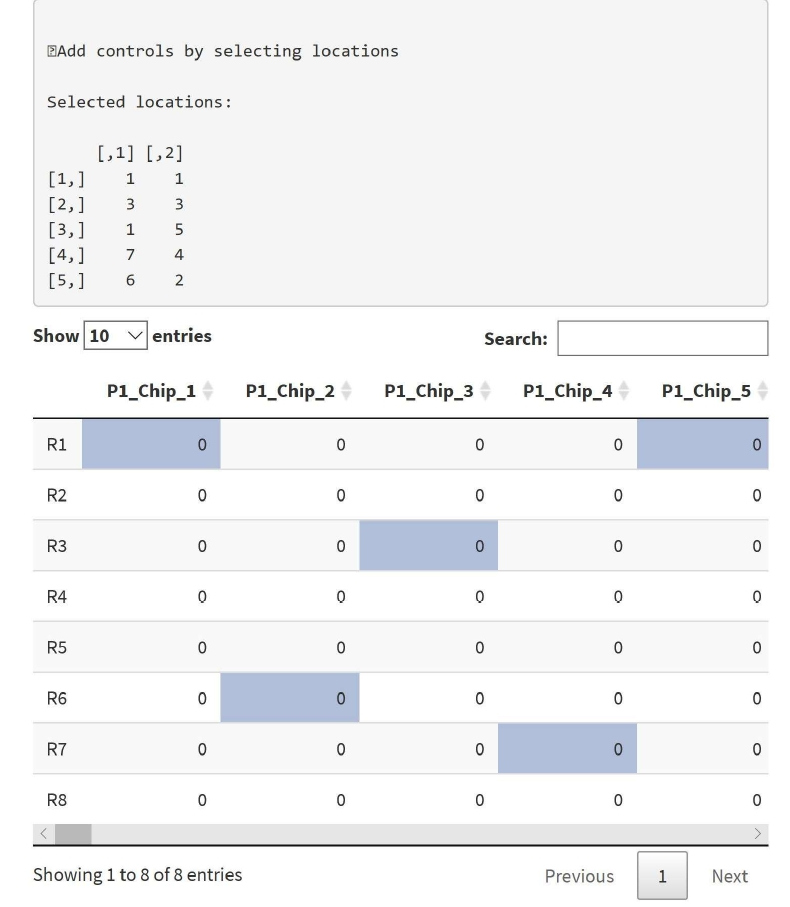
Figure 3: Shows places to insert controls. The selected control locations will be shown on the upper side of the panel. The data shows a row and column location for control, e.g., 1,1 means first row and first column.
on every chip and plate. Hitting “Submit” button without selecting any columns will display an error message: “Please select columns for randomization by clicking on desired column(s)”.
After selecting the columns of interest for randomization, click on the “Submit” button located on the bottom of the Randomization Panel to submit the job for processing. Once the job is processed, in the “Randomized Data” tab (next to the “Input Data” tab) user can take a look at the randomized data based on selected items (see tutorial). The previously chosen controls are excluded from the randomization, and still, in the location, users have selected beforehand. The controls are shown as zeros (see tutorial).
The “Final Design” tab adjacent to the “Randomized Data” tab shows users the final design of the randomized
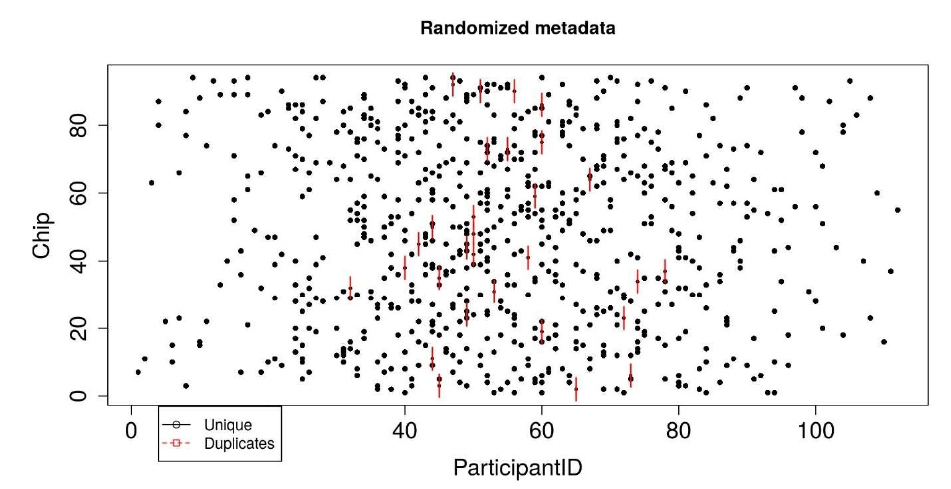
Figure 4: Sunflower plot showing the metadata distribution (here, participantID) across Chips. Black dots are the unique samples, and each red line indicates a duplicate sample.
data. The “Display Final Data” option lets users view the final design, one plate at a time. The design of the first plate is available to view by default.
Plotting results
The “Plot” tab eventually shows the plotted data. Users should select the columns of interest by clicking on them before moving on to the “Plot” tab. The first column selected will be plotted on the x-axis and second on the y-axis. Users should select appropriate columns for plotting. In the “Plots” selection on the left user can choose between various plots. The “Plot labels” option lets users select a title for the plot and label the x- and y-axis.
Finally, we will illustrate the goodness of randomization using the sample dataset and sunflower plot. The sunflower plot is used to display bivariate distribution. Each petal on the sunflower plot represents an observation (sample). The “ParticipantID” column in our sample dataset denotes the participant ids; each participant has one or more samples in the range of 1-23. There are 112 unique participants in the dataset. For 750 samples, eight samples on one chip, we need 94 chips in total. An ideal randomization would be that no two or more samples from the same participant are on the same chip; however, the number of chips is less than the number of participants, so it is evident that some samples from the same participant will be on the same chip. The black dots shown in Figure 4 denote unique samples. If two samples from the same participant are on the same chip, a petal, as shown in red, is added on the black dot. For two duplicates, two petals are added, and so on. The plot indicates proper randomization of the data — for example, for the participant which has 23 samples, all the samples are sent to different chips. Only some chips have two samples from the same participant id. Similarly, the randomization of participant ids on plates is shown in the tutorial.
Despite many strengths, one of this tool’s limitations is that the current version can only be used with 96 well plates. In the future, we may support other platforms as well (e.g. 384 well plates). Another limitation is that we could not test the effectiveness of randomization on real data because that would require analyzing data on Illumina BeadChips with and without randomization. These assays are costly, and we are not in a position to perform such a study.
Conclusion
High-throughput DNA methylation arrays are susceptible to bias facilitated by batch effects and other technical noise that can alter DNA methylation level estimates. RANDOMIZE is a user-friendly web application that provides an interactive and flexible GUI to randomize relevant metadata. Using this tool will minimize chip and position mediated batch effects in microarray studies for an increased validity in inferences from methylation data. The tool is very helpful for a biologist to perform randomization of test samples and insert controls in the data.
Acknowledgements
This work has been supported by National Institutes of Health, grants 1R01MD011728, R01MD011728-S2 and 1R01MH108826
Authors Contribution
Agaz H Wani: Conceptualization, Methodology, Analysis, Interpretation, Writing - original draft, review & editing. Don Armstrong : Conceptualization, Methodology, Writing - review & editing. Jan Dahrendorff: Writing - review & editing. Monica Uddin: Conceptualization, Supervision, Interpretation, Writing - original draft, review & editing.
References
2. Sharma S, Kelly TK, Jones PA. Epigenetics in cancer. Carcinogenesis. 2010 Jan 1;31(1):27-36.
3. Feinberg AP, Irizarry RA. Evolution in health and medicine Sackler colloquium: Stochastic epigenetic variation as a driving force of development, evolutionary adaptation, and disease. Proceedings of the National Academy of Sciences of the United States of America. 2009 Dec 22;107:1757-64.
4. Karpinski P, Sasiadek MM, Blin N. Aberrant epigenetic patterns in the etiology of gastrointestinal cancers. Journal of Applied Genetics. 2008 Mar 1;49(1):1-10.
5. Wang X, Zhu H, Snieder H, Su S, Munn D, Harshfield G, Maria BL, Dong Y, Treiber F, Gutin B, Shi H. Obesity related methylation changes in DNA of peripheral blood leukocytes. BMC medicine. 2010 Dec 1;8(1):87.
6. Uddin M, Ratanatharathorn A, Armstrong D, Kuan PF, Aiello AE, Bromet EJ, et al. Epigenetic meta-analysis across three civilian cohorts identifies NRG1 and HGS as blood-based biomarkers for post-traumatic stress disorder. Epigenomics. 2018 Dec;10(12):1585-601.
7. Pidsley R, Zotenko E, Peters TJ, Lawrence MG, Risbridger GP, Molloy P, et al. Critical evaluation of the Illumina MethylationEPIC BeadChip microarray for whole-genome DNA methylation profiling. Genome Biology. 2016 Dec;17(1):1-7.
8. Harper KN, Peters BA, Gamble MV. Batch effects and pathway analysis: two potential perils in cancer studies involving DNA methylation array analysis. Cancer Epidemiology and Prevention Biomarkers. 2013 Jun 1;22(6):1052-60.
9. Yan L, Ma C, Wang D, Hu Q, Qin M, Conroy JM, et al. OSAT: a tool for sample-to-batch allocations in genomics experiments. BMC Genomics. 2012 Dec;13(1):1-7.
10. Akey JM, Biswas S, Leek JT, Storey JD. On the design and analysis of gene expression studies in human populations. Nature genetics. 2007 Jul;39(7):807-8.
11. Johnson WE, Li C, Rabinovic A. Adjusting batch effects in microarray expression data using empirical Bayes methods. Biostatistics. 2007 Jan 1;8(1):118-27.
12. Zindler T, Frieling H, Neyazi A, Bleich S, Friedel E. Simulating ComBat: how batch correction can lead to the systematic introduction of false positive results in DNA methylation microarray studies. BMC Bioinformatics. 2020 Dec;21(1):1-5.
13. Hu J, Coombes KR, Morris JS, Baggerly KA. The importance of experimental design in proteomic mass spectrometry experiments: some cautionary tales. Briefings in Functional Genomics. 2005 Feb 1;3(4):322- 31.
14. Liu Y, Aryee MJ, Padyukov L, Fallin MD, Hesselberg E, Runarsson A, Reinius L, Acevedo N, Taub M, Ronninger M, Shchetynsky K. Epigenome-wide association data implicate DNA methylation as an intermediary of genetic risk in rheumatoid arthritis. Nature Biotechnology. 2013 Feb;31(2):142-147.
15. RStudio I. (2013). Shiny, Easy web applications in R, http://www.rstudio.com/shiny/.
16. R. (2017). R: A Language and Environment for Statistical Computing”. Vienna, Austria, https://www.Rproject. org/