Abstract
Objectives: Human immunodeficiency virus (HIV) is a lentivirus that causes HIV infection and over time acquired immunodeficiency syndrome. The objective was to evaluate plasma levels of Calreticulin (CALR) in HIV positive and negative individuals.
Methods: A total of 164 participants were recruited and divided into four groups according to their viral load after estimation and individuals recruited as controls. Viral load was estimated in 1.1 ml of plasma according to manufacturers (COBAS Taqman HIV-1 Quantitative Test, v2.0, Roche Diagnostic GmbH, Germany). Plasma levels of CALR were analysed using ELISA (ELISA-Biotuva Life Sciences, UK).
Results: Result revealed a significant difference (p = 0.00) between the CALR levels of individuals with low viral load and individuals with unsuppressed viral load, suppressed viral load, and controls. A significantly (p = 0.017) higher plasma CALR in individuals with unsuppressed viral load compared to those with suppressed viral load was found. No differences between plasma CALR levels of individuals with unsuppressed viral load and that of controls.
Conclusion: Our study showed up regulation of plasma CALR in HIV-infected patients on long term antiretroviral therapy. We believe and from existing literature this up regulation is due partly if not solely to the oxidative stress and endoplasmic reticulum stress caused by the antiretroviral agents.
Keywords
Plasma, Secretary Calreticulin, Calcium-Binding Molecular Chaperone Protein, HIV Infected Patients, Viral Load, Oxidative Stress, Lentivirus, Bauchi State
Introduction
The human immunodeficiency virus (HIV) is a lentivirus (a subgroup of retrovirus) that causes HIV infection and over time acquired immunodeficiency syndrome [1]. HIV infects vital cells in the human immune system such as helper T cells (specifically CD4+ T cells), macrophages, and dendritic cells [2]. HIV infection leads to low levels of CD4+ T cells through several mechanisms, including pyroptosis of abortively infected T cells [3], apoptosis of uninfected bystander cells, the direct viral killing of infected cells, and killing of infected CD4+ T cells by CD8 cytotoxic lymphocytes that recognize infected cells [4,5].
Calreticulin (CALR) is a calcium-binding molecular chaperone protein that resides mainly in the endoplasmic reticulum (ER) [6] but is also found in other cell compartments [7]. Its major function is to bind, buffer and control intracellular calcium levels but it also decides the intracellular fate of almost all proteins and mRNAs by binding to and regulating their functions [8,9]. It is increasingly becoming evident that CALR has numerous functions and identification of all of these is becoming a nightmare for researchers [9]. The study of functions of CALR for a long time was restricted to the study of its role in calcium signaling in the control of cellular responses to stress, however, it has been identified that CALR also interacts with many ER proteins and associates with numerous newly synthesized glycoproteins as they enter the secretory pathway and as well as interact with mRNA, invariably determining their fate [10].
There is substantial evidence that HIV infection triggers oxidative stress and induces mitochondrial dysfunction [11]. HIV infection has been associated with excessive production of reactive oxygen species causing oxidative stress which has been linked to an increased rate of viral replication [12].
The presence of oxidative species challenges the cellular systems [13]. It, therefore, becomes imperative to find out other possible causes of immune pathologies related to HIV infection for possible improvement in clinical management and prognosis. CALR becomes a top choice of protein to study because of the recent findings associating it with cellular stress and those linking it to pathologies in various viral, parasitic, and bacterial infections as well as in cancers [9,10].
Materials and Methods
Study area
Samples for this research were collected in Bauchi, Bauchi State, Nigeria. Viral load analysis was carried out at the Jos University Teaching Hospital, Plateau State, Nigeria, and Calreticulin analysis was carried out at the Federal Medical Centre, Bida, Niger State, Nigeria.
Study design
A cross-sectional study on HIV-positive individuals with suppressed and unsuppressed viral loads attending ART clinics of Infectious Disease Hospital (IDH), Bayara, PHC Urban Maternity, and Bauchi State Specialist Hospital all in Bauchi, Bauchi State, Nigeria.
Study population
The study population for this research was HIV-positive individuals attending the ART clinics of the selected hospitals in Bauchi. The control population was apparently healthy individuals who consented to participate in the study.
Inclusion criteria
The study includes HIV positive individuals and apparently healthy HIV negative individuals.
Exclusion criteria
The study excluded HIV positive individuals with other clinical conditions (such as diabetes, rheumatoid arthritis, cancer, HBV, HCV) and HIV positive and negative individuals who do not consent to participate.
Ethical considerations
Ethical approval to conduct the research was sought from the Research Ethics committee of the Bauchi State Ministry of Health. All procedures were carried out according to the principles of the Declaration of Helsinki. Written informed consent was obtained from each participant.
Clinical samples
Peripheral blood (5 ml) was collected into EDTA bottles from HIV-positive and negative individuals who consent to the study and met the inclusion criteria. Plasma was used for HIV rapid screening of apparently healthy individuals. Plasma was used for the estimation of viral load levels and the measurement of plasma CALR.
HIV rapid screening
The screening of participants with supposedly HIV-negative status was carried out using the National algorithmic approach using the HIV Determine, Unigold, and Statpak kits.
Viral load estimation
Viral load was estimated in 1.1 ml of plasma using methods prescribed by the reagent manufacturers (COBAS AmpliPrep/COBAS Taqman HIV-1 Quantitative Test, v2.0, Roche Diagnostic GmbH, Germany).
Measurement of plasma levels of CALR
Plasma levels of CALR were analyzed using Enzyme-linked immunosorbent assay (ELISA) from Biotuva Life Sciences, UK.
Statistical analysis
Data generated from the study was analyzed using the statistical package for social sciences (SPSS) version 23. Descriptive statistics was used to summarize categorical data, and one-way ANOVA with Bonferroni post hoc analysis was used to determine the mean differences between groups with confidence interval at 95%. Pearson correlation analysis was carried out to determine the association between Calreticulin levels across groups.
Results
Participants demographics
Gender and Age distribution of study participants across the groups: A total of 164 participants (41.5% males and 58.5% females) were recruited for the study with ages are fairly distributed between 10 and 72 years (9.15% of participants in the age bracket 10-19, 15.85% between 20-29, 31.7% between 30-39, 23.78% between 40-49, 11.59% between 50-59 and 7.93% of participants 60 years and above).
Ethnic group distribution of study participants across the groups was shown in Figure 1. Hausa/Fulani with highest percentage of 21%; followed by Sayawa with 19%; Jarawa, Yoruba and Igbo with 14% each; Warjawa 9% and others 9%.
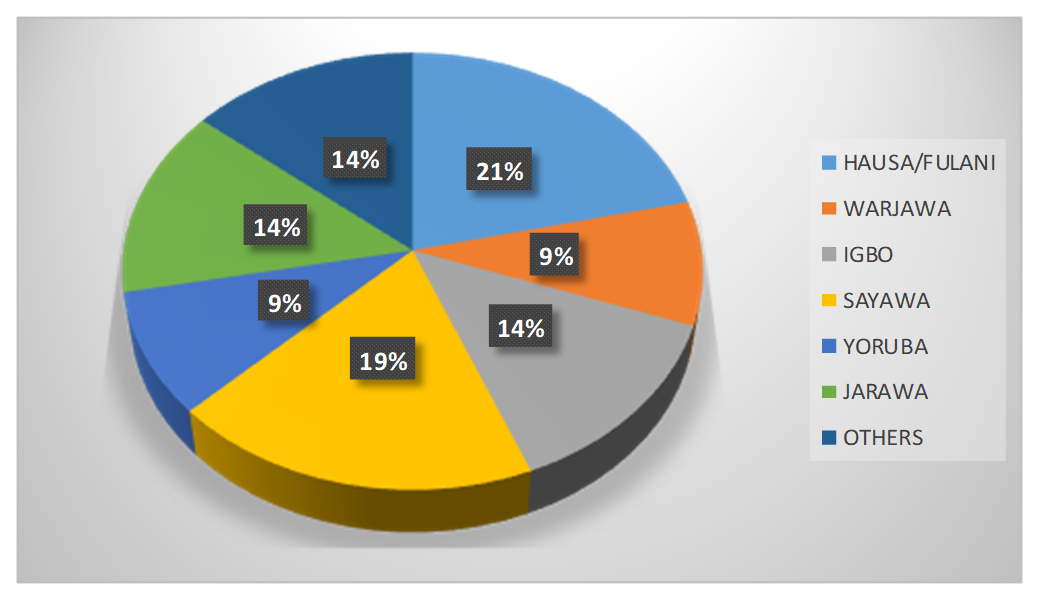
Figure 1. Ethnic group distribution of study participants across the groups.
HIV viral load estimation
A graphical representation of the viral load levels of participants in group 1 (Unsuppressed viral load group) is shown in Figure 2. The highest viral load level in group 1 is 1,200,000 cp/ml and the lowest is 1,838 cp/ml. Figure 3 is a graphical representation of the viral load levels of participants in group 2 (Suppressed viral load group) with the highest viral load level at 920 cp/ml and the lowest 54 cp/ml. Figure 4 shows viral load levels of participants in group 3 (Low viral load group) with the highest viral load level in the group at 40 cp/ml and the lowest 20 cp/ml.
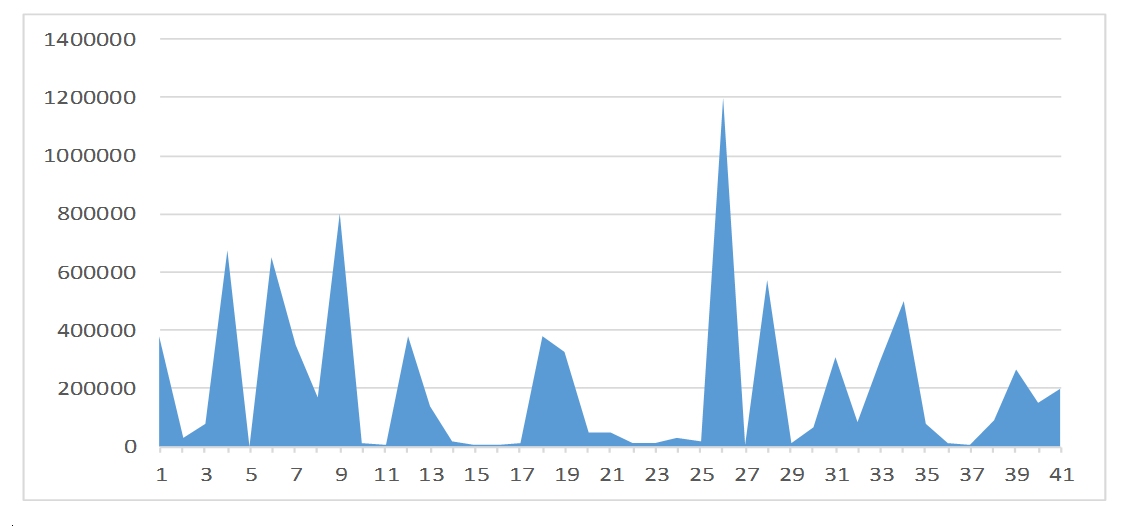
Figure 2. Graphical representation of the viral load levels of participants in group 1.
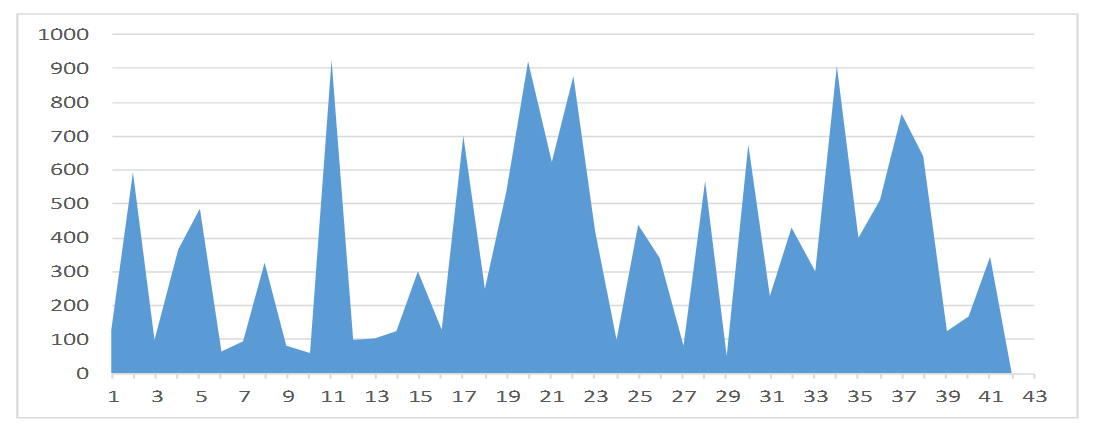
Figure 3. Graphical representation of the viral load levels of participants in group 2.
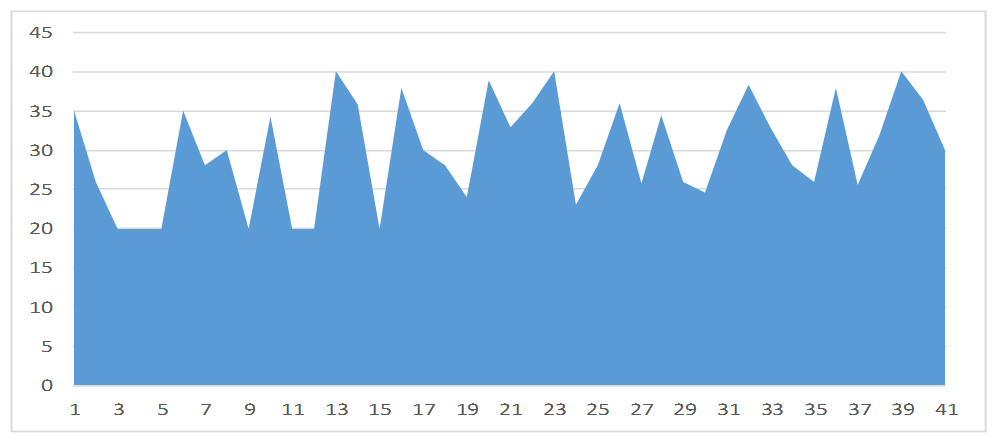
Figure 4. Viral load levels of participants in group 3 (Low viral load group) with the highest viral load level in the group at 40 cp/ml and the lowest 20 cp/ml.
Plasma calreticulin estimation
The line graph (Figure 5) summarizes the plasma CALR values for groups 1, 2, 3, and 4. The mean plasma CALR level of group 1 was found to be 0.328 ± 0.024, 0.389 ± 0.038 for group 2, 0.854 ± 0.174 for group 3 and 0.339 ± 0.030 for group 4.
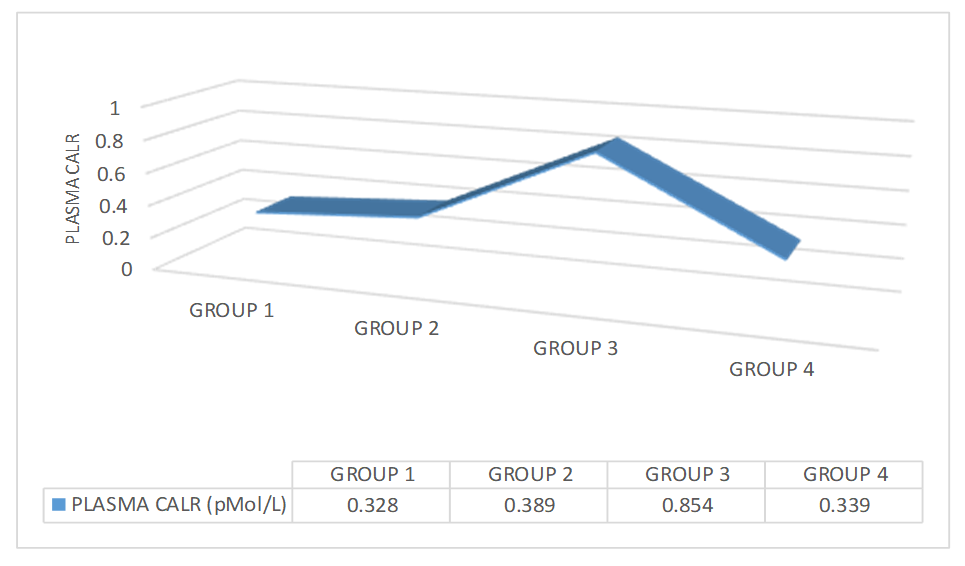
Figure 5. Plasma CALR values for groups 1, 2, 3, and 4.
The mean differences and level of significance of the differences between the plasma calreticulin levels across all groups, using one-way ANOVA with Bonferroni post hoc analysis is shown in Table 1. The result indicated a significant difference between plasma CALR of groups 1 and 2 (p = 0.017), between groups 1 and 3 (p = 0.00), between groups 2 and 3 (p = 0.00) and between groups 3 and 4 (p = 0.00). However, no significant differences were found between plasma CALR levels of group 1 and 4 (p = 1.00) and groups 2 and 4 (p = 0.85).
|
GROUPS |
CALR |
P-VALUE |
|---|---|---|
|
Group 1 |
0.328 ± 0.024 |
0.017 |
|
Group 2 |
0.389 ± 0.038 |
|
|
Group 1 |
0.328 ± 0.024 |
0.00 |
|
Group 3 |
0.854 ± 0.174 |
|
|
Group 1 |
0.328 ± 0.024 |
1.00 |
|
Group 4 |
0.339 ± 0.030 |
|
|
Group 2 |
0.389 ± 0.038 |
0.00 |
|
Group 3 |
0.854 ± 0.174 |
|
|
Group 2 |
0.389 ± 0.038 |
0.85 |
|
Group 4 |
0.339 ± 0.030 |
|
|
Group 3 |
0.854 ± 0.174 |
0.00 |
|
Group 4 |
0.339 ± 0.030 |
|
|
Values are of mean ± SEM |
||
Pearson correlation analysis between the plasma Calreticulin levels across all groups is shown in Table 2. The result indicated no significant correlation between plasma CALR from group 1 and plasma CALR from group 2 (r = -0.039, p = 0.810), between plasma CALR of group 1 and group 3 (r = -0.119, p = 0.460), between plasma CALR of group 1 and group 4 (r = -0.20, p = 0.89). No significant correlations were also found between plasma CALR of group 2 and group 3 (r = 0.061, p = 0.705), groups 2 and group 4 (r = 0.124, p = 0.438), and between groups 3 and 4 (r = 0.062, p = 0.702).
|
|
|
GROUP 1 |
GROUP 2 |
GROUP 3 |
GROUP 4 |
|
GROUP 1 |
Pearson Correlation |
1 |
-0.039 |
-0.119 |
-0.020 |
|
P-value |
|
0.810 |
0.460 |
0.899 |
|
|
N |
41 |
41 |
41 |
41 |
|
|
GROUP 2 |
Pearson Correlation |
-0.039 |
1 |
0.061 |
0.124 |
|
P-value |
0.810 |
|
0.705 |
0.438 |
|
|
N |
41 |
41 |
41 |
41 |
|
|
GROUP 3 |
Pearson Correlation |
-0.119 |
0.061 |
1 |
0.062 |
|
P-value |
0.460 |
0.705 |
|
0.702 |
|
|
N |
41 |
41 |
41 |
41 |
|
|
GROUP 4 |
Pearson Correlation |
-0.020 |
0.124 |
0.062 |
1 |
|
P-value |
0.899 |
0.438 |
0.702 |
|
|
|
N |
41 | 41 | 41 |
41 |
Discussions
In the current study, the effect of viral load levels in HIV-infected persons on plasma CALR levels was examined. The result of the study shows that plasma Calreticulin levels vary between individuals with different viral loads.
Of all the participants in the study, 58.5% were females and 41.5% were males. This relative bias towards the feminine gender has been explained by several researches that majorly found that women are more infected with HIV than their male counterparts who are exacerbated by their role in the society and biological vulnerability. Magadi [14] in a research on gender disparity in HIV infection across countries in sub-Saharan Africa found that women have about 60% more risk of being infected with HIV than men of similar sexual behavior, thereby suggesting that the observed differences cannot be attributed to sexual behavior. In a similar study published by UNAIDS [15], survey data suggest that HIV prevalence among women aged 20−29 years is higher than that among men of the same age group in all countries in western and central Africa and between five and nine times higher in some countries, including Côte d’Ivoire, the Gambia and Ghana. However, by the time they are 40−49 years old, men have similar HIV prevalence [15].
In our study, participants were fairly distributed among all age groups but with a concentration in the 20-29, 30-39 and 40-49 age brackets with 15.85%, 31.7% and 23.78% respectively with the highest of the remaining age groups being just 11.59% for 50-59 years. This could be attributed to factors that include but not limited to poverty, child marriage, and gender-based violence. Our findings are not so different from other researches on the age distribution of HIV infection including those of Risher et al. [16] and Awoyemi and Olusegun [17]. Awoyemi and Olusegun [17] in their study on HIV epidemiology in Nigeria found that the prevalence of HIV/AIDS is highest in the 35-39- and 40-44-years age groups.
In our study, HIV-positive individuals with suppressed, unsuppressed and low viral loads as well as HIV-negative persons were recruited for the study. Unsuppressed viral load (>1000 cp/ml) in patients on antiretroviral (ARV) therapy occurs when treatment fails to suppress a patient’s viral load [18] or when an HIV infected individual does not take ARVs at all. Both of which are associated with decreased survival and increased HIV transmission [18]. In our study, recently infected HIV patients (41) with unsuppressed viral loads who are yet to commence treatment were recruited with the highest viral load at 1,200,000 cp/ml.
Individual-level viral load is the recommended measure of antiretroviral therapy efficacy and indicates treatment adherence and the risk of transmitting HIV [19]. A viral load threshold of <1000 copies/mL is defined as viral suppression and <40 is tagged as undetectable levels - these define treatment success according to the WHO [19] consolidated guidelines on the use of antiretroviral drugs for treating and preventing HIV infection. People with viral load test results below the threshold should be considered as having suppressed viral loads or undetectable viral loads as the case may be. Our study recruited 41 HIV-positive patients with suppressed viral load with the highest viral load at 920 cp/ml and 41 HIV-positive patients with undetectable levels with the highest viral load at 40 cp/ml for evaluation of their plasma CALR levels.
In our evaluation of the plasma Calreticulin levels in individuals with unsuppressed viral load, suppressed viral load, low viral load, and HIV negative controls, we found a significantly higher (P = 0.00) plasma Calreticulin levels in individuals with low viral load when compared to the mean values of CALR for other three groups. This finding could be due to increased oxidative stress and ER stress that has been attributed to be associated with long-term HIV infection [20]. It is generally acknowledged that reactive oxygen species (ROS) play crucial roles in a variety of natural processes in cells. If increased to levels that cannot be neutralized by the defense mechanisms, they damage biological molecules, alter their functions, and also act as a signaling molecules thus generating a spectrum of pathologies [20].
The role of oxidative stress in disease progression shows that it is more complex in HIV-infected individuals receiving HAART compared to those who remain untreated [14]. Our findings of higher CALR levels in the group that has been more exposed to ARVs and hence with a higher possibility of oxidative stress is in corroboration with studies of Ihara et al. [21], and Zhang et al. [22], who independently found increased levels of Calreticulin in cells with H2O2 induced oxidative stress. When cells are exposed to oxidative stress, CALR increase in a time-dependent manner before 2 hours of phosphatidylserine exposure [22]. CALR exposure is so rapid that it is detectable as early as 1 hour after cell exposure to oxidative stress, and it precedes the apoptosis-associated phosphatidylserine [23]. Therefore, as an oxidative stress-specific danger signal, CALR expression may occur upstream of apoptosis in cells. The up regulation of CALR in oxidative stress and ER stress is supported by other findings, showing that CALR over expressing cells are more prone to apoptosis than CALR deficient cells [24]. Our finding is also in agreement with the findings of Keep et al. [25] and Bezu et al. [26] who found increased levels of Calreticulin in the presence of ER stress.
Notably, increased levels of plasma CALR in individuals with low viral load could also be due to the negative effect CALR has on the regulation of the cellular response to stress. CALR induces nuclear GR export, thereby switching off the activation of the stress-responsive genes which makes cells susceptible to novel ligand activation [27,28]. This finding is supported by the reports of Yang et al. [29] who generated an ER stress murine model via intraperitoneal administration of an ER stress inducer, tunicamycin and determined the hepatic expression of Calreticulin. As expected, the livers of tunicamycin-treated mice showed significantly increased levels of Glucose Regulated Protein 78 (GRP78), a representative marker of ER stress, compared with control individuals. The protein expression of hepatic Calreticulin was increased in tunicamycin-treated mice. Consistent with these findings, Calreticulin was dose-dependently up-regulated in HeLa cells treated with tunicamycin and another ER stress inducer, thapsigargin. Notably, the induction of ER stress by tunicamycin or thapsigargin was evidenced by the induction of GRP78, C/EBP-Homologous Protein (CHOP), and X-box Binding Protein 1 (XBP1).
Furthermore, we found a significant difference (p = 0.017) between the mean plasma CALR of the virally unsuppressed group and the virally suppressed group. The difference could also be attributed to HAART-induced oxidative stress due to long-term ARV medication that gave such patients viral suppression. The mechanism for this is as explained earlier.
The insignificant difference (p = 1.00) between the mean plasma CALR levels of the unsuppressed group and that of the control can be attributed to the non-use of ARV by individuals in the two groups which relates to reduced oxidative stress and ER stress, hence low levels of CALR. This is in corroboration with a report that concluded that CALR levels are altered by ARV usage due to ARV-induced stress of the ER in the test group but not in the control group [30]. Long-term ARV drugs trigger adverse side effects and toxicities, including, but not limited to, alterations in lipid and protein metabolism, insulin resistance, mitochondrial toxicity, oxidative stress, and neuronal damage [30]. Taken together, HIV-1-associated inflammation and ART lead to ER stress and activation of unfolded protein response (UPR) signaling in cells [30]. Weib et al. [31] found that the ARV Efavirenz is associated with an increase in oxidative stress markers, ER stress markers, and autophagy. Induction of ER stress occurred at pharmacologically relevant concentrations of efavirenz and resulted in reduced proliferation and cell viability of endothelial cells, which worsened in the presence of elevated efavirenz concentrations. In combination with the HIV protease inhibitor nelfinavir, both oxidative stress and ER stress became elevated in endothelial cells.
Conclusion and Recommendations
Our study highlights that there is up regulation of plasma CALR in HIV-infected patients, particularly those that have been on antiretroviral therapy for a long term. We believe and from existing literature that this up regulation is due partly if not solely to the oxidative stress and ER stress caused by the antiretroviral agents. Further studies are recommended for a better understanding of the effect of antiretroviral therapy on oxidative stress and ER stress which will be critical to curbing CALR level anomalies and possible gene mutations. Similar studies with more participants spanning across a wider population and or use of animal models and tissue and cell culture techniques are recommended for better statistical judgments and for more variables to be considered and easily manipulated.
Conflicts of Interest
We wish to write on the above subject matter. We wish to declare that there is no conflict of interest with respect to the submission of our manuscript to your journal.
Funding Statement
This research work is a self-funded.
Acknowledgments
We acknowledge all that contribute to the process of executing this research work.
References
2. Doitsh G, Galloway NL, Geng X, Yang Z, Monroe KM, Zepeda O, et al. Cell death by pyroptosis drives CD4 T-cell depletion in HIV-1 infection. Nature. 2014 Jan;505(7484):509-14.
3. Garg H, Mohl J, Joshi A. HIV-1 induced bystander apoptosis. Viruses. 2012 Nov 9;4(11):3020-43.
4. Cao D, Khanal S, Wang L, Li Z, Zhao J, Nguyen LN, et al. A matter of life or death: productively infected and bystander CD4 T cells in early HIV infection. Frontiers in Immunology. 2021 Feb 12;11:626431.
5. Biwer LA, Askew-Page HR, Hong K, Milstein J, Johnstone SR, Macal E, et al. Endothelial calreticulin deletion impairs endothelial function in aged mice. American Journal of Physiology-Heart And Circulatory Physiology. 2020 May 1;318(5):H1041-8.
6. Eggleton P, Bremer E, Dudek E, Michalak M. Calreticulin, a therapeutic target?. Expert Opinion on Therapeutic Targets. 2016 Sep 1;20(9):1137-47.
7. Wang WA, Groenendyk J, Michalak M. Calreticulin signaling in health and disease. The International Journal of Biochemistry & Cell Biology. 2012 Jun 1;44(6):842-6.
8. Varricchio L, Falchi M, Dall'Ora M, De Benedittis C, Ruggeri A, Uversky VN, et al. Calreticulin: Challenges posed by the intrinsically disordered nature of calreticulin to the study of its function. Frontiers in Cell and Developmental Biology. 2017 Nov 23;5:96.
9. Fucikova J, Spisek R, Kroemer G, Galluzzi L. Calreticulin and cancer. Cell Research. 2021 Jan;31(1):5-16.
10. Schank M, Zhao J, Moorman JP, Yao ZQ. The impact of HIV-and ART-induced mitochondrial dysfunction in cellular senescence and aging. Cells. 2021 Jan 16;10(1):174.
11. Yew WW, Chan DP, Singhal A, Zhang Y, Lee SS. Does oxidative stress contribute to adverse outcomes in HIV-associated TB?. Journal of Antimicrobial Chemotherapy. 2018 May 1;73(5):1117-20.
12. Sharma B. Oxidative stress in HIV patients receiving antiretroviral therapy. Current HIV Research. 2014 Jan 1;12(1):13-21.
13. Magadi MA. Understanding the gender disparity in HIV infection across countries in sub?Saharan Africa: evidence from the Demographic and Health Surveys. Sociology of Health & Illness. 2011 May;33(4):522-39.
14. UNAIDS. Young women more affected by HIV than young men in western and central Africa.unaids.org/en/resources/presscentre/featurestories/2019/june/20190618_gow_wca. Accessed 1st October, 2021.
15. Risher KA, Cori A, Reniers G, Marston M, Calvert C, Crampin A, et al. Age patterns of HIV incidence in eastern and southern Africa: a modelling analysis of observational population-based cohort studies. The Lancet HIV. 2021 Jul 1;8(7):e429-39.
16. Awofala AA, Ogundele OE. HIV epidemiology in Nigeria. Saudi Journal of Biological Sciences. 2018 May 1;25(4):697-703.
17. Waju B, Dube L, Ahmed M, Assefa SS. Unsuppressed Viral Load Level in Public Health Facilities: Nonvirological Predictors among Adult Antiretroviral Therapy Users in Southwestern Ethiopia. HIV/AIDS (Auckland, NZ). 2021;13:513.
18. World Health Organization. Consolidated guidelines on the use of antiretroviral drugs for treating and preventing HIV infection: recommendations for a public health approach. World Health Organization; 2016. https://apps.who.int/iris/handle/10665/208825 Accessed 1st October 2021.
19. Ivanov A, Valuev-Elliston VT, Ivanova O, Kochetkov SN, Starodubova ES, Birke Bartosch B. Oxidative Stress during HIV Infection: Mechanisms And Consequences. Oxidative Medicine and Cellular Longevity.
20. Ihara Y, Urata Y, Goto S, Kondo T. Role of calreticulin in the sensitivity of myocardiac H9c2 cells to oxidative stress caused by hydrogen peroxide. American Journal of Physiology-Cell Physiology. 2006 Jan;290(1):C208-21.
21. Zhang Y, Liu L, Jin L, Yi X, Dang E, Yang Y, et al. Oxidative stress–induced calreticulin expression and translocation: New insights into the destruction of melanocytes. Journal of Investigative Dermatology. 2014 Jan 1;134(1):183-91.
22. Prathyuman S, Sellappa S, Joseph S, Keyan KS. Enhanced calreticulin expression triggers apoptosis in the MCF-7 cell line. Asian Pacific Journal of Cancer Prevention. 2010 Jan 1;11(4):1133-6.
23. Tarr JM, Young PJ, Morse R, Shaw DJ, Haigh R, Petrov PG, et al. A mechanism of release of calreticulin from cells during apoptosis. Journal Of Molecular Biology. 2010 Sep 3;401(5):799-812.
24. Kepp O, Semeraro M, Bravo-San Pedro JM, Bloy N, Buqué A, Huang X, et al. eIF2? phosphorylation as a biomarker of immunogenic cell death. Seminars in Cancer Biology. 2015 Aug 1;33:86-92.
25. Bezu L, Sauvat A, Humeau J, Gomes-da-Silva LC, Iribarren K, Forveille S, et al. eIF2? phosphorylation is pathognomonic for immunogenic cell death. Cell Death & Differentiation. 2018 Aug;25(8):1375-93.
26. Macečková Z, Kubíčková A, De Sanctis JB, Hajdúch M. Effect of Glucocorticosteroids in Diamond-Blackfan Anaemia: Maybe Not as Elusive as It Seems. International Journal of Molecular Sciences. 2022 Feb 8;23(3):1886.
27. Timmermans S, Souffriau J, Libert C. A general introduction to glucocorticoid biology. Frontiers in Immunology. 2019 Jul 4;10:1545.
28. Yang Y, Ma F, Liu Z, Su Q, Liu Y, Liu Z, et al. The ER-localized Ca2+-binding protein calreticulin couples ER stress to autophagy by associating with microtubule-associated protein 1A/1B light chain 3. Journal of Biological Chemistry. 2019 Jan 18;294(3):772-82.
29. Nooka S, Ghorpade A. HIV-1-associated inflammation and antiretroviral therapy regulate astrocyte endoplasmic reticulum stress responses. Cell Death Discovery. 2017 Dec 4;3(1):1-1.
30. Weiß M, Kost B, Renner-Müller I, Wolf E, Mylonas I, Brüning A. Efavirenz causes oxidative stress, endoplasmic reticulum stress, and autophagy in endothelial cells. Cardiovascular Toxicology. 2016 Jan;16(1):90-9.