Abstract
Background: Treatment failure (TF) among patients receiving antiretroviral therapy (ART) against human immunodeficiency virus (HIV) impacts on treatment outcome and is becoming a public health concern globally. However, magnitude of TF and factors leading to it are poorly defined in the context of Ethiopia. Thus, the aim of this study was to determine the magnitude of TF and assess its determinants among HIV-infected patients on ART in Ethiopia.
Methods: A prospective and retrospective study was conducted from March 2016 to 2017. Retrospective clinical and laboratory data were captured from patients’ medical record. Socio-demographics and explanatory variables of participants were collected using pre-tested structured questionnaire and study participants were followed for additional 6 month after baseline viral load has been done to classify virologic failure (VF). Multiple logistic regression was conducted to assess risk factors associated with TF. Statistical significance was set at P-value less than 0.05.
Results: A total of 9,284 adults taking ART from a nationally representative 63 health facilities were included in the study. Viral Load Suppression (VLS) (VL<1000 copies/ml) among population taking HAART in Ethiopia were found to be 8,180 (88.1%). Thirtyfive percent of the study participants with VL>1000 copies/ml at baseline of the study were re-suppressed after six months of enhanced adherence and counseling, leading TF among population on ART in Ethiopia to be 983 (11%). Immunologic and clinical failure was significantly improved from 21.5% and 16.5% at ART initiation to 576 (6.2%) and 470 (5.0%) at baseline of the study, respectively. Medication adherence, disclosure of HIV status, missed appointment to ART, history of ART exposure prior to initiation, residency and marital status had significant association with TF.
Conclusions: The high level of VLS (88.1%) could explain the success of ART program in Ethiopia towards achieving the UNAIDS global target on viral suppression. TF among population taking ART in Ethiopia is still a public health concern, since 11% of virally failed population is maintained on failed first-line regimen. However, a significant improvement on immunologic and clinical outcome after ART initiation was maintained. Close follow-up of medication adherence, ensuring disclosure of HIV status, regular appointment follow-up to ART could significantly improve the treatment outcome of population on ART in Ethiopia.
Keywords
Antiretroviral therapy, Treatment failure, Viral suppression, Adherence
Introduction
For more than 35 years, the world has grappled with an AIDS epidemic that has claimed an estimated 35.0 million [28.9 million-41.5 million] lives and at its peak threatened global stability and security [1]. Sub-Saharan Africa suffers from the undue burden of HIV, with an estimated 70% of the world HIV/AIDS infections and deaths occur in this region [2,3]. Ethiopia is one of the sub-Saharan African countries most affected by the HIV pandemic. According to the latest Spectrum modeling, an estimated 610,335 people were living with HIV in 2018 [4].
Highly Active Antiretroviral therapy (HAART) is the lifesaving treatment for patients with HIV/AIDS, as it significantly reduces HIV-related mortality and morbidity [5]. According to the report of the World Health Organization (WHO), the number of people receiving ART reached >20 million by mid-2017, up from about one million a decade ago [6,7]. The impact of HIV infection has significantly decreased due to expansion of HAART [6]. The aim of the treatment is to suppress virus replication for as long as possible, restore and/or preserve immune function, improve quality of life, and reduce HIV-related morbidity and mortality [6]. But this has not always been true due to Treatment Failure (TF), which can be explained by virological, clinical, or immunological causes.
Antiretroviral therapy has been consistently reported to suppress HIV-RNA to undetectable levels and has decreased risk of clinical progression [2,8]. Despite these successes, increases in antiretroviral TF due to drug resistance and/or sub-optimal adherence to the regimen pose a major impediment to ART program. The WHO recommends viral load testing as the preferred approach to monitoring ART success and diagnosing treatment failure [9,10].
WHO recommended that consecutive viral load measurements to confirm and define TF, among people receiving ART which should be performed 6 months after initiating ART and every 12 months thereafter [11]. Virological Failure (VF), which is a more informative measure of treatment failure [12]. Monitoring individuals on ART for treatment failure remains the key challenges due to sub-optimal access to HIV Viral Load (VL) testing for routine follow-up of treatment [13,14]. Current guidelines recommend that once patients start treatment, TF should not exceed 10% [11]. However, studies show that TF is much higher than expected and viral replication continues to be a major challenge among patients living with HIV [15]. Patients who experience TF will have increased risk of morbidity, mortality, on ward transmission as well as accumulation of drug resistance mutations when compared with patients with complete virological response [16]. Previous studies revealed that various factors were associated with treatment failure [6,16-18].
Appropriate response to TF requires data on populationlevel estimates of treatment failure (virologic, immunologic and clinical outcome) to guide the national ART program to achieve successful treatment outcomes. Determining the magnitude of TF and identifying the associated risk factor of TF are of paramount importance to achieve a high treatment success rate and improve the quality of life of People living with HIV. However, there is limited evidence on the magnitude of treatment failure and determinants of treatment failure among HIV-infected patients on ART in Ethiopia. Thus, this study aimed to determine the magnitude of treatment failure and identify the risk factor of treatment failure among HIV-infected patients on ART in Ethiopia.
Subjects and Methods
Study design and population
A retrospective and prospective follow-up study was conducted across the nationally representative Health Facilities (HFs) in Ethiopia. Baseline VL testing was done followed by second round VL testing after three to six months of intensive adherence counseling for patients with VL>1000 copies/ml at baseline to determine Treatment Failure (TF) as defined by WHO-2013 [10]. Pre-established tools and questioner were also used to assess determinants of TF. HFs providing ART service for at least 60 patients and with at least 9 month of ART service experience was part of this study. Study participants within the HFs were those who had at least 9-month ART experience.
Sampling technique was illustrated in the Figure 1. HFs to be included in this study was selected by using two stage cluster design. All HFs providing ART service in the country, by 2014, were listed (N=1,047). Following this, HFs serving for less than 60 ART patients was defined as facilities providing very small number of ART patients. These HFs were 415 in number and had for 7,992 (i.e. 2.47%) of the total ART patients in the country. Accordingly, 632 HFs have been included in this study (Figure 1).
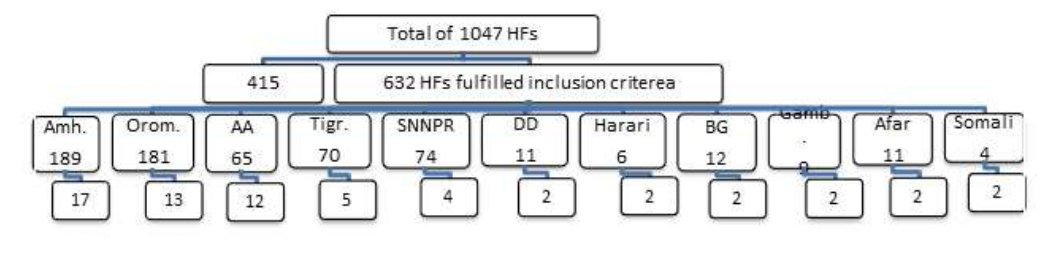
Figure 1: Number of selected HFs by region.
According to the WHO recommendation, selection of 40 HFs is sufficient for nationally representative Virologic Failure (VF). However, due to the heterogeneity of the study participant load across the HFs and regions in Ethiopia, some regions and HFs with small number of ART patients may not be represented with this limited number of facilities to be sampled. Provided that one health center and one hospital should be represented across all the regional administrations in the country to maintain administrative balance, we included additional 23 HFs. Hence, the total numbers of HFs included in the study were 63.
Study participants were further stratified in to three based on the duration on ART: strata “A” (12 ± 3 months), strata “B” (between 15 to 47 months) and strata “C” (at least 48 months). Moreover, it had also been reported that there is a 10% increment in treatment failure across each respective stratum [19,20].
Magnitude of VF among strata “A” adult HIV-1 infected patients in seven university hospitals in Ethiopia is reported as 7% (unpublished data-EPHI). A confidence interval of half-width of ± 5% has been used as appropriate compromise between feasibility and precision with 95% Confidence Interval (CI). Moreover, numbers of adults on ART within the HF across each stratum by the end of 2014 have been independently considered and calculated using the formula:
n = (Z2α/2× P (1 – P))/e2
Where;
Z = value from standard normal distribution corresponding to desired confidence level (Z=1.96 for 95% CI)
P= Expected true proportion (0.07)
e= Desired precision (0.05)
Assumptions for sample size determination were: Proportion of patients on ART at different time point be 6% Strata “A”, 15% strata “B” and 79% strata “C” accordingly the population understudy would be 270,562; 317,443 and 343,511 respectively [21]. Prevalence difference between each stratum was also assumed to be 10% [19]. Interview response rate and laboratory failure rate were considered to be 90% and 15% [19] respectively. Considering 82.4% retention [22] and 10% non-respondent rate, a total sample size for adult population in this study is estimated to be 11,342.
Variables of the study
Immunologic Failure (IF), VF and Clinical Failure (CF) were considered to be dependent variables whereas sociodemographic variables, duration on ART, variable related to patient social behavior (disclosure, use of treatment assistant, use of memory aids, use of alternative medicine, use of alcohol and substance abuse, missed appointments), knowledge and perception on HIV and ART (knowledge and information on ART, Perception of treatment) and ART service delivery environment (waiting time, distance to the clinic, quality of care, trust in health care, providers, pill burden) were independent variables.
Data collection
Data were collected in two rounds, to classify the study population whether confirmed treatment failure or not per the WHO classification [10]. Base line data were captured for the study participants from March to August 2016. Second-round data collection was specific for the study participants with baseline viral load>1000 copies/ml since December 2016 to March 2017.
Types of data source
Primary data source: Pre-established questioner, used to capture data related with medication adherence, knowledge, attitude and perception on ART, service delivery environment and other demographic variables.
Secondary Data source: Secondary data were collected from the review of participants’ medical record. These variables included medical history at three points; by the time the participant start ART, the latest record prior to the data collection and record during the data collection. Some of the key variables were CD4+, T-cell count, Clinical status per WHO classification, Medication adherence history.
TM or BD FACS Calibour TM(Becton Dickinson, USA).
Viral load testing: VL testing was conducted at baseline of the study and repeated for the study participants with baseline viral load >1000 copies/ml for the second round.
Viral load testing was conducted at the regional laboratories of the country using Abbott m2000sp system (Abbott Laboratories, Abbott Park, IL, USA) and COBAS® AmpliPrep/COBAS® Taq Man® HIV-1 Test, v2.0.
Statistical analysis
The cumulative magnitude of VF was estimated from the proportion of adult with VL>1000 copies/ml both at baseline and second round of the study. Similarly, magnitude of immunologic and clinical failure was determined as per WHO definition [10].
Factors associated with VF was evaluated by comparing variables among adult who failed with those who never failed using the chi-square test for categorical data and using student-t test for continuous variables. Logistic regression was done to determine the factors contributing to VF. The model was then built by dropping the most insignificant factor one at a time with factors whose P<0.05 were taken to be the factors that were independently associated with VF. All analyses were done using SPSS version 20.
Operational definitions
Adherence: The degree to which the person’s behavior corresponds with the agreed recommendations from a health care provider.
ART experience
Early stage ART experience: Population with ART experience from 9 to 15 months
Mid-level ART experience: Population with HAART experience from 16 to 47 months
Advanced ART experience: Population with ART experience with at least 48 months
Clinical failure: New or recurrent clinical event indicating severe immunodeficiency (WHO clinical stage 4 condition) after 6 months of effective treatment
Immunologic failure: CD4 count falls to the baseline (or below) or persistent CD4 levels below 100 cells/ mm3
Virologic failure: Plasma viral load above 1000 copies/ ml based on two consecutive viral load measurements after 3 months, with adherence support
Viral suppression: Plasma viral load above 1000 copies/ ml based on one viral load measurement
Ethics Statements
The project was ethically approved by EPHI Scientific and Ethics Review Office (SERO) before data collection. Confidentiality were respected during abstraction of data by the use of specific identification code for each enrolled patient number. Eligible study participants were identified by trained and experienced data collectors and supervisor at facility level. Information was provided about the study, and those willing to participate were provided with informed consent form to read and sign indicating that they understand the purpose of the study.
Results
Baseline characteristics
Of the 11,342 study participants 11,013 (98.2%) responded to participate in the study and 9,284 (84.3%) had successful VL result. Hence, the overall response rate at baseline of the study was 82.8%.
Table 1 shows demographic characteristics of HIVinfected people receiving ART. Demographically, 6,036 (65.0%) were female and 3,234 (35.0%) were male. The median age of the study participants was 39 years, ranging from 15 to 90 years. Of the 9,284 participants, 1,920 (21.0%) were under the age of 30 years and 2,351 (25.3%) had no formal education and 3,937 (42.4%) attended elementary education. The mean ART experience of the study participants was 59 months, majority of them had at least 48 months ART experience that accounted for 5,559 (72.2%) followed by 16 to 47 months 1, 738 (22.6%) and 407 (5.3%).
| Variable | Frequency | Proportion (%) | |
|---|---|---|---|
| Gender | Female | 6036 | 65 |
| Male | 3234 | 34.8 | |
| Education | No formal education | 2351 | 25.3 |
| Primary/Secondary Cycle | 3937 | 42.4 | |
| High School/Preparatory | 1835 | 19.8 | |
| College or University graduate | 1143 | 12.3 | |
| Marital Status | Single | 1085 | 11.7 |
| Married | 4547 | 49 | |
| Divorced | 1903 | 20.5 | |
| Widowed | 1731 | 18.6 | |
| Occupation | Government employee | 1726 | 18.6 |
| Merchant | 1478 | 15.9 | |
| Driver | 227 | 2.4 | |
| Housewife | 1440 | 15.5 | |
| Student | 107 | 1.2 | |
| Unemployed | 1202 | 12.9 | |
| Other | 2645 | 28.5 | |
| Duration on HAART (Months) | = 15 | 407 | 5.3 |
| 16 - 47 | 1738 | 22.6 | |
| = 48 | 5559 | 72.2 | |
Magnitude of treatment failure among population taking ART in Ethiopia
TF was classified according to WHO definition; VF is Plasma VL above 1000 copies/ml based on two consecutive VL measurements after 3 to 6 months of the baseline, with adherence support. Immunologic failure was defined as CD4 count falls to the baseline (or below) or Persistent CD4 levels below 100 cells/ mm3 and clinical failure is new or recurrent clinical event indicating severe immunodeficiency (WHO clinical stage 4 condition) after 6 months of effective treatment [10].
Viral Load suppression among population taking ART in Ethiopia
The mean VL at baseline of the study was 1,190 copies/ ml and the level of VLS among population taking ART in Ethiopia was 8,175 (88.1%) while 1,109 (11.9%) had not achieved viral suppression. VLS at various level of ART experience: 9-15, 16-47 and ≥ 48 months were 90.20%, 87.85% and 84.2% respectively.
Overall, the proportion of viral suppression among the regions and city administrations in the country ranged from 81.5-90.3%. VLS significantly varied across regions in the country. The highest proportion of viral suppression was achieved in Southern Nations, Nationalities and people region (SNNPR) (90.3%) followed by Dire Dawa and Harari (89.6%, 89.4% respectively). On the other hand, participants from Somali region had the lowest viral suppression (81.5%) followed by Gambella (82.7%) and Addis Ababa (85.3%) (Table 2).
| Region | VLS | P-value |
|---|---|---|
| Tigray | 88.56% | 0 |
| Dire Dawa | 89.55% | 0.61 |
| Addis Ababa | 85.29% | 0.95 |
| Afar | 93.50% | 0.02 |
| Amhara | 87.51% | 0.02 |
| Oromia | 88.30% | 0.28 |
| Somali | 81.52% | 0.51 |
| Benishangul Gumuz | 88.35% | 0 |
| SNNPR | 90.31% | 0.64 |
| Gambella | 82.72% | 0.57 |
| Hareri | 89.41% | 0 |
Virologic Failure among population on ART in Ethiopia
Study participants with VL>1000 copies/ml at baseline of the study were recruited for the second round, with a dropout of 19%. Accordingly, 895 (81%) out of the 1,105 participants were included for the second round VL testing, done after 3 to 6 months of enhanced adherence counseling. Subsequently, 316 (35.3%) of the 895 study participants were repressed during the second VL testing. Overall, the adjusted magnitude of virologic failure among population taking ART in Ethiopia were found to be 11%.
Immunologic and Clinical failure among population taking ART in Ethiopia
The mean CD4+ T-cell count among study participants during ART initiation and at baseline of the study improved from 193 to 482 cells/μl. There was statistically significant difference about CD4+ T-cell count at ART initiation and at baseline of the study (P=0.001; 95% C.I. 3.21-4.50). The level of Immunologic failure among population taking ART in Ethiopia was found to be 6.2%.
The level of clinical failure among population taking ART in Ethiopia improved from 16.5% at ART initiation to 0.5% (Figure 2). Clinical stage significantly improved at baseline of the study compared to the time when study participants were initiated for ART (P=0.003; 95% C.I. 2.91-3.24).
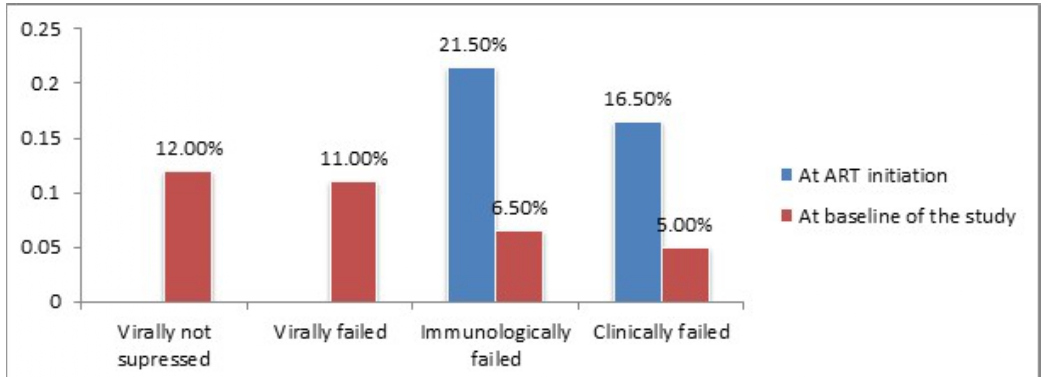
Figure 2: Level of treatment failure among population taking ART in Ethiopia.
Factors associated with viral suppression
Population taking ART living in rural Ethiopia was found to be at higher risk of virologic failure with odds ratio (OR) 1.5 (95% CI; 0.45-5.00; P=0.019). It was also found that, married individuals had higher VLS (95%CI; 0.31-1.24; OR=0.67; P=0.021). Individual factors; including, history of ART exposure before initiation, Alcohol use and disclosure of the HIV status had also association with viral suppression. Similarly, factors including, medication adherence, missed appointment and history of hospitalization also had association with viral suppression (Table 3).
| Variable | Viral suppression | Sig. | OR | 95% C.I. | |||
|---|---|---|---|---|---|---|---|
| suppressed | Not suppressed | Lower | Upper | ||||
| Residency | Urban | 7507 (88.2) | 1002 (11.8) | 0 | 0 | 0 | 0 |
| Rural | 636 (86) | 104 (14) | 0.019 | 1.5 | 1.05 | 5.03 | |
| Marital status | Single | 15 (88.2) | 2 (11.8) | 0 | 0 | 0 | 0 |
| Married | 951 (87.7) | 134 (12.3) | 0.021 | 0.67 | 0.31 | 0.84 | |
| Divorced | 4008 (88.1) | 539 (11.9) | 0.32 | 1.12 | 0.78 | 1.42 | |
| Widowed | 1666 (87.6) | 237 (12.4) | 0.29 | 1.29 | 0.89 | 1.56 | |
| Taken ART prior to initiation | Yes | 87 (87) | 13 (13) | 0.121 | 0 | 0 | 0 |
| No | 8053 (88.1) | 1087 (11.9) | 0.01 | 0.23 | 0 | 0.45 | |
| Disclosure of HIV status | Yes | 6929 (88) | 940 (12) | 0 | 0 | 0 | 0 |
| No | 928 (88) | 126 (11) | 0.045 | 1.26 | 1.11 | 1.52 | |
| Missed appointment in the last 6 months | Yes | 688 (89.7) | 79 (10.3) | 0.022 | 1.842 | 1.484 | 2.62 |
| No | 7213 (88) | 990 (12) | 0 | 0 | 0 | 0 | |
| History of hospitalization | Yes | 144 (86.8) | 22 (13.2) | 0.002 | 2.366 | 1.29 | 24.477 |
| No | 7997 (88) | 1084 (12) | 0 | 0 | 0 | 0 | |
| Alcohol use | Yes | 132 (88) | 18 (12) | 0 | 0 | 0 | 0 |
| No | 7989 (88) | 1088 (12) | 0.047 | 0.86 | 0.646 | 0.981 | |
| Adherence (Visual Analogue scale) | Low | 368 (90.6) | 38 (9.4) | 0.0001 | 4.26 | 3.56 | 5.63 |
| Moderate | 602 (86.4) | 95 (13.6) | 0.42 | 1 | 0.64 | 1.35 | |
| High | 7088 (88) | 961 (12) | 0 | 0 | 0 | 0 | |
Factors associated with Immunologic failure
Marital status (p=0.003), previous history of ART exposure prior to ART initiation (P=0.001), history of use of herbal drugs (P=0.046) and alcohol use (P=0.034) had association with Immunologic failure (Table 4).
| Characteristics | Immunologic Failure | X2 | 95% C.I. | |||
|---|---|---|---|---|---|---|
| Yes | No | Lower | Upper | |||
| Marital Status | Single | 86 | 999 | 0.003 | 0.002 | 0.003 |
| Married | 289 | 4258 | ||||
| Divorced | 112 | 1791 | ||||
| Widowed | 87 | 1644 | ||||
| Taken ARV before ART Initiation | Yes | 8 | 92 | 0.001 | 0 | 0.002 |
| No | 563 | 8577 | ||||
| Herbal medicine | Yes | 3 | 150 | 0.046 | 0.041 | 0.05 |
| No | 569 | 8512 | ||||
| Alcohol/substance use | Yes | 2 | 148 | 0.034 | 0.03 | 0.038 |
| No | 570 | 8507 | ||||
Factors associated with Clinical failure
Residency (P=0.008), Marital status (P=0.002), use of Herbal Medicine (P=0.040) and Disclosure status of HIV (P=0.004) had significant association with clinical failure (Table 5).
| Characteristics | WHO Stage at Baseline | X2 | 95% C.I. | ||||||
|---|---|---|---|---|---|---|---|---|---|
| I | II | III | IIII | IV | Lower | Upper | |||
| Residency | Urban | 1350 | 2000 | 4020 | 14 | 946 | 0.008 | 0.006 | 0.009 |
| Rural | 139 | 167 | 342 | 1 | 83 | ||||
| Marital Status | Single | 134 | 281 | 506 | 2 | 131 | 0.002 | 0.001 | 0.002 |
| Married | 825 | 1080 | 2073 | 7 | 476 | ||||
| Divorced | 308 | 396 | 934 | 4 | 220 | ||||
| Widowed | 225 | 415 | 856 | 2 | 203 | ||||
| Herbal medicine | Yes | 28 | 34 | 72 | 0 | 19 | 0.04 | 0.036 | 0.044 |
| No | 1459 | 2126 | 4289 | 16 | 1005 | ||||
| Disclose status to someone | Yes | 1239 | 1830 | 3752 | 11 | 878 | 0.004 | 0.002 | 0.005 |
| No | 195 | 253 | 462 | 2 | 125 | ||||
There were significant association between VF and IF (X2=3.11, P=0.001) and clinical failure had also significant association with VF (X2=6.446, P=0.03). As limitation of the study, we could not verify whether the observed virological failure was due to resistance to ART drugs or not. Our data also showed considerable lost-to-follow up for the second round VL testing and missing data which might introduce some errors in our estimation.
Discussion
In this nation-wide study, we evaluated the level of virological failure (using the definition of HIV-RNA VL>1000 copies/ml) amongst HIV infected adults receiving ART in Ethiopia and the determinants of VF.
The findings of this study indicate the success of the ART program in the country. The finding of 11% VF in this study was lower than those studies from a number of lower than the figures from a number of low- and middle-income countries [10,17,23-26]. The 88.1% VLS in this study is consistent with the finding of a previous cross-sectional study from Ethiopia in Tigray region which reported that TF was 11.5% while it is higher than a figure from a study conducted in Gondar (4.5%) [23,27]. Despite having an overall high virological success, the level of virological suppression achieved in the subsequent viral load measurement among the patients with initial virological failure was low (35.3%). The possible explanation for such unfavorable prognosis after a long follows up could be due to the development of resistance to the current ARV drug and/or due to poor adherence to the treatment regimen. Our study supplemented the hypothesis in that, there was significant association between VLS and medication adherence.
This study also sought to compare regional variations in virological response of HIV patients. Our data showed a relatively higher VF among patients residing in Somali (18.5%), Gambella (17.3%), and Addis Ababa (14.7%). The least virological failure was noted among the patients from Afar region (6.5%). We have no clear explanation for such disparity in virological failure rate across the regions. Taking their geographical location into account, the observed virological failures in Somali and Gambella regions might be partially explained by some logistic problems in getting pills on time as well as in obtaining psychological support. These might lead to low adherence and the consequent VF. However, our speculation does not explain the least VF observed in Afar region, despite their similarity with the logistic issues, and to that of Addis Ababa too where the above-mentioned challenges expected to contribute the least, if at all.
This study revealed a high level of HIV VLS among the study participants. About 88.1% of the study participants achieved virological suppression in the first round of the study. This is in line with the Ethiopian Population based HIV Impact Assessment (EPHIA) that reported 89% [10]. This finding is also concurrent with the routine data from the country’s HIV program 87.3% (unpublished). VLS significantly varied by regional administrations in the country, which is also similar with the EPHIA report while there is limited disaggregated data at health facility level. This report is also in line with the estimation projection of the country’s 90-90-90 performance by UNAIDS [28]. However, it is higher compared to a systematic review conducted in sub-Saharan Africa that reported VLS as 76% [ 29].
There was significant VL re-suppression after adherence and counseling for 3 to 6 months. Hence, confirmed VF among population taking ART in Ethiopia was found to be 11% which is the first report for the country. This finding contradicted with the report in HIV clinic of the coastal Kenya reported as 24.6% [17] and 6% [30] while it concurred with a study conducted in Uganda reported as 12.6% [31].
The finding from this study revealed that, the level of IF among population on ART in Ethiopia was 6.5% which is lower than that of a study conducted in Kenya which showed 13.3% while CF in this study indicated as 5% which is in line with a similar study conducted in Kenya (5.7%) [30].
Most of the variables which found to have association with TF in this study were established facts to predict TF and are among the global recommendations to improve TF [32-34]. Among these, medication adherence, disclosure of HIV status, missed appointment to ART, history of ART exposure prior to initiation, residency and marital had significant association with VLS which is in line with most of the studies conducted in low- and middle-income countries [35-39].
Conclusion
TF among population taking ART in Ethiopia is still a public health concern, since 11% of virally failed population is maintained on failed first line regimen. The level of VLS (88.1%) could explain the programmatic success of Ethiopia towards achieving the UNAIDS global target 90-90-90 with regards to the third 90. Close follow-up of medication adherence, ensuring disclosure of HIV status, regular appointment follow-up to ART could significantly improve the treatment outcome of population on ART in Ethiopia.
Acknowledgment
We are grateful to the patients for participating in our study and to all health professionals and data collectors who involved in this work. We are very thankful to the CDC/E and FHAPCO for providing technical support throughout the study.
Competing interests
The authors declare that they have no competing interests.
Funding
The authors disclosed receipt of financial support for the research and publication of this article from Global fund through FHAPCO. The role Global fund during the project was limited to only financial support and follow-up the project while FHAPCO was involved on the design, data collection and analysis.
Authors’ contribution
YG: conceived the research idea, designed the study, conducted data collection and analysis, wrote the first and subsequent drafts of the manuscript; YA: oversee the overall project performance since the inception, guide the data collection, analysis and manuscript write-up. EA: support the manuscript writing; AG, KZ, RT, MG, GG, DK, TD: participated in the research design, critically reviewed and provided extensive feedback on all drafts of the manuscript. All authors approved the final version of the manuscript for submission.
References
2. UNAIDS data 2018. Retrieved from https://www. unaids.org/en/resources/documents/2018/unaidsdata- 2018
3. UNPD on E. AIDS “Global AIDS Monitoring” 2018. Retrieved from https://www.unaids.org/sites/default/ files/media_asset/2017-Global-AIDS-Monitoring_ en.pdf
4. Ababa A. HIV Related Estimates and Projections for Ethiopia March 2018, no. March, 2018.
5. Sellers CJ, Wohl DA. Antiretroviral therapy: when to start. Infectious disease clinics of North America. 2014 Sep;28(3):403.
6. World Health Organization. Consolidated guidelines on the use of antiretroviral drugs for treating and preventing HIV infection: recommendations for a public health approach. World Health Organization; 2016.
7. A. Manuscript, “NIH Public Access,” vol. 27, no. 0 2, pp. 1–20, 2014.
8. Federal Minstry and O. F. Health, “National Guidelines For Comprehensive Hiv Prevention, Care And Treatment. 2017. Retrieved from https://aidsfree. usaid.gov/sites/default/files/resources/ethiopia_art_guidelines_2017.pdf
9. HIV Treatment care, “HIV TREATMENT AND CARE WHAT’ S NEW IN TREATMENT MONITORING : VIRAL LOAD AND CD4 TESTING,” no. July, 2017.
10. Table 7.15 WHO definitions of clinical, immunological and virological failure for the decision to switch ART regimens. p. 15. Retrieved from https:// www.who.int/hiv/pub/guidelines/arv2013/art/WHO_ CG_table_7.15.pdf
11. UNAIDS. “90-90-90 An ambitious treatment target to help end the AIDS epidemic.” Retrieved from http://Www.Unaids.Org/Sites/Default/Files/Media_ Asset/90-90-90_En_0.Pdf, p. 40, 2014.
12. UNAIDS (Joint United Nations Program on HIV/ AIDS). Access to Antiretroviral Therapy in Africa, 2013. Status Rep. Prog. Towar. 2015 targets, pp. 1–10, 2013.
13. Administrator, “Country Progress Report on the HIV Response, 2014. Retrieved from https://www.unaids.org/sites/default/files/country/ documents/ETH_narrative_report_2014.pdf
14. World Health Organization. Global update on HIV treatment 2013: results, impact and opportunities.
15. Assefa Y, Gilks CF, Dean J, Tekle B, Lera M, Balcha TT, Getaneh Y, Van Damme W, Hill PS. Towards achieving the fast-track targets and ending the epidemic of HIV/AIDS in Ethiopia: successes and challenges. International Journal of Infectious Diseases. 2019 Jan 1;78:57-64.
16. UNAIDS, “Global AIDS Update 2016,” World Heal. Organ., no. March, p. 422, 2016.
17. Hassan AS, Nabwera HM, Mwaringa SM, Obonyo CA, Sanders EJ, de Wit TF, Cane PA, Berkley JA. HIV- 1 virologic failure and acquired drug resistance among first-line antiretroviral experienced adults at a rural HIV clinic in coastal Kenya: a cross-sectional study. AIDS research and therapy. 2014 Dec;11(1):9.
18. Celentano DD, Davis WW, Beyrer C. HIV/AIDS Prevention, Treatment and Care: Present Status, Future Needs and Some Possible Solutions. InPublic Health Aspects of HIV/AIDS in Low and Middle Income Countries 2008 (pp. 697-705). Springer, New York, NY.
19. H. I. V. D. Resistance, “Hiv drug resistance,” no. July, 2014.
20. World Health Organization Protocol for Cross Sectional Surveillance of Acquired HIV Drug Resistance in Populations Failing First-line Antiretroviral Therapy,” pp. 1–51.
21. “ETH_narrative_report_2014.” .
22. Assefa Y, Alebachew A, Lera M, Lynen L, Wouters E, Van Damme W. Scaling up antiretroviral treatment and improving patient retention in care: lessons from Ethiopia, 2005-2013. Globalization and health. 2014 Dec;10(1):43.
23. Ayalew MB, Kumilachew D, Belay A, Getu S, Teju D, Endale D, Tsegaye Y, Wale Z. First-line antiretroviral treatment failure and associated factors in HIV patients at the University of Gondar Teaching Hospital, Gondar, Northwest Ethiopia. HIV/AIDS (Auckland, NZ). 2016;8:141.
24. Ferreyra C, Yun O, Eisenberg N, Alonso E, Khamadi AS, Mwau M, Mugendi MK, Alvarez A, Velilla E, Flevaud L, Arnedo M. Evaluation of clinical and immunological markers for predicting virological failure in a HIV/ AIDS treatment cohort in Busia, Kenya. PloS one. 2012 Nov 21;7(11):e49834.
25. Ojha CR, Shakya G, Dumre SP. Virological and immunological status of the people living with HIV/ AIDS undergoing ART treatment in Nepal. BioMed research international. 2016;2016.
26. Anude CJ, Eze E, Onyegbutulem HC, Charurat M, Etiebet MA, Ajayi S, Dakum P, Akinwande O, Beyrer C, Abimiku AL, Blattner W. Immuno-virologic outcomes and immuno-virologic discordance among adults alive and on anti-retroviral therapy at 12 months in Nigeria. BMC infectious diseases. 2013 Dec;13(1):113.
27. Hailu GG, Hagos DG, Hagos AK, Wasihun AG, Dejene TA. Virological and immunological failure of HAART and associated risk factors among adults and adolescents in the Tigray region of Northern Ethiopia. PloS one. 2018 May 1;13(5):e0196259.
28. The gap report. Retrieved from https://www. unaids.org/en/resources/documents/2014/20140716_ UNAIDS_gap_report
29. Barth RE, van der Loeff MF, Schuurman R, Hoepelman AI, Wensing AM. Virological follow-up of adult patients in antiretroviral treatment programmes in sub-Saharan Africa: a systematic review. The Lancet infectious diseases. 2010 Mar 1;10(3):155-66.
30. Ferreyra C, Yun O, Eisenberg N, Alonso E, Khamadi AS, Mwau M, Mugendi MK, Alvarez A, Velilla E, Flevaud L, Arnedo M. Evaluation of clinical and immunological markers for predicting virological failure in a HIV/ AIDS treatment cohort in Busia, Kenya. PloS one. 2012 Nov 21;7(11):e49834.
31. Reynolds SJ, Sendagire H, Newell K, Castelnuovo B, Nankya I, Kamya M, Quinn TC, Manabe YC, Kambugu A. Virologic versus immunologic monitoring and the rate of accumulated genotypic resistance to firstline antiretroviral drugs in Uganda. BMC infectious diseases. 2012 Dec;12(1):381.
32. “World Health Organization. Global update on HIV treatment 2013: results, impact and opportunities.
33. D. H.- Africa, “Drug-resistant HIV-1 in sub-Saharan Africa,” 2006.
34. Kebede MM, Zegeye DT, Zeleke BM. Predictors of CD4 Count Changes after Initiation of Antiretroviral Treatment in University of Gondar Hospital, Gondar in Ethiopia. Clin Res HIV/AIDS. 2015;1(2):1-5.
35. Gesesew HA, Ward P, Woldemichael K, Mwanri L. Prevalence, trend and risk factors for antiretroviral therapy discontinuation among HIV-infected adults in Ethiopia in 2003-2015. PloS one. 2017 Jun 16;12(6):e0179533.
36. Yimer YT, Yalew AW. Magnitude and predictors of anti-retroviral treatment (ART) failure in private health facilities in Addis Ababa, Ethiopia. PLoS One. 2015 May 6;10(5):e0126026.
37. O. Access and T. Hospital, “Open Access,” vol. 8688, pp. 1–10, 2015.
38. Biset Ayalew M. Mortality and its predictors among HIV infected patients taking antiretroviral treatment in ethiopia: a systematic review. AIDS research and treatment. 2017;2017.
39. Biadgilign S, Deribew A, Amberbir A, Deribe K. Adherence to highly active antiretroviral therapy and its correlates among HIV infected pediatric patients in Ethiopia. BMC pediatrics. 2008 Dec;8(1):53.