Abstract
This presentation considers theoretical investigations of dye-sensitized solar cells (DSSC). Theoretical methods were applied to investigate the interactions between titanium dioxide nanoparticles and sensitizers. The ONIOM model was used to obtain the geometries of different conformers of dye molecules with TiO2 and their binding energies. TD-DFT calculations were carried out to obtain the absorption spectra and the relative orbital energy levels of sensitizers and TiO2. The electronic couplings between different sensitizers and TiO2 were calculated using the fragment charge difference method. The redox potentials of the sensitizers are calculated to complete the full working cycle of a DSSC. We observed that the -COOH group is not the only possible binding site, and the sensitizers are more likely to be adsorbed horizontally on the TiO2 surface instead of being perpendicular to the surface having the -COOH group as a linker. The TiO2 nanoparticle was found to have minor influence on the absorptions of the sensitizers with the spectra shift smaller than 0.2 eV. TiO2 has more influence on the absorptions of softer and larger molecules because the interactions between sensitizers and TiO2 twist the conjugated chromophore structures. Compared to the neutral form, the deprotonated anion conformers of the sensitizers have larger binding energy and lower LUMO level against conduction band of TiO2. The gap between the LUMO of sensitizers and conduction band edge of TiO2 might indicate the coupling strength between the sensitizers and TiO2. Several binding groups have shown promising properties for interacting with the TiO2 nanoparticle and generally deprotonated anion forms of the dyes were strongly bonded to the TiO2 nanoparticle. The model and associated calculated results provide close agreement with experimental data and give crucial atomistic information of the relevant processes in dye-sensitized solar cells.
Keywords
Dye-sensitized solar cells, Density functional calculations, Charge transport, UV-Vis absorption, Redox potentials
Introduction
The demands for economically viable renewable energy sources are increasing day by day in modern society and solar energy has a great potential to satisfy the future need for such energy sources. Due to the shortcomings of the silicon-based solar energy devices [1,2], the strategy of using molecular component-based devices to build a large-scale solar power facility has developed rapidly over the past few decades. With the development of dye-sensitized solar cells (DSSCs), molecular and nanoscale devices pose a challenge to the traditional solid-state photovoltaic technology [3]. The record of efficiency of the DSSCs is as high as 12% [4,5], and a series of corresponding energy-saving production methods has been achieved [6,7]. However, as the efficiency of DSSCs has not reached the level of traditional solar cells yet, the room for improvement is still huge [8].
A typical DSSC is composed of a sensitizer adsorbed at a semiconductor film on a conducting glass, an electrolyte solution and another conducting glass electrode sputtered with a catalyst [9]. The working principle of the DSSCs can be decomposed into the following steps. Firstly, light absorbed by the sensitizer excites an electron which is then transferred to the semiconductor, leaving the dye positively charged. Secondly, the electrons diffuse through the semiconductor until they reach the electrically conductive surface for current collection and transport to the cathode which is coated with a thin layer of platinum catalyst. Subsequently, the I3- ions formed by oxidation of I- diffuse a short distance through the electrolyte to the cathode and the regenerative cycle is completed by electron from cathode to reduce I3- to I-. Finally, the I- ion moves toward the photoanode and is oxidized back to a I3- ion by transferring an electron back to the sensitizer, thus returning the sensitizers to its neutral state ready for the next cycle [10]. The efficiency of a DSSC is usually evaluated by the solar to electric power conversion efficiency (Eq. 1), η, which is determined by the short-circuit current  the open circuit photovoltage
  the fill factor of the cell
  and the intensity of the incident light
  .
.

The efficiency of a DSSC depends on (1) the electron transfer efficiency between the sensitizers and the semiconductor so that the sensitizers can inject the electron from its excited states into the electrode, (2) the reduction potential of the sensitizers where the sensitizers needs to be reduced from the cation to the neutral form by the electrolyte after the electron injection, (3) as well as the efficient binding of the sensitizer to the semiconductor. (4) As for the intensity of the incident light, it is something provided by nature and cannot be optimized with experiments.
A lot of experimental progress in the synthesis of electrode materials and the design of the sensitizers [11-14] have taken place but related theoretical calculations are relatively scarce. Most theoretical investigations of DSSCs are focusing on the calculation of the absorption spectra of the individual sensitizers [15-19]. Few studies have been made on the reduction potentials as well as the electron injection process [20-22]. Studies including the semiconductor effects of the sensitizers mostly focus on the absorption spectra of molecules in the presence of the semiconductor [23]. As for how the organic sensitizers are deposited on the semiconductor surface, how the energy levels of sensitizers and semiconductor electrodes interlace, and what is the effect of the relative energies of the orbitals of sensitizers and semiconductor energy bands on the electron injection. All of these issues remain mainly at the level of deduction based on experimental results. In addition, the semiconductor part in most previous theoretical studies was either very small compared to the sensitizers so that the investigation of the deposited form of the dye on the semiconductor surface is not of much practical significance [23-25], or was described by a relatively low level of method and comparable with the level of method that was used to calculate the absorption spectra [26]. Therefore, the main research objective of this study is to improve the computation model to describe the binding of the sensitizers on the TiO2 surface, which can be used to study the absorption properties of the sensitizers in the presence of TiO2, the deposited form of the sensitizers, as well as the relative energy levels of sensitizers’ molecular orbitals and semiconductor energy bands. Furthermore, to provide some insight into aspects such as how are the organic molecules deposited on the semiconductor surface? How does the semiconductor affect the geometry and absorption spectrum of a sensitizer? Why do the charge-separated states of the sensitizers improve the performance of solar cells?
In this study, six organic sensitizers (Figure 1): two subphthalocyanine analogs (SP1, SP2), two subporphyrinatoboron(III) sensitizers (SB1, SB2), one benzofuro[2,3-c]oxazolo[4,5-a]carbazole-type dye (Dy1) and one indoline dye (Dy2) that differed greatly in structure and properties, were studied here in order to have a relatively comprehensive understanding of the interactions between various organic sensitizers and TiO2. Conformer search was performed for all six sensitizers with a large TiO2 surface using the ONIOM (B3LYP/PM7) model. The conformers with significant differences in configuration are further studied by calculating the absorption spectra for the sensitizer without TiO2 as well as adsorbed on TiO2 at TD-DFT/M06-2X level of theory. The relative energy levels (HOMO and LUMO for sensitizers, conduction band and valance band of TiO2) of each conformer were obtained through the TD-DFT calculations at the same time, which were further used to calculate the electronic coupling between the sensitizers and TiO2. In addition, the redox potentials of the sensitizers are also studied for a more comprehensive understanding of the electron transfer process.
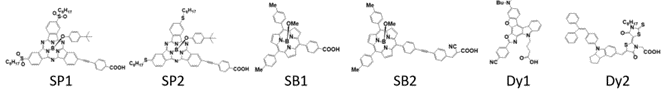
Figure 1. Structure of the six sensitizers. SP1 and SP2 are the subphthalocyanine analogs. SB1 and SB2 are the subporphyrinatoboron analogs. Dy1 is the benzofuro[2,3-c]oxazolo[4,5-a]carbazole-type fluorescent dye. Dy2 is indoline dye.
Method
This section contains descriptions of the different methods that we have used for modelling the device and it is divided into four subsections. We start out by presenting the methods for obtaining a realistic model for the TiO2 nanoparticle (TiO2 NP). This is followed by a subsection that gives a description of the model for the interactions between the dye molecules and the TiO2 NP. The third subsection concerns the model for calculating the redox potentials of the dye molecules. The last subsection gives the details of the model for calculating the electronic transfer elements that are crucial for electron transfer processes.
TiO2 cluster
A TiO2 anatase unit cell is first fully optimized with the CASTEP [32,33] program using the PBE functional [27] and ultra-soft pseudopotentials [28] and plane wave basis sets [29]. 9 (3×3×3) unit cells of TiO2 are merged into one supercell as the smallest repeat unit for optimization. The 4×7×9 k-points with pseudopotential representation in reciprocal space and the cut off energy of 340eV along with the SCF tolerance of 1.0e-6 eV/atom is used. Furthermore, we utilized the density mixing electronic minimizer method. The anatase form of TiO2 is chosen because it was experimentally proven that anatase is the preferred structure in DSSCs due to the larger bandgap and a higher conduction band edge energy compared to rutile, which leads to a higher Fermi level in DSSCs for the same concentration of conduction band electrons [30]. The unit cell size as well as the bond lengths of the obtained geometry are found to be in good agreement with the experimental results (S1).
Subsequently, an anatase-<101>-surface with 5 layers of Ti atoms are exposed. The <101>-surface is chosen due to the transmission electron microscopy measurements revealed that for TiO2 nanoparticles prepared under acidic conditions, crystalline anatase particles are formed exposing mainly the <101> surface [31]. In order to make the exposed surface more realistic, the first two layers of the surface structure are freely optimized again with a 30Å thick vacuum layer built on top of it.
Performing calculations with periodic boundary conditions in the CASTEP program for a system consisting of a dye molecule with more than a hundred atoms on a TiO2 <101> surface requires an extremely large simulation box as the smallest repeat unit. Therefore, the cluster approach is used here. A cluster with 387 atoms is cut out from the optimized anatase <101>-surface and hydrogen atoms are added to the edge of the cluster to make it a close-shell system (407 atoms in total with added hydrogen atoms). The structure of the TiO2 cluster which has a diameter of about 3.1 nm is then fixed for all the following calculations. This cluster is not fully symmetrized and has a dipole moment of 71 Debye calculated at PM7 level. The flow chart of obtaining this TiO2 NP is shown in Figure 2.
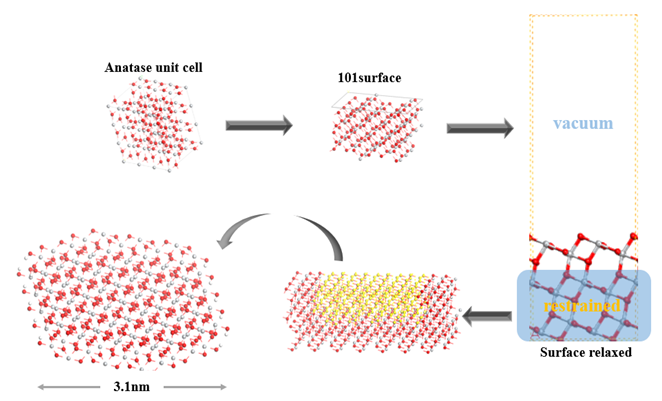
Figure 2. A schematic diagram of the method for obtaining the TiO2 NP.
Dye with TiO2 cluster
The ONIOM model [32-34] as implemented in the Gaussian16 program53 is used for the simulation of a dye molecule adsorbed on the TiO2. The B3LYP [35] /6-31G(d) [36-38] level of method is used for the dye molecules while PM7 [39] is used for the TiO2. The PM7 method is chosen because the TD-PM7 [40] calculation gives a bandgap of 3.16eV for this TiO2 NP (experimental value of 3.2eV43 ), implying that the band structures of TiO2 are reasonably described at PM7 level. During the conformer sampling, the TiO2 surface are placed in 14 different orientations (6 sides and 8 corners of the square contains the molecule) around the dye and the dye is fully optimized while the TiO2 part remained fixed. Solvent effects are included by arranging eighty acetonitrile molecules around the dye and optimizing them together with the dye using universal force filed method (UFF) [41] with electronic embedding as the third layer of the ONIOM model. Explicit solvent molecules are used in order to obtain a more realistic solvent effect on the geometry.
The binding energy was calculated by Eq. 2:

Where  is the sum of electronic and thermal free energies of the dye molecule without TiO2 at the B3LYP/6-31G(d) level with the geometry optimized on TiO2 surface,
  is the energy of TiO2 NP at PM7 level,
  is the sum of electronic and thermal free energies of dye with TiO2 optimized using the ONIOM model. The zero-point energy correction is only included for the dye molecule to avoid the frequency analysis of the large TiO2 part, we believe this is a fair approximation as the geometry of the TiO2 NP is fixed during the process of conformer sampling.
The ONIOM model helps to get the optimized geometry of such big system, but it does not allow the electron density to move from the dye into the TiO2 cluster due to the boundary layer between the different levels of methods. Therefore, a smaller model is abstracted out from the optimized conformer (Figure 3) to run TD-DFT [42-44] calculations with the M06-2X functional [45], where the 6-311+G(d) [46,47] was used for the basis set for the organic molecules and the 6-31G(d) [37] basis set for the TiO2 NP. The TiO2 slab in this smaller model has a band gap of 3.23eV calculated with M06-2X/6-31G(d), which is also in good agreement with the experimental values. From this calculation the relative orbital levels of the dye and TiO2 can be determined, and one can investigate how the optical properties of the dye would change under the influence of the semiconductor. The solvent effect was added by the IEF-PCM [48,49] model using acetonitrile as the solvent. When adding the solvent effect, the band structure of the small TiO2 slab changes a lot, which deviates from the actual device since the TiO2 part in the real DSSC is much thicker and will not be affected. Therefore, the relative energies of the dye orbitals against the bands of TiO2 are calculated using the highest occupied orbital localized on TiO2 with the solvent effect, and the calculations in vacuum are used for the bandgap of TiO2. All calculations were carried out in Gaussain16 [50] and all the models were viewed by Gaussview [51,52].
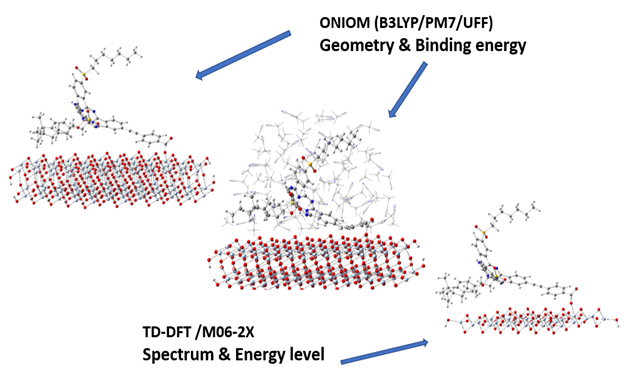
Figure 3. The geometry and the binding energies for all the conformers were obtained from the ONIOM model while the spectra and relative energy levels of dye and TiO2 were calculated by TD-DFT/M06-2X taking the optimized geometry.
Redox potential
The absolute redox (reduction and oxidation) potentials of each dye molecule were also calculated at the M06-2X/6-31G(d) level where the solvent (acetonitrile) is described by IEF-PCM. Here the oxidation potential is the potential between the oxidized form and the neutral state of the dye molecule, and the reduction potential is the potential between the reduced form and the neutral form. Detailed information about these calculations of redox potentials is given in reference [53]. Please note that although the 6-311+G(d) basis set was proven to describe this property better in the original paper, for the current investigation the use of diffuse functions was not possible due to convergence problems for the investigated systems. Therefore, a smaller basis set 6-31G(d) was used in this study and a comparison between two basis sets can be found in the supporting information (S5).
The experimental data was measured against different kinds of reference electrodes, and usually being further converted to a normal hydrogen electrode (NHE). Therefore, for further comparison with the experimental data, the absolute redox potentials were first corrected against the absolute potential of the Fc/Fc+ redox couple, which has been experimentally and theoretically estimated with an absolute potential about 4.7-5.2eV. Here we used the absolute potential of the Fc/Fc+ couple calculated at the M06-2X/6-311+G(d) level with IEF-PCM from the original method paper [53], which is 4.78eV. Subsequently, the obtained potentials were converted to the NHE value based on the Fc/Fc+ potential against NHE which is 0.48eV in acetonitrile according to experiment [54].
Fragment charge difference (FCD) method model
The charge transfer from the sensitizer to TiO2 can be modelled such that the sensitizer is the electron donor and TiO2 is the acceptor. For an electron transfer reaction from a donor part (D) to an acceptor part (A) of a chemical system, the electronic coupling, HDA, is an important factor in determining the rate of the electron transfer [55]. However, the electronic coupling cannot be obtained from adiabatic quantum calculations like DFT. Therefore, the fragment charge difference (FCD) method with adiabatic molecular orbitals completely localized on the donor and acceptor fragments of the system are used to estimate the electronic coupling [56,57]. Charge-localized states are constructed from the charge difference operator applied to the adiabatic molecular orbital states. Thereby, the diabatic states for the donor and acceptor are approximated by optimal rotating the adiabatic states to give the largest charge separation.
By using the Mulliken population analysis [58], Koopmans’ theorem and consider one-electron transfers, only two adiabatic molecular orbitals that resemble the diabatic states of the donor and acceptor are used to express the approximated electronic coupling:

where  is the transition charge difference,
  is the energy of the adiabatic molecular orbital localized at fragment F as either the donor or acceptor,
  is the charge difference before and after the electron transfer at fragment
  . The charge difference at fragment F is dependent on the atomic orbital coefficient elements for the linear combination of M atomic orbitals to express the two used adiabatic molecular orbitals,
  and
and  , and the overlap matrix elements of the atomic orbitals,
  :
:

where  means that the kth atomic orbital is localized on an atom in fragment F. In the same way, the transition charge difference is expressed by Mulliken charges:

The electronic couplings between the dye and TiO2 are calculated with the FCD method using a Python script that takes the adiabatic molecular energies, atomic orbital coefficient and overlap matrix elements as arguments from a Gaussian16 calculation. The arguments are attainable in the Gaussian16 output files when the keywords “pop=full IOp(3/33=1)” are used in the input files. Furthermore, the Python script needs to know the donor and acceptor fragments of the system, but it will automatically find the adiabatic molecular orbitals that give the most reliable electron transfer by calculating weight functions,  , defined as:

where  is the number of the molecular orbital investigated and
  is the number of the frontier molecular orbitals. This is done to restrict the transition around the frontier molecular orbitals. The donor and acceptor adiabatic molecular orbitals that give the highest weight functions are chosen by the Python script. However, some criteria must be fulfilled:
- The donor and acceptor molecular orbitals cannot be the same.
- The energy of the acceptor molecular orbital must be lower than the donor molecular orbital,
 .
. - The charge replacement,
 , must be greater than 0.10 A.U.
The transition length between the donor and acceptor fragments can be calculated by using the magnitude of the distance vector between the fragment charge centers. The fragment charge centers,  , are calculated by the charge weighted positions of each atom in the fragment:

where  is the atomic charge and
  is the position of atom a in fragment F consisting of N atoms.
Result and Discussion
In this section we present the results of our investigations in four subsections starting out by addressing the importance of the binding groups located on the sensitizers. The following subsection contains the results and discussion about the performance and UV-Vis absorptions of the different sensitizers. The redox properties of the different sensitizers are presented in the third subsection. The electron transfer coupling elements are presented in the last subsection.
Binding group test
Having sensitizers strongly bonded to the semiconductor is the prerequisite of making an efficient DSSC. Since the sizes of the organic sensitizers used in DSSC are usually large, it would be inefficient to start the geometry study with a fully functional molecule. Therefore, we started by investigating the interactions between a binding group and TiO2. Four commonly used binding groups are studied in this case, the first one (the carboxylate group) was used as a benchmark to compare the ONIOM (B3LYP/PM7) model used here with pure DFT studies that were performed by others [59,60].
There are two kinds of titanium atoms and three kinds of oxygen atoms on the relaxed <101>-surface as shown in (Figure 4), therefore, many similar conformers that only differ by the type of Ti atom and O atom that the binding group adsorbs on with close binding energies (difference smaller than 3kJ/mol) exist. We only included the conformers with a relatively large difference where the different type and number of atoms in the binding group are used as the binding site in (Figure 4). The conformers for all binging groups can be found in the supporting information (S9). This approximation leads to the neglecting of the energy difference caused by different kinds of oxygen atoms and titanium atoms on the TiO2 surface that the binding group is absorbing on. The binding energies from the ONIOM model shows reasonable agreement with the pure DFT study [60], especially considering that the ONIOM model greatly saves computational time. The difference in binding energy of the same conformer (the type of Ti and O on the surface that interact with the binding group are the same) from the ONIOM model and pure DFT calculations is less than 5 kJ/mol. The difference in binding energy for similar conformers (only the type of Ti and O atom on the surface that the binding group interacted with is different) from different calculation methods is about 14 kJ/mol, which accounts for less than 15% of the total binding energy for most conformers (S2).
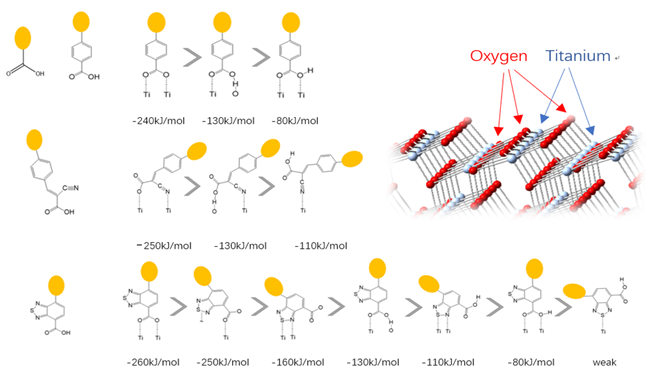
Figure 4. Four different binding groups and the possible conformers of them are shown together with the approximate binding energy. Similar conformers that only differ in the bonded Ti and O atoms on the surface are classified as the same conformer. The yellow dots represent the rest of the sensitizer structures, which were replaced by a hydrogen atom in the binding group test.
The results suggest that the carboxylate group is not the only possible binding group. Even just a sulfur atom could interact with the titanium atoms on the surface, and the electropositive hydrogen atoms on the binding groups could form weak hydrogen bonds with the oxygen atoms on the TiO2 surface. The deprotonated anion form of the binding groups has stronger interactions than the neutral form with TiO2 for all four binding groups, as the binding energy of an anion is about 100 kJ/mol higher than that of the neutral molecule. It is worth noting that total energies of the system are affected by the charge transfer as well as the binding energy, and this effect is not considered by the ONIOM model. We believe the charge transfer effect is small compared to the geometry effect in this case for the neutral form of the dye. The charge transfer effect can be larger for the deprotonated anion form, but the effects are similar for each anion. Therefore, the geometry effects are still dominant when comparing the conformer of each anion sensitizer.
Molecule comparison
With some knowledge of the interaction between the binding group and TiO2 based on the binding group test, six sensitizers from different categories were chosen to study the interactions between sensitizers and TiO2 (Figure 1). Subphthalocyanine analogs (short as SubPc or SP), which formed a particular macrocyclic ring arranged by three isoindole subunits that are bound together by three azabridges, possess a 14 π-electron aromatic core with a nonplanar cone-shaped conformation [61]. The cone-shaped aromatic structure of these molecules leads to a low tendency to aggregate in solution and in the solid state as well as chemical flexibility because of the possibility of functionalization at the axial and peripheral positions. A substantial amount of progress has been made in the use of SubPcs for organic solar cells. Two SubPc molecules (Figure 1. SP1 and SP2) synthesized by Maxence, Urbani and coworkers [62] were chosen here. Interestingly, these two similar molecules with almost identical absorption spectra performed differently in the solar cell, the solar to electric power conversion efficiency of SP2 (0.91%) is about four times better than that of the SP1(0.23%) [62]. The identical absorption property makes one suspect that the difference in efficiency is caused by the interaction between the molecule and TiO2 or the difference in the reduction process of the molecule after the electron injection. Subporphyrinatoboron (short as SubB or SB) is a ring-contracted cousin of porphyrin which houses a central boron atom. SubB singlet excited states bear resemblance to those of porphyrin, emit fluorescence with reasonably high quantum yields, and display single exponential decays with lifetimes on the order of several nanoseconds [5]. Such properties suggest that SubBs are promising candidates as sensitizers in DSSCs. Two of the SubB molecules (Figure 1. SB1 and SB2) synthesized by Graeme Copley and coworkers [5] were chosen. Again, SB2 is differ from SB1 only by an extended acceptor group, while the DSSC performance of SB2 is much better than SB1. It should also be noted that the core structures of SubPc and SubB also have a lot of similarities, but the DSSC efficiency of SubB is much higher than that of the SubPc. The SB2 molecule chosen in this study is one of the most effective sensitizers with a solar to electric power conversion efficiency of 10.1%, while the highest efficiency of SubPc is only 1.54% [63]. Two more molecules very different from SubB and SubPc were chosen (Figure 1. Dy1 and Dy2). The first benzofuro[2,3-c]oxazolo[4,5-a]carbazole-type fluorescent dye (Dy1) was selected because it was one of the earliest molecules that was proposed as a “donor-π-acceptor system” (η=1.06%) [64]. Dy2 was chosen as one of the sensitizers with the highest solar to electric power conversion efficiency (η=9.52%) that has ever been made other than SB2 [4]. The conformers of the dye in this section are labeled by “Name of the molecule-Charge-Conformer number” (eg. the label “SP1-1-1” means the first conformer of the deprotonated form with one negative charge of molecule SP1).
The binding sites for all conformers of the six sensitizers are shown in (Table 1) and the binding energies of conformers for all six dyes that have been studied are shown in (Figure 5). The structures for all conformers are shown in S9. Consistent with previous binding group test results, anions have larger binding energies compared to the neutral forms. The binding energies of the six sensitizers that have been studied are generally smaller than that of the binding groups, which was also observed when we tried to extend the conjugated system of the binding group: the larger the aromatic systems are, the smaller the binding energies are (S2). This is due to conjugation, creating a more uniformly distributed electronic density in the molecule which leads to less charge concentrated on the binding sites and weaker interactions. Two examples of the conformers for neutral SP1 and anion SP2 are shown in (Figure 6), which represents a typical “lying down” conformer where the sensitizer lays horizontally on the surface (Figure 6. left) and a “standing conformer” where the sensitizer interacts with the surface mainly through the binding site (Figure 6. right) respectively. The conformer SP2-0-3 and Dy1-0-1 (S9) are the only “standing” conformers found during the conformer sampling that match the previously proposed “push-pull” molecule, i.e. that the sensitizer is standing on the surface while the donor groups push the electron density all the way through the chromosphere to the accepter groups and finally into the semiconductor [65,66]. Meanwhile, the conformers of SP2 generally have larger binding energies than SP1 both for the anions and neutral molecules because the oxygen atoms on the sulfoxide group on SP1 increase the distance from the dye to the TiO2 and leads to weaker bonding (S4).
|
Conformer |
SP1-0-1 |
SP1-0-2 |
SP1-0-3 |
SP1-1-1 |
SP1-1-2 |
|
|
Binding site |
|
|
|
|
|
|
|
Conformer |
SP2-0-1 |
SP2-0-2 |
SP2-0-3 |
SP2-0-4 |
SP2-1-1 |
SP2-1-2 |
|
Binding site |
|
|
|
|
|
|
|
Conformer |
SB1-0-1 |
SB1-0-2 |
SB1-1-1 |
SB1-1-2 |
|
|
|
Binding site |
|
|
|
|
|
|
|
Conformer |
SB2-0-1 |
SB2-0-2 |
SB2-1-1 |
SB2-1-2 |
SB2-1-3 |
|
|
Binding site |
|
|
|
|
|
|
|
Conformer |
Dy1-0-1 |
Dy1-0-2 |
Dy1-1-1 |
Dy1-1-2 |
|
|
|
Binging site |
|
lying |
|
lying |
|
|
|
Conformer |
Dy2-0-1 |
Dy2-0-2 |
Dy2-1-1 |
Dy2-1-2 |
Dy2-1-3 |
|
|
Binding site |
lying |
standing |
Lying |
lying |
standing |
|


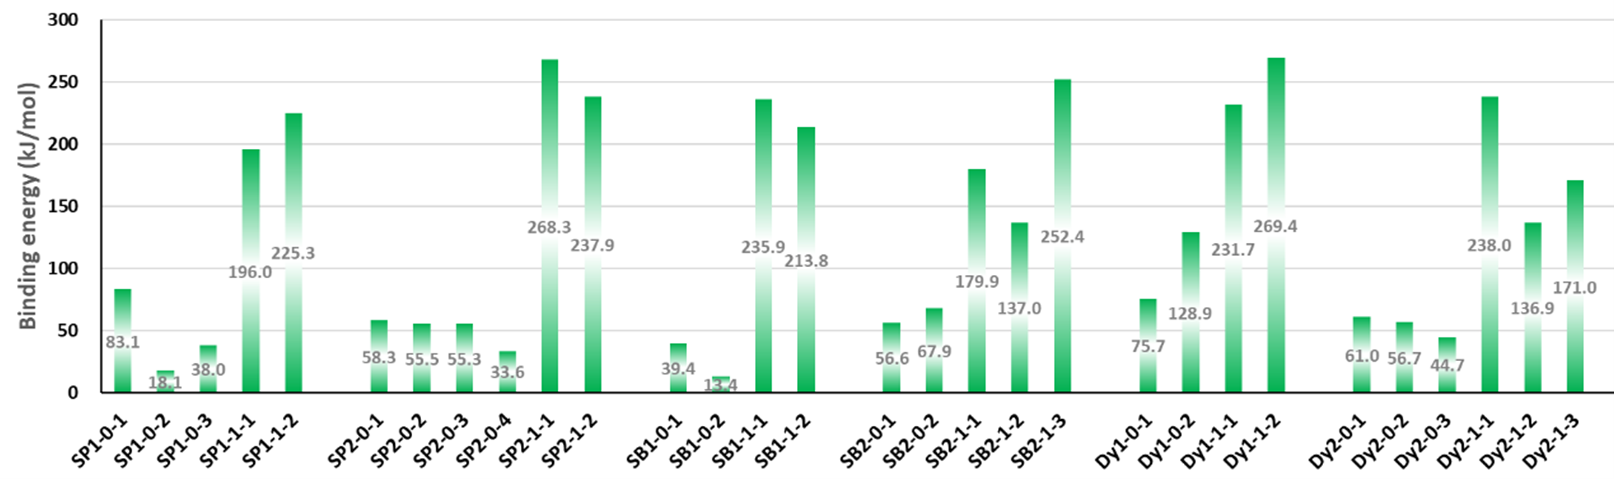
Figure 5. The binding energies of different conformers of the six sensitizers. The conformers are labeled by “Name of the molecule-Charge-Conformer number”.
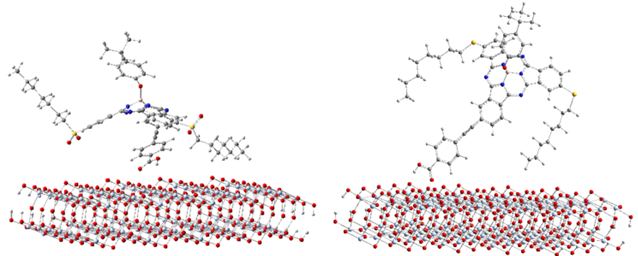
Figure 6. Examples of conformers of SubPc Dyes. Left: SP1-0-1, example of a lying conformer where dye lies horizontally on the TiO2 surface. Right: SP2-0-3, example of a standing conformer with dye perpendicular to TiO2 surface.
The binding sites for the two SubB molecules are similar to those for SubPCs. Because the geometry of SB2 is more complicated than that of the SB1, more possible conformers were found for SB2 with the TiO2 NP. Conformers of SB2 are generally strongly bonded to TiO2 compared to SB1 especially for the neutral molecule (Figure 5) due to the nitrogen atom on the acceptor group of SB2 acting as an extra binding site in addition to the acid group and the methoxy group. The overall binding energies of SubB are close to that of the SubPc, the anion conformers are still strongly preferred. Two main conformers are found for Dy1, a “standing” one (S9: Dy1-0-1) as proposed in the original paper [64], and a “lying” one (S9: Dy1-0-2). Interestingly, the “lying” conformer actually has much higher binding energy than the “standing” one (Figure 5). Same as SB2, Dy1 is also generally strongly bonded to TiO2 compared to other molecules because the nitrogen atom on the cyanide group acts as an extra binding (Table 1). A conformer (Dy2-1-2) without any clear binding site is found for Dy2 and the left side of the molecule with many sulfur, nitrogen, and oxygen atoms is generally closer to the TiO2 surface. The distance between these electron-rich atoms and Ti atoms is further than the binding sites of other conformers and the binding energy of this conformer is also smaller than that of the other anion conformers.
The calculated first excitation (HOMO to LUMO) energy is 2.40 eV (517 nm) for SP1 and 2.34 eV (530 nm) for SP2 in acetonitrile with the M06-2X functional, 2.23 eV (556nm) for SP1 and 2.15 eV (576 nm) for SP2 in acetonitrile with the M06 functional while the experimental values are 2.12 eV (585 nm) and 2.09 eV (594 nm) in tetrahydrofuran (THF), respectively. The absorption spectra of SP1 and SP2 are almost identical according to the experiment with the first absorption peak at 577 nm, but the electrochemical measurement showed different HOMO-LUMO gaps [62]. The calculated and experimental spectra of two SP1 and SP2 are shown in (Figure 7a). The M06-2X calculated spectra are about 0.2 eV (~60nm) blue-shifted compared to the experimental data, this problem has been pointed out to be due to the exact Hartree-Fock (HF) exchange in the long-range corrected functional, which increases the LUMO level of the SubPc molecule [68]. However, the HF exchange is important in describing the valence band (VB) and conduction band (CB) correctly for TiO2. For the TiO2 slab we used in this model, M06-2X gives a band gap of 3.23eV while the band gap from the M06 functional is only 0.99eV. This does not mean that the M06 functional is not good at describing TiO2 since the latitude of the semiconductor particles also has a certain influence on the energy band and it only shows that the M06-2X functional agrees with the experimental value better for the current model. Therefore, the M06-2X method was chosen from balancing the organic part and the semiconductor part equally. Furthermore, even with the relatively large diversity compared to experimental data, the calculated excitation energy still describes the trend between molecules correctly. (Figure 7b) shows the calculated absorption spectra of all conformers for two SubPc molecules on the TiO2 slab. Interaction with TiO2 changes the absorption around 15 nm (about ± 0.06 eV) depending on the conformers. For both SP1 and SP2, the anion spectra are red shifted about 10 nm (about ± 0.04 eV) compared to the spectra of the neutral molecule with the molecules in the presence of TiO2, while spectra of SP1 show slightly more divergence under the influence of semiconductor.
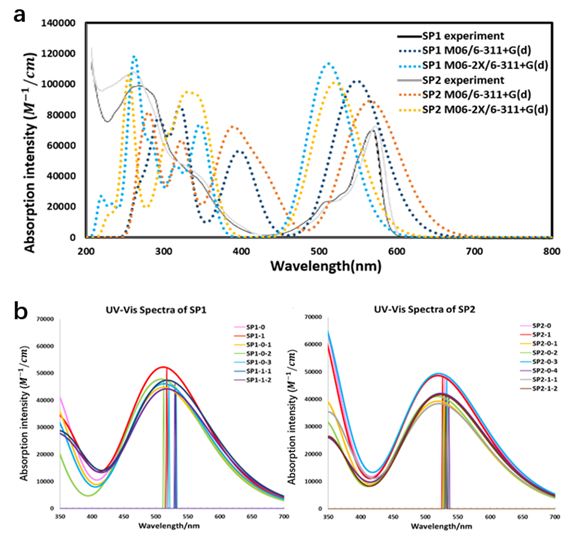
Figure 7. a: The calculated spectra and the experimental data for two SubPc dyes in acetonitrile without TiO2. b: The calculated absorption spectra of SP1 and SP2 in the presence of TiO2 using the M06-2X functional in acetonitrile. The calculated spectra were fitted by Gaussian broadening function with full width at half maximum of 0.3 eV and scale ratio of 28700 for curve based on the calculated first 50 singlet-singlet vertical excitation energies using Multiwfn [67].
(Figure 8) shows the calculated and experimental UV-Vis spectra for the SubB sensitizers. The first absorption peak calculated with the M06-2X functional without the presence of TiO2 for SB1 is located at 443 nm in acetonitrile, 445 nm in dichloromethane (DCM) (experiment value 487 nm in DCM [5] and 505 nm in acetonitrile). For SB2, the calculated first absorption peak is located at 504 nm in methanol (MeOH) (experiment value 535 nm in MeOH [5]) without the presence of TiO2. We still observed the blue shifting of the calculated spectra in comparison with the experimental data, but less than that for SubPc molecules. In contrast, the spectra obtained with the M06 functional are about 40 nm (~0.19eV) red-shifted compared to the results from the M06-2X calculations due to the reduced amount of HF exchange, which leads to a good agreement with the experimental data of SB2 but a red-shifted spectrum of SB1. The calculations from both M06-2X and M06 functional show that SB2 has a much higher absorption intensity than SB1 for the first absorption peak, which is also observed in the experiment [5]. Meanwhile, the absorption spectra of different conformers for SB2 exhibit more changes under the influence of TiO2 (Figure 8b). This can be attributed to the extended acceptor group of SB2 that makes the conjugated system in SB2 longer than the one on SB1, so that SB2 is more flexible and easier to be twisted while interacting with TiO2 and the twist of the conjugated structure leads to the changes in the absorption spectra. The first absorption of SB2 is 26 nm (~0.12 eV) blue shifted compared to SP2 according to the calculation (504 nm and 530 nm) and 37 nm (~0.16 eV) blue shifted according to the experiment (535 nm and 577 nm). Even though the calculated absolute values are slightly different from the experimental results, the calculation describes this changing trend well. The absorption intensity for first peak of SB2 is double that of SP2 (1×10⁵ L/mol/cm and 5×10⁴ L/mol/cm), which is also one of the important factors that leads to the better performance of SubBs compared to SubPcs. Usually, the dyes with more red-shifted absorption spectra would perform better in the DSSCs because they could use the energy of solar radiation more efficiently. However, the radiation intensity of solar spectrum is almost identical between 500 nm and 700 nm. Therefore, the red-shifted spectra of SubPc molecules can hardly make a difference in this absorption range while the absorption intensity plays a more important role in this case.
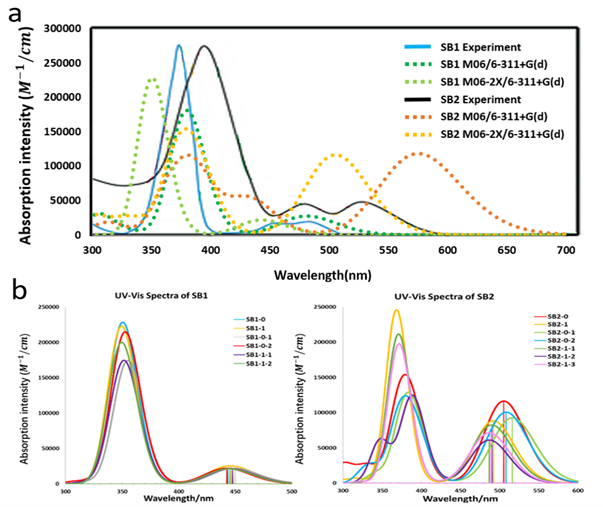
Figure 8. a: The calculated spectra and the experimental data for two SubB molecules with solvent effects without TiO2. b: The calculated absorption spectra of SB1 and SB2 in the presence of TiO2 using the M06-2X functional in acetonitrile. The calculated spectra were fitted by Gaussian broadening function with full width at half maximum of 0.3 eV and scale ratio of 28700 for curve based on the calculated first 50 singlet-singlet vertical excitation energies using Multiwfn [67].
(Figure 9) shows the calculated and experimental UV-Vis absorption spectra of Dy1 and Dy2. The calculated first absorption peak of Dy1 is located at 390 nm in acetonitrile and 393 nm in 1,4-dioxane (experiment 404 nm in 1,4-dioxane), the calculated absorption of Dy2 is located at 450 nm in acetonitrile and 449 nm in dimethyl furan (DMF) (experiment about 525 nm in DMF). The calculated first absorption obtained from the M06-2X calculation only differs by 0.08 eV compared to the experimental value for Dye1. Although the M06 functional provides a good agreement with the experimental value of Dy2 (Figure 9a) by reducing the amount of HF exchange (first absorption 520 nm in acetonitrile with M06 functional), the result from M06-2X functional is still used for the following property calculation in order to keep the method consist for comparison. It is worth noting that Dy2 and SB2, who have the highest DSSC efficiency, also have the highest first peak absorption intensity (80000 to 100000 M-1/cm) among all six molecules in this study. The first excitation energy of Dy1 is located around 400 nm, where the radiation intensity of the solar spectrum is only about half of the high-intensity radiation range (500 nm-700 nm) at sea level. This is one of the main reasons that lead to the poor DSSC efficiency of Dy1 in spite of the strong binding energy with TiO2. The anion form of Dy1 has much higher first absorption energy than the neutral form of it. However, when the anion attaches to TiO2, it behaves more like a neutral molecule (Figure 9b). This phenomenon more or less happens to all the molecules that have been studied here because the negative charge of the anion would transfer into the energy band of semiconductor while connecting to TiO2, and the electronic structure of the anion with the presence of TiO2 will become similar to that of the neutral molecule.
Figure 9. a: The calculated spectra and the experimental data for Dy1 and Dy2 with solvent effects without TiO2. b: The calculated absorption spectra of Dy1 and Dy2 in the presence of TiO2 using the M06-2X functional in acetonitrile. The calculated spectra were fitted by Gaussian broadening function with full width at half maximum of 0.3 eV and scale ratio of 28700 for curve based on the calculated first 50 singlet-singlet vertical excitation energies using Multiwfn [67].
Apart from the absorption spectra, the relative energy levels of the HOMO and LUMO of the dye as well as the CB and VB of TiO2 were obtained by the TD-DFT calculations with the sensitizer and the TiO2 as a complete system (as discussed in the method section “Dye with TiO2 cluster”). Even though the transitions from orbitals of the dye to the CB of the TiO2 have oscillator strengths of zero because this transition is not supposed to occur only from electromagnetic excitation, the energy level map can still be obtained. The relative energy level is important because a higher LUMO-CB will result in larger electron injection driving force from the sensitizer to the TiO2 and makes the electron injection from LUMO to CB more preferred. The stronger driving force is an important factor for a faster electron injection rate besides the coupling of LUMO and CB. In addition, the HOMO of the sensitizer should be higher than the VB of TiO2 so that the electron would not jump back from the TiO2 to the sensitizer when the sensitizer is in its oxidized state. However, the electron injection rate is not just a question of speed. When the electron injection rate is extremely fast, many sensitizers would be left in their positive-charged oxidized state after electron injection. While there are many positive charges composed on the semiconductor electrode surface, kinetic redundancy, which is also known as the interfacial charge recombination losses, can happen [66]. It has been experimentally proven that the best solar cell efficiency can be achieved when the electron injection rate is about 100 times faster than the non-injection decay. (Figure 10) shows the calculated energy level map for all six sensitizers that have been studied.
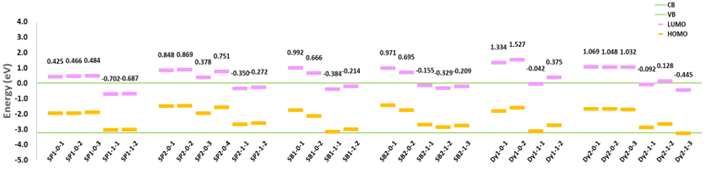
Figure 10. The relative HOMO and LUMO energy levels of different conformers for six sensitizers compared with TiO2 band energies. The conduction band of TiO2 is set to 0 eV.
According to the energy map, SP2 generally has a higher LUMO level relative to CB compared (the LUMO-CB gap) to SP1 even though SP2 has smaller LUMO-HOMO gap (lower first excitation energy), which indicates that SP2 has stronger electron injection driving force. The LUMOs of almost all anion conformers are lower than the CB of TiO2, which indicates the electron injection could not happen in this case due to the lack of electron injection driven force. Comparing the properties of the two SubPc molecules, the fact that the performance of SP2 is better than SP1 in DSSCs can be attributed to larger binding energy, lower first excitation energy and higher LUMO-CB gap which provide stronger driven force for the electron injection of SP2.
The LUMO-CB gaps of neutral SubB conformers (between 0.67eV to 1.0eV) are generally higher than that of the SubPc molecules (between 0.38eV to 0.87eV). The anion conformers of SubB still have the negative LUMO-CB energy gap (between -0.14eV to -0.37eV), but they are less negative than the SubPc molecules (between -0.26eV to -0.70eV). The electron injection may still happen for some SubB anion conformers such as SB2-1-1 since the 0.139eV energy difference between CB and LUMO is possibly beyond the accuracy of our calculations and these two orbitals would be strongly coupled due to the small energy difference. In summary, the solar to electric power conversion efficiency of SB2 is higher than SB1 due to the stronger binding energy, the lower excitation energy, and the higher light absorption intensity. While the SubBs are better than SubPcs due to the higher solar absorption intensity and stronger electron injection driven force.
Different from SubPc and SubB molecules, even the LUMO levels of some anion conformers of Dy1 and Dy2 are higher than the CB level of TiO2. For the same reason that the negative charge of the anion can transfers into the semiconductor during the interaction, the electron from the anion would become a part of the valance band of TiO2 which leads to the energy increase of the VB and CB, while the orbital structure of the anion form dye is similar to the neutral form since it lost the negative charge. The decrease of the LUMO-CB gap is observed and even becomes negative for some anion conformers. A related phenomenon was pointed out for the ruthenium dyes by John B. Asbury and coworkers [67], i.e. that the electron injection rate is decreasing with the increase of pH. Because more dye molecules would dissociate into the anion form with the increase of pH and the electron injection driven force would decrease due to the reduced LUMO-CB gap. One should note that the electronic structures for the anion and neutral forms of the dye also change slightly when connected to TiO2 but this change is different from molecule to molecule, and the energy difference of the HOMOs and LUMOs for different conformers of one molecule is less than 0.003 Hartree/0.081eV (S3) regardless of the anion or neutral forms. The energy increase of VB and CB of TiO2 while connected to the anion is observed for every molecule in this study and the VB level is increased by about 0.04 Hartree/1.08eV for all conformers (S3), which matches the energy of moving one electron from the anion to the TiO2. Therefore, even though the CB level was set to 0eV for all the figures in this work, the small and even negative LUMO-CB gap of the anion conformers is not due to the decrease of the energy of LUMO orbital but because of the increase of the energy of the CB and VB. One thing that needs to be considered is that in reality, the size of the TiO2 is much larger and the shift of the band structure would depend on the amount of anion form dyes that attached to the TiO2.
Dy1 has the highest LUMO-CB gap among all the tested molecules. The “lying” conformer of Dy1 also has a higher LUMO-CB gap, which indicates stronger electron injection driving force as well as stronger coupling between the dye and the TiO2 for the “lying” conformer compared to the “standing” one (This will be discussed in detail later in section “Electronic coupling”). However, The HOMO-1, HOMO and LUMO levels of Dy1 might be too high and the iodide/triiodide electrolyte cannot reduce its oxidation state (Dy1+) to its ground state after the electron injection as efficiently as it does with other molecules (Section “Redox potential of the six sensitizers”), so that a large amount of Dy1 would be left on the semiconductor surface with a positive charge and reduce the DSSC efficiency.
Redox potential of the six sensitizers
The calculated redox potentials of the six molecules are shown in (Table 2). The results are generally in good agreement with the experimental data of SubPc [62] and SubB [5] molecules, while the experimental numbers for Dy1 and Dy2 are not available. The maximum error compared to experiment is 0.31eV, and this is based on the experimental data measured in THF (containing TBAPF6) and CH2Cl2 while the calculation is done in acetonitrile (S5). According to the calculation, Dy1 has the lowest oxidation potential and the highest reduction potential value, which means it is the most difficult for the I3-/I- couple to reduce from the oxide form to the neutral form. We believe this fact also contributed to the poor efficiency of Dy1.
|
Compound |
SP1 |
SP2 |
SB1 |
SB2 |
Dy1 |
Dy2 |
|
Absolute oxidation |
5.63 |
5.31 |
5.38 |
5.42 |
5.11 |
5.22 |
|
Absolute reduction |
3.46 |
3.18 |
2.85 |
3.27 |
2.55 |
2.91 |
|
NHE Oxidation |
1.35 |
1.03 |
1.10 |
1.14 |
0.83 |
0.94 |
|
NHE Reduction |
-0.82 |
-1.10 |
-1.43 |
-1.32 |
-1.73 |
-1.37 |
Electronic coupling
The distance of the chromophore and the TiO2 surface was also calculated. It is observed that the conformer with longer chromophore to TiO2 surface distance always has higher LUMO-CB gap. For example, SP2-0-3 is the only “standing” conformer found for the two SubPc molecules, which is also the one with the lowest LUMO-CB energy gap among all the conformers for SubPcs (Figure 10). This phenomenon raised the question: Is the LUMO-CB gap related to the distance between the sensitizer and the semiconductor surface? To further study this question, two conformers (SB1-0-1 and Dye1-0-2) for SB1 and Dye1 were chosen for a distance test. Dye1 was selected because it was one of the earliest molecules that was proposed as a “donor-π-acceptor/push-pull” system. However, the “lying” conformer is preferred energetically as shown previously in (Table 1). If the molecule is “lying” on the surface, the “push-pull” argument would not likely be valid because the acceptor group is not closer to the semiconductor than the donor group and shifting the electron density to one side of the molecule would not necessarily help with the electron injection. In contrast, the electron injection would be more likely to be an electron hopping process, thus the distance between the chromophore and the surface would become important.
The sensitizer parts of conformer SB1-0-1 and Dy1-0-2 were moved gradually far away from the TiO2 surface, and the energy levels were calculated for each of the distance points using TD-DFT calculations as described before. A clear trend of the LUMO and HOMO decreasing relative to TiO2 band is seen for both conformers (S6). This trend is the same with or without the solvent effect (S7) but the absolute values for the LUMO-CB gaps are lower with the inclusion of solvent effects as the dipole moments of the solvent molecules reduce the HOMO-LUMO gaps of the dye molecules (the calculated absorption spectra is red shifted in the solvent). The two data points of the farthest distance for each conformer were used to represent the situation when the dye is sufficiently far away from the semiconductor that there is no interaction between them.
It is known that two orbitals with the same energy couple when they get close to each other. Since TiO2 is a semiconductor with degenerated bands structure instead of separated orbital, it would always be possible to find an energy level in the conduction band that has the exact same energy as the LUMO orbital from the dye molecule. Therefore, the coupling between LUMO of the dye and the energy level in CB can be seen as symmetric coupling, where the splitting energy is half of the coupling energy. The energy increasing of LUMO orbital compared to non-interaction situation while the distance getting close would be the splitting energy (Figure 11).
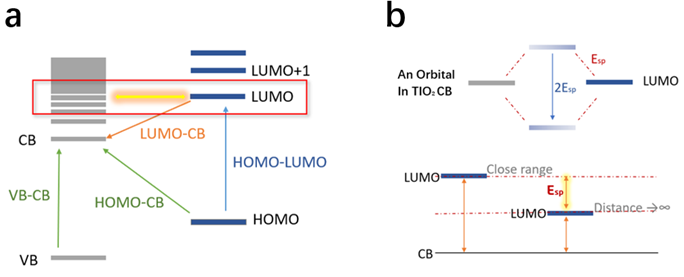
Figure 11. The schematic diagram of coupling between the dye and TiO2.
It is well known that the electronic coupling exponentially increases with the distance decreasing [69-71]. We consider how the LUMO-CB gap is related to the coupling energy of the dye and TiO2 by investigating if the increasing LUMO energies compared to the non-interaction cases (the farthest distance point) could be fitted to exponential functions against the distance for the two chosen conformers both in vacuum and solvent (S7). All four data sets follow the exponential function with the coefficient of determination values (R2) larger than 0.995, which indicated the LUMO-CB gap changing according to distance is related to the electronic coupling (S7). To further formalize this point of view, the coupling energies of the different distance point for SB1 in vacuum are then calculated again using the FCD model. The coupling energies were fitted with an exponential function against the transition length the organic dye and TiO2 as shown in (Figure 12) and the calculated coupling energy is included in S8.
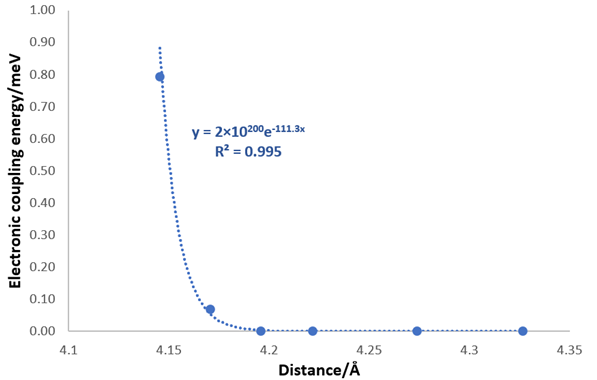
Figure 12. The exponential fitting of the coupling energy calculated by FCD model against the distance between dye and TiO2 for SB1.
Conclusion
In this work, theoretical methods were used to study the interactions between titanium dioxide and different types of sensitizers for DSSCs. The ONIOM model was used for the geometry optimization and binding energy calculation for different conformers of the sensitizer bonded with TiO2. Subsequently, TD-DFT calculations were carried out for each conformer to obtain the spectra and the relative energy level of dye and TiO2. The redox potentials of the sensitizers were also calculated. This is the first time that theoretical computation methods are applied to describe the full working cycle of a DSSCs, which include the molecular excitation, the electron injection and the regeneration of the sensitizers.
The -COOH group was not the only possible binding group, and the large-sized organic sensitizer is more likely to absorb horizontally on the anatase-<101>-surface instead of interacting with the surface perpendicularly. In addition, the deprotonated anion form of the dye is strongly bonded to TiO2 compared to the neutral form. TiO2 was found to have a minor influence on the absorption spectra of the sensitizers, the largest shift of the spectrum with the presence of TiO2 compared to the separated molecule is about 20 nm. The effect of TiO2 on the absorption is larger for soft and big sensitizers due to the interaction with TiO2 twists the conjugated structure of the sensitizers. The deprotonated anion conformers have lower LUMO levels against CB compared to the neutral form, because the negative charge from the anion transfers into the TiO2 and becomes a part of the VB, increasing the band structure of the semiconductor. The conformers with larger LUMO-CB gap would provide stronger electron injection driving force and make the electron injection more energy preferred. The electronic coupling between LUMO of sensitizer and the CB of TiO2 is shown to be exponentially dependent on the distance between sensitizer and TiO2.
Acknowledgment
This work was supported by the Center for Exploitation of Solar Energy, Department of Chemistry, University of Copenhagen, Denmark, and the Danish e-Infrastructure Cooperation. K.V.M. is grateful for financial support from the Danish Council for Independent Research, DFF-0136-00081B.
References
2. Fonrodona M, Soler D, Villar F, Escarré J, Asensi JM, Bertomeu J, et al. Progress in single junction microcrystalline silicon solar cells deposited by Hot-Wire CVD. Thin solid films. 2006 Apr 20;501(1-2):247-51.
3. Eltoukhi M, Fadda AA, Abdel-Latif E, Elmorsy MR. Low cost carbazole-based organic dye bearing the acrylamides and 2-pyridone moieties for efficient dyesensitized solar cells. J Photochem. Photobiol Chem. 2022;426:113760.
4. Ibrayev N, Seliverstova E, Omarova G, Ishchenko A. Sensitization of TiO2 by merocyanine dye in the presence of plasmon nanoparticles. Mater Today Proc. 2020;49(6): 2464-2468.
5. Błaszczyk A. Strategies to improve the performance of metal-free dyesensitized solar cells. Dyes Pigm. 2018;149:707.
6. Backler F, Wilson GJ, Wang F. Rational use of ligand to shift the UV-Vis spectrum of Ru-complex sensitiser dyes for DSSC applications. Radiat Phys Chem. 2019;161:66.
7. da Costa Duarte R, de Oliveira MC, Toldo JM, Gonçalves PFB, Santos MJL, Rodembusch FS. Guest-host interactions in symmetrical carboxy heptamethine cyanine dyes-titanium dioxide systems: synthesis, theoretical calculations, aggregation properties, and application in dye-sensitized solar cells. Int J Photoenergy. 2021;2021:8852979.
8. Mahalingam S, Manap A, Rabeya R, Lau KS, Chia CH, Abdullah H, et al. Electron transport of chemically treated graphene quantum dots-based dye-sensitized solar cells. Electrochim Acta. 2023; 439:141667.
9. Liao C, Wu H, Tang H, Wang L, Cao D. Expanding p-bridge and introducing auxiliary acceptor for realizing panchromatic absorption of the phenothiazine dyes in dye-sensitized solar cells. Sol Energy. 2022; 240:399.
10. Lyu S, Bertrand C, Hamamura T, Ducasse L, Toupance T, Olivier C. Molecular engineering of ruthenium-diacetylide organometallic complexes towards efficient green dye for DSSC. Dyes Pigm. 2018;158:326.
11. Raman R, Natarajan B, Subbiah V, Anandan S, Kamalakannan S, Prakash M. Effect of end groups on fluorene based dyes without carboxyl anchors as efficient co-sensitizer for retarding charge recombination in DSSC applications. Opt Mater. 2022;134:113159.
12. Opoku H, Choy J-Y, Kumar KA, Kim H-S, Shrestha NK, Mane SD, et al. Benzo[1, 2-b: 4, 5-b']dithiophene-based copolymers as panchromatic light sensors in organic photodiodes application. J Mater Res Technol. 2020; 9:15632.
13. Pitigala PKDDP, Henary MM, Perera AGU. Effects of physical orientation of dye molecules and molecular orbitals on performance of solid-state dye sensitized solar cells. Mater Today Proc. 2020; 23:43.
14. Marri AR, Black FA, Mallows J, Gibson EA, Fielden J. Pyridinium p-DSSC dyes: an old acceptor learns new tricks. Dyes Pigm. 2019;165:508.
15. Jacquemin D, Perpete EA, Scuseria GE, Ciofini I, Adamo C. TD-DFT performance for the visible absorption spectra of organic dyes: conventional versus long-range hybrids. Journal of Chemical Theory and Computation. 2008 Jan 8;4(1):123-35.
16. Zakerhamidi M, Ghanadzadeh A, Moghadam M. Solvent Effects on the UV/Visible Absorption Spectra of Some Aminoazobenzene Dyes. Chemical Science Transactions. 2012 May 26;1(1):1-8.
17. Fabian J. TDDFT-calculations of Vis/NIR absorbing compounds. Dyes and Pigments. 2010 Jan 1;84(1):36-53.
18. Qin P, Linder M, Brinck T, Boschloo G, Hagfeldt A, Sun L. High incident photon‐to‐current conversion efficiency of p‐type dye‐sensitized solar cells based on NiO and organic chromophores. Advanced Materials. 2009 Aug 7;21(29):2993-6.
19. Duncan WR, Prezhdo OV. Theoretical studies of photoinduced electron transfer in dye-sensitized TiO2. Annu. Rev. Phys. Chem.. 2007 May 5;58:143-84.
20. Ho J, Coote ML, Cramer CJ, Truhlar DG. Theoretical calculation of reduction potentials. In: Organic Electrochemistry, Fifth Edition: Revised and Expanded. 2015; pp.231-257.
21. De Angelis F, Fantacci S, Selloni A, Grätzel M, Nazeeruddin MK. Influence of the sensitizer adsorption mode on the open-circuit potential of dye-sensitized solar cells. Nano Letters. 2007 Oct 10;7(10):3189-95.
22. Sang-aroon W, Saekow S, Amornkitbamrung V. Density functional theory study on the electronic structure of Monascus dyes as photosensitizer for dye-sensitized solar cells. Journal of Photochemistry and Photobiology A: Chemistry. 2012 May 15;236:35-40.
23. Paramasivam M, Chitumalla RK, Jang J, Youk JH. The impact of heteroatom substitution on cross-conjugation and its effect on the photovoltaic performance of DSSCs–a computational investigation of linear vs. cross-conjugated anchoring units. Physical Chemistry Chemical Physics. 2018;20(35):22660-73.
24. Zhu HC, Zhang J, Wang YL. Adsorption orientation effects of porphyrin dyes on the performance of DSSC: Comparison of benzoic acid and tropolone anchoring groups binding onto the TiO2 anatase (101) surface. Applied Surface Science. 2018 Mar 1;433:1137-47.
25. Mendizabal F, Mera-Adasme R, Xu WH, Sundholm D. Electronic and optical properties of metalloporphyrins of zinc on TiO 2 cluster in dye-sensitized solar-cells (DSSC). A quantum chemistry study. RSC Advances. 2017;7(68):42677-84.
26. De Angelis F, Fantacci S, Selloni A, Nazeeruddin MK, Grätzel M. First-principles modeling of the adsorption geometry and electronic structure of Ru (II) dyes on extended TiO2 substrates for dye-sensitized solar cell applications. The Journal of Physical Chemistry C. 2010 Apr 8;114(13):6054-61.
27. Ernzerhof M, Scuseria GE. Assessment of the Perdew–Burke–Ernzerhof exchange-correlation functional. The Journal of chemical physics. 1999 Mar 15;110(11):5029-36.
28. Vanderbilt D. Soft self-consistent pseudopotentials in a generalized eigenvalue formalism. Physical Review B. 1990 Apr 15;41(11):7892-95.
29. Kresse G, Furthmüller J. Efficient iterative schemes for ab initio total-energy calculations using a plane-wave basis set. Physical Review B. 1996 Oct 15;54(16):11169-86.
30. Regonini D, Bowen CR, Jaroenworaluck A, Stevens R. A review of growth mechanism, structure and crystallinity of anodized TiO2 nanotubes. Materials Science and Engineering: R: Reports. 2013 Dec 1;74(12):377-406.
31. Bandy J, Zhang Q, Cao G. Electrophoretic deposition of titanium oxide nanoparticle films for dye-sensitized solar cell applications. Materials Sciences and Applications. 2011 Oct 18;2(10):1427-31.
32. Lundberg M. Understanding cross-boundary events in ONIOM QM: QM'calculations. Journal of Computational Chemistry. 2012 Feb 5;33(4):406-15.
33. Chung LW, Sameera WM, Ramozzi R, Page AJ, Hatanaka M, Petrova GP, et al. The ONIOM method and its applications. Chemical Reviews. 2015 Jun 24;115(12):5678-796.
34. Maseras F, Morokuma K. IMOMM: A new integrated ab initio+ molecular mechanics geometry optimization scheme of equilibrium structures and transition states. Journal of Computational Chemistry. 1995 Sep;16(9):1170-9.
35. Becke AD. Density-Functional Thermochemistry. III. The Role of Exact Exchange. J. Chem. Phys., 98: 5648-5652.
36. Ditchfield RH, Hehre WJ, Pople JA. Self‐consistent molecular‐orbital methods. IX. An extended Gaussian‐type basis for molecular‐orbital studies of organic molecules. The Journal of Chemical Physics. 1971 Jan 15;54(2):724-8
37. Hehre WJ, Ditchfield R, Pople JA. Self—consistent molecular orbital methods. XII. Further extensions of Gaussian—type basis sets for use in molecular orbital studies of organic molecules. The Journal of Chemical Physics. 1972 Mar 1;56(5):2257-61.
38. Francl MM, Pietro WJ, Hehre WJ, Binkley JS, Gordon MS, DeFrees DJ, et al. Self‐consistent molecular orbital methods. XXIII. A polarization‐type basis set for second‐row elements. The Journal of Chemical Physics. 1982 Oct 1;77(7):3654-65.
39. Stewart JJ. Optimization of parameters for semiempirical methods VI: more modifications to the NDDO approximations and re-optimization of parameters. Journal of Molecular Modeling. 2013 Jan;19:1-32.
40. Praveen PA, Babu RR, Ramamurthi K. Validation of PM6 & PM7 semiempirical methods on polarizability calculations. AIP Conference Proceedings. 2015 Jun 24 (Vol. 1665, No. 1). AIP Publishing.
41. Rappé AK, Casewit CJ, Colwell KS, Goddard III WA, Skiff WM. UFF, a full periodic table force field for molecular mechanics and molecular dynamics simulations. Journal of the American Chemical Society. 1992 Dec;114(25):10024-35.
42. Adamo C, Jacquemin D. The calculations of excited-state properties with Time-Dependent Density Functional Theory. Chemical Society Reviews. 2013;42(3):845-56.
43. Laurent AD, Jacquemin D. TD‐DFT benchmarks: a review. International Journal of Quantum Chemistry. 2013 Sep 5;113(17):2019-39.
44. Jacquemin D, Wathelet V, Perpete EA, Adamo C. Extensive TD-DFT benchmark: singlet-excited states of organic molecules. Journal of Chemical Theory and Computation. 2009 Sep 8;5(9):2420-35.
45. Zhao Y, Truhlar DG. The M06 suite of density functionals for main group thermochemistry, thermochemical kinetics, noncovalent interactions, excited states, and transition elements: two new functionals and systematic testing of four M06-class functionals and 12 other functionals. Theoretical chemistry accounts. 2008 May;120:215-41.
46. McLean AD, Chandler GS. Contracted Gaussian basis sets for molecular calculations. I. Second row atoms, Z= 11–18. The Journal of Chemical Physics. 1980 May 15;72(10):5639-48.
47. Krishnan RB, Binkley JS, Seeger R, Pople JA. Self‐consistent molecular orbital methods. XX. A basis set for correlated wave functions. The Journal of chemical physics. 1980 Jan 1;72(1):650-4.
48. Tomasi J, Mennucci B, Cancès E. The IEF version of the PCM solvation method: an overview of a new method addressed to study molecular solutes at the QM ab initio level. Journal of Molecular Structure: THEOCHEM. 1999 May 18;464(1-3):211-26.
49. Mennucci B. Polarizable continuum model. Wiley Interdisciplinary Reviews: Computational Molecular Science. 2012 May;2(3):386-404.
50. Frisch MJ, Trucks GW, Schlegel HB, Scuseria GE, Robb MA, Cheeseman JR, et al. Gaussian 16 Rev. C. 01, Wallingford, CT. Wallingford, CT. 2016.
51. Dennington R, Keith T, Millam J, GaussView V. Semichem Inc. Shawnee Mission KS, GaussView, Version. 2009;5(8).
52. Gupta V. Tutorial on Using Gaussview and Gaussian 94. Builder. 1994; pp.1-14.
53. Ree N, Andersen CL, Kilde MD, Hammerich O, Nielsen MB, Mikkelsen KV. The quest for determining one-electron redox potentials of azulene-1-carbonitriles by calculation. Physical Chemistry Chemical Physics. 2018;20(11):7438-46.
54. Connelly NG, Geiger WE. Chemical redox agents for organometallic chemistry. Chemical Reviews. 1996 Mar 28;96(2):877-910.
55. Marcus RA. Nobel lecture: Electron transfer reactions in chemistry. Theory and experiment. Reviews of Modern Physics. 1993 Jul;65(3):599-610.
56. Hsu CP. The electronic couplings in electron transfer and excitation energy transfer. Accounts of Chemical Research. 2009 Apr 21;42(4):509-18.
57. Voityuk AA, Rösch N. Fragment charge difference method for estimating donor–acceptor electronic coupling: Application to DNA π-stacks. The Journal of Chemical Physics. 2002 Sep 22;117(12):5607-16.
58. Mulliken RS. Electronic population analysis on LCAO–MO molecular wave functions. I. The Journal of chemical physics. 1955 Oct 1;23(10):1833-40.
59. Manzhos S, Giorgi G, Yamashita K. A density functional tight binding study of acetic acid adsorption on crystalline and amorphous surfaces of titania. Molecules. 2015 Feb 17;20(2):3371-88.
60. Spreafico C, Schiffmann F, VandeVondele J. Structure and mobility of acetic acid at the anatase (101)/acetonitrile interface. The Journal of Physical Chemistry C. 2014 Mar 27;118(12):6251-60.
61. Claessens CG, Gonzalez-Rodriguez D, Rodriguez-Morgade MS, Medina A, Torres T. Subphthalocyanines, subporphyrazines, and subporphyrins: Singular nonplanar aromatic systems. Chemical reviews. 2014 Feb 26;114(4):2192-277.
62. Urbani M, Sarı FA, Grätzel M, Nazeeruddin MK, Torres T, Ince M. Effect of peripheral substitution on the performance of subphthalocyanines in DSSCs. Chemistry–An Asian Journal. 2016 Apr 20;11(8):1223-31.
63. Gotfredsen H, Neumann T, Storm FE, Munoz AV, Jevric M, Hammerich O, et al. Donor− acceptor‐functionalized subphthalocyanines for dye‐sensitized solar cells. ChemPhotoChem. 2018 Nov;2(11):976-85.
64. Ooyama Y, Shimada Y, Kagawa Y, Imae I, Harima Y. Photovoltaic performance of dye-sensitized solar cells based on donor–acceptor π-conjugated benzofuro [2, 3-c] oxazolo [4, 5-a] carbazole-type fluorescent dyes with a carboxyl group at different positions of the chromophore skeleton. Organic & Biomolecular Chemistry. 2007;5(13):2046-54.
65. Mishra A, Fischer MK, Bäuerle P. Metal‐free organic dyes for dye‐sensitized solar cells: From structure: Property relationships to design rules. Angewandte Chemie International Edition. 2009 Mar 23;48(14):2474-99.
66. Zhang L, Cole JM. Anchoring groups for dye-sensitized solar cells. ACS applied materials & interfaces. 2015 Feb 18;7(6):3427-55.
67. Lu T, Chen F. Multiwfn: A multifunctional wavefunction analyzer. Journal of computational chemistry. 2012 Feb 15;33(5):580-92.
68. Rasmussen MH, Vishart AL, Storm FE, Mikkelsen KV. Density Functional Theory Investigation on Boron Subphthalocyanine–Ferrocene Dyads. The Journal of Physical Chemistry A. 2018 Aug 29;122(38):7620-7.
69. Hsu CP. Application of the sequential formula: the electronic coupling and the distance dependence in the electron transfer of ferrocene-terminated alkanethiol monolayers. Journal of Electroanalytical Chemistry. 1997 Nov 25;438(1-2):27-35.
70. Dutton G, Zhu XY. Distance-Dependent Electronic Coupling at Molecule− Metal Interfaces: C60/Cu (111). The Journal of Physical Chemistry B. 2004 Jun 10;108(23):7788-93.
71. Hush NS. Distance dependence of electron transfer rates. Coordination Chemistry Reviews. 1985 May 1;64:135-57.