Abstract
Background: The prevalence of obesity is high in individuals with spinal cord injury (SCI) due to the alterations in body composition that occur as a direct result of injury. Body mass index (BMI) is used to classify body habitus. In 2009, an adjusted BMI classification, with lower thresholds for obesity, was recommended for individuals with SCI. Objective: Determine obesity prevalence before and after SCI to examine the trajectory of obesity development. Furthermore, we discuss the challenges of applying a modified BMI classification system in this population. Methods: We conducted a retrospective medical record review. Adults with traumatic SCI were selected. Height and body weight measurements were used to calculate BMI two years before injury through two years after injury. Results: Obesity prevalence is high in SCI participants. However, we report no significant difference in BMI between motor complete and incomplete injuries, or between tetraplegic or paraplegic injuries. We report a decrease in BMI from one year before injury to one- and two-years after injury for all groups. With moderate obesity before injury, the transition to a new BMI classification system creates a challenge in reducing obesity prevalence. Conclusion: Obesity prevalence encompassed nearly all participants by the second year following SCI. The adjusted BMI classification system dictates the high obesity prevalence in this population and is best used as a screening tool to track the risk of developing obesity. Exceptions should be considered when using the SCI-adjusted BMI classification system, and tissue composition analysis is preferred.
Keywords
Spinal cord injury, Obesity, Body mass index
Introduction
The accumulation of excess body fat, otherwise known as obesity, is highly prevalent among individuals with spinal cord injury (SCI). This condition continues to reach epidemic proportions, and the pathogenesis and prevalence rates have been thoroughly described in recent reports [1-7]. Obesity is considered a cardiometabolic risk factor, and its high prevalence in the chronic SCI population has led to cardiovascular disease as a leading cause of morbidity and mortality [8-10]. Commonly used tools to measure body composition include hands-on assessments, compartmental imaging, volume displacement, bioelectrical impedance, and estimation equations [11]. However, the method of classifying obesity status in persons with SCI has changed in recent years due to recognition of alterations in body compositional profiles that occur as a result of their injury [10,12,13]. In general, recommended thresholds for classifying obesity are reduced in the SCI population compared to the nondisabled population. Throughout the initial year following a SCI an individual will experience significant skeletal muscle atrophy to areas below the level of injury, an accumulation of fat mass in the atrophied areas, a reduction of basal metabolic rate and resting energy expenditure, and a loss of bone mineral density and total body water [2,8,14-16]. After this compositional shift, overnutrition largely contributes to sustained obesity as a person transitions to a chronic SCI state [16,17]. A sedentary lifestyle and low levels of physical activity may further exacerbate obesity status in this population [14,18,19].
The current metric used to screen those at risk of developing obesity, or to appropriately identify obese individuals, is body mass index (BMI). BMI is a calculation of a person’s weight in relation to their height to estimate body fat in both males and females of any age. However, this metric has shifted away from the traditional classification system to identify obesity in individuals with SCI. For instance, the World Health Organization and National Institutes of Health use BMI to classify a person’s body habitus as underweight (<18.5 kg/m2), normal weight (18.5 – 24.9 kg/m2), overweight (25.0 – 29.9 kg/m2) or obese (>30.0 kg/m2) [20]. Due to the aforementioned compositional changes that occur following SCI, BMI has been found to underestimate obesity in this clinical population. For this reason, there is substantial support for the use of an adjusted BMI classification system for those with SCI. In order to better capture obesity prevalence in SCI, Laughton et al. had originally suggested lowering the obesity cutoff to a BMI >22 kg/m2, and others suggested 23 kg/m² or 25 kg/m² as the appropriate criteria for being “overweight or obese” [1,10-13]. The Clinical Practice Guideline for Health Care Providers has adopted a SCI-adjusted BMI classification system establishing that a BMI>22 kg/m2 represents an obese body habitus where the classification of a normal BMI would be under this value [10]. Depending on body habitus prior to SCI onset, this goal may be impractical for individuals who have a substantially higher BMI preceding their injury. The differences in traditional and SCI specific BMI classification systems are presented in Table 1.
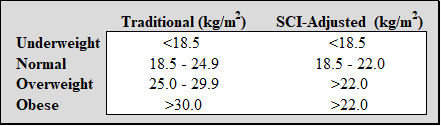
Table 1. Differences in body habitus categories per BMI classification system.
The goal of this study was to observe BMI changes in a population of individuals with SCI pre- and post-injury from our clinical database. We began by examining obesity trajectories two years pre-SCI through the initial two years post-SCI using BMI measurements collected through inpatient and outpatient clinic visits. Due to the differences in SCI severity, and the respective greater losses of lean tissue mass noted in motor complete injuries, we examined differences in obesity prevalence, and obesity trajectories, between American Spinal Injury Association Impairment Scale (AIS) grades before and after injury. We also examined differences in obesity prevalence, and obesity trajectories, by level of injury between persons with tetraplegia or paraplegia injuries. Finally, we examined pre-SCI obesity status and injury severity or level of injury to determine if there is a coupled effect.
This four-year timeline provides a novel analysis of BMI status pre- and post-SCI that could facilitate discussions on appropriate weight management interventions in acute SCI care planning. Applicable to weight management interventions for lifelong wellness, we will discuss the challenges of using the SCI-adjusted BMI classification system with this population, and the undertaking placed on these patients to meet their adjusted BMI goal.
Materials and Methods
Our institutional review board approved this retrospective review using electronic medical record databases to identify persons with traumatic SCI who received care at any of our institution’s facilities from January 1, 1996, to April 27, 2020. Participants were excluded if they had documented refusal of medical record data to be used for research purposes.
In total, 2,668 participants were identified using an advanced proprietary analytic search tool (i.e., Advanced Text Explorer) developed at the authors’ institution. This tool identifies specific language or text syntax used within electronic medical records. All record types (e.g., progress notes, procedures, visit summary, etc.) were available to search. The required search text syntax was comprised of “spinal cord injury” and “traumatic” but was not to include “non-traumatic” or “atraumatic.” Data from atraumatic injuries, and other participants without SCI, were identified and removed (n=1,100), as well as data from participants who died within a year of injury (n=46). The final dataset included 1,522 participants with traumatic SCI. A summary of our process to identify participants can be found in Figure 1.
All height and weight measurements were extracted to calculate BMI pre- and post-SCI. These data were further reduced and restructured due to the amount of information provided by the electronic medical record. To simplify the dataset, we only included participants with two full years of BMI records before injury and two full years after injury. The dataset was then stratified by level of injury and AIS classification; both were described in the medical record. Due to inconsistencies found within certain patients regarding body weight values, such as suspected data entry errors or measurement errors, an upper and lower limit threshold of ± 30% of the median body weight was used for every individual at each time point. A limit threshold was chosen because a change in body weight of ± 30% is unlikely to occur within a year of successive body weight or height measurements. This threshold removed outliers that would over or underestimate the BMI calculation. A total of 62 participants met inclusion criteria, and a summary of injury characteristics can be found in Figure 1. The median BMI for each year was used for the analysis. All BMI values, collected prior to injury were compared using the standard BMI classification system, and the SCI-adjusted BMI classification system was used after injury.
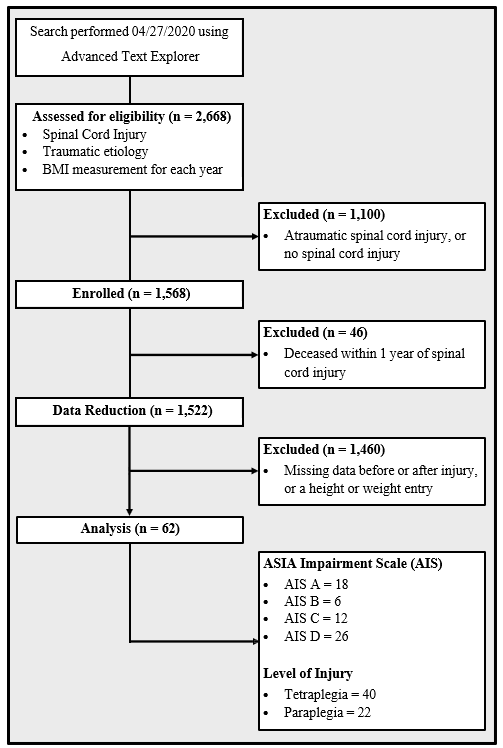
Figure 1. Flow chart for participant identification, and injury characteristics.
Statistical analysis
A quantitative comparison was performed to determine the percentage of patients considered obese at different time points, pre- and post-SCI, using the appropriate BMI classification system. After determining BMI per year, all time points were combined to visualize obesity changes for all participants using both the traditional and SCI-adjusted BMI classification systems (Figure 2). A Wilcoxon Rank Sum test was performed to compare the change in BMI pre- and post-injury between the motor complete and motor incomplete groups. Regarding injury severity, participants with motor complete injuries (AIS A or B) were grouped together, as were participants with motor incomplete injuries (AIS C or D), for comparison. The same analysis was applied to compare the change in BMI pre- and post-injury between groups with tetraplegia and paraplegia. Wilcoxon Signed Rank analyses were performed on the groups categorized as motor complete, motor incomplete, tetraplegic, and paraplegic to identify statistically significant changes in BMI between one year and two years post-SCI. Finally, a two-way ANOVA was performed to determine if post-SCI BMI, both one year and two years post-SCI, is impacted by pre-SCI obesity status and/or injury severity, or if an interaction between these factors was present. The same analysis was performed with factors of pre-SCI obesity status and level of injury (tetraplegia or paraplegia), again for one year and two years post-SCI. Data used for parametric analyses were tested for normality using the Anderson-Darling test. The level of significance for statistical analyses was p <0.05.
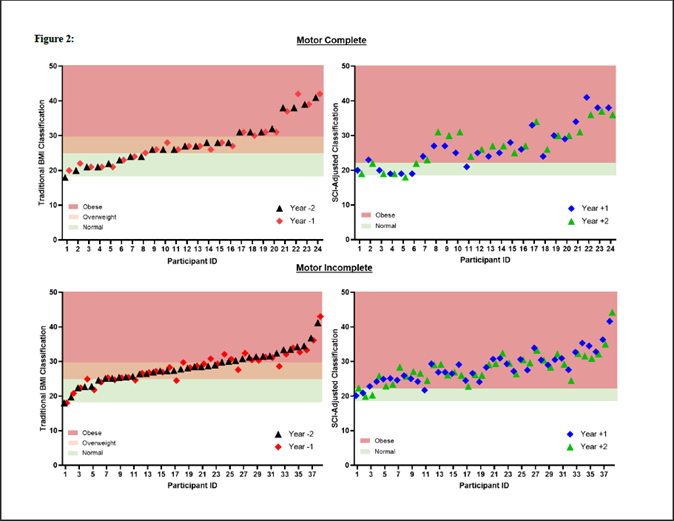
Figure 2. Scatter plot map comparison of obesity prevalence in motor complete injuries using two classification systems.
Results
BMI before and after SCI
Twenty (83%) participants with motor complete injuries demonstrated a decrease in BMI from one year before to one year after injury, and 18 (75%) experienced a decrease in BMI from one year before to two years after injury. Nineteen (50%) participants with motor incomplete injuries demonstrated a decrease in BMI from one year before injury to one year after injury, and 18 (47%) of these participants experienced a decrease in BMI from one year before to two years after injury. When examining BMI changes by level of injury, 24 (60%) participants with tetraplegia demonstrated a decrease in BMI from one year before to one year after injury, and 21 (53%) experienced a decrease in BMI from one year before to two years after injury. Finally, 15 (68%) participants with paraplegia experienced a decrease in BMI from one year before to one year after injury, as well as one year before to two years after injury.
Mean and median BMI values per year, and 95% confidence intervals estimates, are provided in Table 2. A Wilcoxon Rank Sum test demonstrated that between one year before injury to one year after injury a decrease in mean BMI was significantly greater (p=0.002) for motor complete injuries (mean -1.50; 95% CI = [-2.26, -0.73].) compared to motor incomplete injuries (mean -0.14; 95% CI = [-0.67, 0.39].). No other significant BMI differences were found between motor complete and motor incomplete injuries. Similarly, no significant differences in BMI were observed between persons with tetraplegia and those with paraplegia. Two-way ANOVA analyses demonstrated no significant interaction effect between obesity status before injury and injury severity classification when examining BMI at either one year or two years after injury. There were also no interaction effects between obesity status before injury and level of injury when examining BMI at one year or two years after injury.
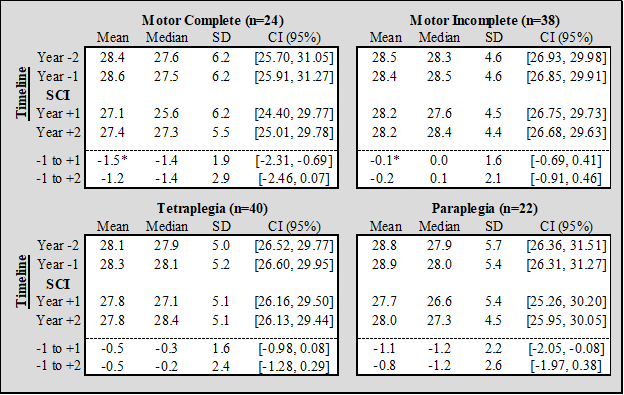
Table 2. Summary of statistical analyses for changes in BMI before and after SCI. CI: Confidence Intervals; SD: Standard Deviation; * the comparison of change in BMI from -1 year to +1 year between motor complete and motor incomplete was significant (p=0.002).
Obesity prevalence
In Figure 1, the most common injury characteristics were motor incomplete injuries (n=38), and persons with tetraplegia (n=40). Differences in obesity prevalence between BMI classification systems are presented in Table 3. Scatter plots that are scaled to BMI thresholds for each classification system show changes in obesity prevalence over all four years included in the analysis (Figure 2).
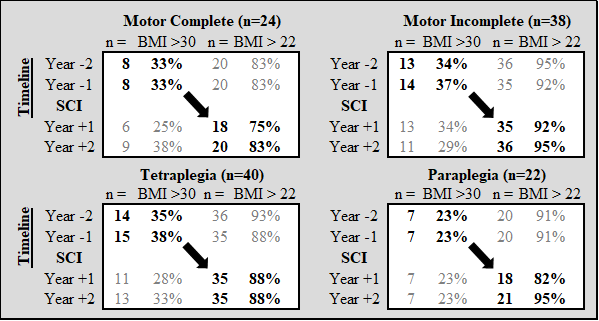
Table 3. Bolded values highlight the changes in obesity prevalence determined by the traditional BMI classification system (Year -2, Year -1) before SCI, and the SCI-adjusted BMI classification system (Year +1, Year +2) following SCI.
Discussion
Using a SCI-specific BMI classification system, the results of this study demonstrate a high prevalence of obesity after injury, regardless of injury severity or level of injury. These findings are consistent with other reports in the literature [3-5,11,17,21-25]. Using the standard BMI classification system, approximately one third of all participants were considered obese pre-SCI. Using the SCI-adjusted BMI classification, following SCI obesity prevalence increased to encompass nearly all participants just two years after injury. It is important to note the numerical shift by the SCI-adjusted BMI classification system to 22 kg/m2 dictates the high obesity prevalence in this population.
Specific to the groups shown herein, we determined the increase in obesity prevalence was not driven by an increase in BMI. Most participants with motor complete injuries experienced a decrease in BMI, however, the primary reason for the increased obesity prevalence was due to the change in classification system. When utilizing the recommended SCI-adjusted BMI classification system, it is important to recognize that a large percentage of individuals who are obese after injury would also have been considered obese prior to injury, had the same thresholds been applied. It appears that BMI is best used as a screening tool, and a more complex method of measuring body composition should be used if there is a need for certainty when establishing obesity status in a patient. Without tissue composition records a person may be misclassified as obese, such as those with incomplete injuries and preserved lean tissue mass below the level of injury [10]. The decreases in lean tissue mass mostly occur in the first few months following injury, but can continue for several years after injury, and is more pronounced in individuals with flaccid paralysis [26-28]. As such, there are reported body compositional differences between injuries resulting in tetraplegia and paraplegia, and to a certain degree differences between injury severities [26,29-31]. These reports suggest higher body fat mass and body fat percentages can be found in motor complete injuries, as well as injuries resulting in tetraplegia. For our study, we report no significant difference in BMI between motor complete and incomplete injuries, or between injuries resulting in tetraplegia and paraplegia, at one year and two years post-SCI.
Changes to BMI in acute SCI
We noted that 63% of all participants showed a decrease in BMI value from one year pre-SCI to one- and two-years post-SCI regardless of injury severity or location. Grouping the participants by AIS or level of injury, we determined a slight decrease in BMI values for all groups. However, this decrease in BMI from one year before to one year after injury was determined to be significantly different for motor complete injuries compared to motor incomplete injuries. When stratified by level of injury, no significant differences in BMI were found from one year before injury to one and two years after injury.
The BMI trajectories for our participants appear to be stable as BMI values remained near or slightly below pre-injury values. Our analysis revealed there is not a significant difference in BMI values between one year and two years after injury for motor complete or motor incomplete injuries; these findings were consistent when stratified by level of injury. Our results are similar to a recently published BMI trajectory analysis, with the exception that our study is the first to incorporate BMI values prior to SCI onset [32]. Perhaps this trajectory analysis could be applied throughout the first year following SCI onset to predict patients who are at higher risk of developing obesity or determine worsening BMI for those already classified as obese. Therefore, the aforementioned study could be enhanced with a pre-injury reference point as this value would provide insight to how the individual’s BMI is affected following SCI onset. BMI measurements may be best used to monitor BMI trajectories to then initiate obesity mitigation efforts if the trajectory is worsening, and monitoring trajectories would be enhanced with a pre-injury BMI reference value.
Feasibility in reaching a normal BMI
Using the recommended SCI-adjusted BMI classification system, which better captures obesity prevalence in this population, newly injured patients will have a goal BMI under 22 kg/m2. This goal BMI may be impractical for individuals who have a substantially higher BMI preceding their injury. If available, it may be beneficial for a primary care provider to examine BMI trajectories using data points that were recorded prior to injury to better understand the patient’s obesity risk trajectory, and to establish appropriate expectations for future weight management care.
When considering the high prevalence of obesity in the SCI population, and the shift from the traditional BMI classification system to the SCI-adjusted BMI classification system, a patient may be tasked with a difficult goal of reducing his or her BMI to a value that correlates to a healthy body habitus. For participants in our study who were obese before their injury (i.e., BMI >30.0 kg/m2), the average value above the BMI goal of 22 kg/m2 was greater than 10 kg/m2 following SCI. As an example, if an individual with a height of 183 cm and weight of 107 kg (32.0 BMI) experienced a traumatic SCI, he or she would be tasked with reducing their body weight by 30% to a goal weight of 74 kg to avoid an obesity diagnosis. To succeed in reducing body weight by 33 kg, their weight loss will be comprised of the typical SCI-related muscle atrophy, as well as additional intervention(s) to target excess adiposity. A recent systematic review of weight loss interventions in SCI populations found minimal changes to BMI following exercise programs, including those that incorporated neuromuscular electrical stimulation for greater muscle activation [33]. Therefore, exercise should be complementary to other weight loss interventions to reduce BMI values [19,34-38].
Study limitations
The final sample size represents 4% of all participants with traumatic SCI. While seemingly small for the analyses presented herein, we believe the sample size is sufficient considering the inclusion criteria of having a BMI on record two years before injury through two years after injury. Our sample distribution favors more injuries resulting in tetraplegia than paraplegia, as well as more motor incomplete than motor complete injuries, but this does align with national data [39]. Our analysis did not account for age or sex, which could be factors in sustained obesity post-SCI.
Conclusions
It is important to monitor obesity prevalence following SCI due to clustering with other cardiometabolic disease risk factors that are equally prevalent in the SCI population [40]. BMI does not differentiate tissue composition, and it is possible that a proportion of our participants had either above or below average fat mass which would misclassify obesity in these participants. For motor complete and incomplete injuries, as well as injuries resulting in tetraplegia and paraplegia, BMI decreased from one year pre-SCI to two years post-SCI. This decrease in BMI noted from pre- and post-SCI was significant for those with motor complete injuries. Overall, a further decrease in BMI across all groups is needed to be classified as normal according to the SCI-adjusted BMI classification system. The SCI-adjusted BMI classification system is likely not a sufficient tool to track obesity in individuals with SCI due to the differences found between level of injury and severity of injury described in previous reports [26, 29-31]. Based on these reports, the SCI-adjusted BMI classification could be improved by using a tiered system of obesity thresholds that align with noted differences in body fat mass and body fat percentage for specific injury characteristics. Therefore, some exceptions may be applicable in certain situations when considering injury profiles. When feasible, a more accurate form of measurement that differentiates tissue composition should be used to determine obesity status.
Conflicts of Interest
None for any author.
Funding
A funding mechanism was not used for this project.
Author Contributions
D.D.V, C.L., M.B.L., A.R.T., and R.J.L. conceived and designed the research protocol; C.L., A.R.T., and R.J.L. analyzed data; D.D.V., C.L., M.B.L., A.R.T., R.J.L, B.A.S., M.L.G., L.A.B., and K.L.G. interpreted results of experiments; D.D.V. and C.L. prepared figures; D.D.V. and C.L. drafted the manuscript. All authors edited and revised the manuscript and approved final version of manuscript. All authors have read and agreed to the published version of the manuscript.
Institutional Review Board Statement
This study was reviewed and approved as IRB-exempt.
Informed Consent Statement
Not applicable.
Data Availability Statement
Data and related analyses are available upon request to the first author.
References
2. Gater Jr DR, Farkas GJ, Tiozzo E. Pathophysiology of neurogenic obesity after spinal cord injury. Topics in Spinal Cord Injury Rehabilitation. 2021 Jan 1;27(1):1-10.
3. Hatchett PE, Mulroy SJ, Eberly VJ, Haubert LL, Requejo PS. Body mass index changes over 3 years and effect of obesity on community mobility for persons with chronic spinal cord injury. The Journal of Spinal Cord Medicine. 2016 Jul 3;39(4):421-32.
4. Powell D, Affuso O, Chen Y. Weight change after spinal cord injury. The Journal of Spinal Cord Medicine. 2017 Mar 4;40(2):130-7.
5. Wen H, Chen Y, He Y, Bickel CS, Robinson-Whelen S, Heinemann AW. Racial differences in weight gain: a 5-year longitudinal study of persons with spinal cord injury. Archives of Physical Medicine and Rehabilitation. 2018 Oct 1;99(10):1957-64.
6. Wen H, DeVivo MJ, Mehta T, Kaur Baidwan N, Chen Y. The impact of body mass index on one-year mortality after spinal cord injury. The Journal of Spinal Cord Medicine. 2021 Jul 4;44(4):563-71.
7. De Groot S, Post MW, Sluis TA, van der Woude LH, Postma K. Prospective analysis of body mass index during and up to 5 years after discharge from inpatient spinal cord injury rehabilitation. Journal of Rehabilitation Medicine. 2010 Nov;42(10):922-8.
8. Gorgey AS, Dolbow DR, Dolbow JD, Khalil RK, Castillo C, Gater DR. Effects of spinal cord injury on body composition and metabolic profile–Part I. The Journal of Spinal Cord Medicine. 2014 Nov 1;37(6):693-702.
9. Groah SL, Nash MS, Ward EA, Libin A, Mendez AJ, Burns P, et al. Cardiometabolic risk in community-dwelling persons with chronic spinal cord injury. Journal of Cardiopulmonary Rehabilitation and Prevention. 2011 Mar 1;31(2):73-80.
10. Nash MS, Groah SL, Gater Jr DR, Dyson-Hudson TA, Lieberman JA, Myers J, et al. Identification and management of cardiometabolic risk after spinal cord injury: clinical practice guideline for health care providers. Topics in Spinal Cord Injury Rehabilitation. 2018;24(4):379-423.
11. Yahiro AM, Wingo BC, Kunwor S, Parton J, Ellis AC. Classification of obesity, cardiometabolic risk, and metabolic syndrome in adults with spinal cord injury. The Journal of Spinal Cord Medicine. 2020 Jul 3;43(4):485-96.
12. Laughton GE, Buchholz AC, Martin Ginis KA, Goy RE. Lowering body mass index cutoffs better identifies obese persons with spinal cord injury. Spinal Cord. 2009 Oct;47(10):757-62.
13. Silveira SL, Ledoux TA, Robinson-Whelen S, Stough R, Nosek MA. Methods for classifying obesity in spinal cord injury: a review. Spinal Cord. 2017 Sep;55(9):812-7.
14. Farkas GJ, Gater DR. Energy expenditure and nutrition in neurogenic obesity following spinal cord injury. Journal of Physical Medicine and Rehabilitation (Wilmington, Del.). 2020;2(1):11-13.
15. Gater Jr DR. Obesity after spinal cord injury. Physical Medicine and Rehabilitation Clinics of North America. 2007 May 1;18(2):333-51.
16. Buchholz AC, Pencharz PB. Energy expenditure in chronic spinal cord injury. Current Opinion in Clinical Nutrition & Metabolic Care. 2004 Nov 1;7(6):635-9.
17. Groah SL, Nash MS, Ljungberg IH, Libin A, Hamm LF, Ward E, et al. Nutrient intake and body habitus after spinal cord injury: an analysis by sex and level of injury. The Journal of Spinal Cord Medicine. 2009 Jan 1;32(1):25-33.
18. Buchholz AC, McGillivray CF, Pencharz PB. Physical activity levels are low in free-living adults with chronic paraplegia. Obesity Research. 2003 Apr;11(4):563-70.
19. McMillan DW, Maher JL, Jacobs KA, Nash MS, Gater Jr DR. Exercise interventions targeting obesity in persons with spinal cord injury. Topics in Spinal Cord Injury Rehabilitation. 2021 Jan 1;27(1):109-20.
20. Jan A, Weir CB. BMI classification percentile and cut off points. Treasure Island (FL): StatPearls. 2021.
21. Beck LA, Lamb JL, Atkinson EJ, Wuermser LA, Amin S. Body composition of women and men with complete motor paraplegia. The Journal of Spinal Cord Medicine. 2014 Jul 1;37(4):359-65.
22. Crane DA, Little JW, Burns SP. Weight gain following spinal cord injury: a pilot study. The Journal of Spinal Cord Medicine. 2011 Mar 1;34(2):227-32.
23. Gorgey A, Gater D. Prevalence of obesity after spinal cord injury. Topics in Spinal Cord Injury Rehabilitation. 2007 Apr 1;12(4):1-7.
24. Gupta N, White KT, Sandford PR. Body mass index in spinal cord injury–a retrospective study. Spinal Cord. 2006 Feb;44(2):92-4.
25. Weaver FM, Collins EG, Kurichi J, Miskevics S, Smith B, Rajan S, et al. Prevalence of obesity and high blood pressure in veterans with spinal cord injuries and disorders: a retrospective review. American Journal of Physical Medicine & Rehabilitation. 2007 Jan 1;86(1):22-9.
26. Spungen AM, Adkins RH, Stewart CA, Wang J, Pierson Jr RN, Waters RL, et al. Factors influencing body composition in persons with spinal cord injury: a cross-sectional study. Journal of Applied Physiology. 2003 Dec;95(6):2398-407.
27. Spungen AM, Wang J, Pierson Jr RN, Bauman WA. Soft tissue body composition differences in monozygotic twins discordant for spinal cord injury. Journal of Applied Physiology. 2000 Apr 1;88(4):1310-5.
28. Wilmet E, Ismail AA, Heilporn A, Welraeds D, Bergmann P. Longitudinal study of the bone mineral content and of soft tissue composition after spinal cord section. Spinal Cord. 1995 Nov;33(11):674-7.
29. Han SH, Lee BS, Choi HS, Kang MS, Kim BR, Han ZA, et al. Comparison of fat mass percentage and body mass index in Koreans with spinal cord injury according to the severity and duration of motor paralysis. Annals of Rehabilitation Medicine. 2015 Jun;39(3):384-92.
30. Azevedo ER, Alonso KC, Cliquet A. Body composition assessment by bioelectrical impedance analysis and body mass index in individuals with chronic spinal cord injury. Journal of Electrical Bioimpedance. 2016 Jan 1;7(1):2-5.
31. Raguindin PF, Bertolo A, Zeh RM, Fränkl G, Itodo OA, Capossela S, et al. Body composition according to spinal cord injury level: a systematic review and meta-analysis. Journal of Clinical Medicine. 2021 Aug 30;10(17):3911.
32. de Groot S, Post MW, Hoekstra T, Valent LJ, Faber WX, van der Woude LH. Trajectories in the course of body mass index after spinal cord injury. Archives of Physical Medicine and Rehabilitation. 2014 Jun 1;95(6):1083-92.
33. Shojaei MH, Alavinia SM, Craven BC. Management of obesity after spinal cord injury: a systematic review. The Journal of Spinal Cord Medicine. 2017 Nov 2;40(6):783-94.
34. Astorino TA. Hemodynamic and cardiorespiratory responses to various arm cycling regimens in men with spinal cord injury. Spinal Cord Series and Cases. 2019 Jan 15;5(1):2.
35. Astorino TA, Thum JS. Within-session responses to high-intensity interval training in spinal cord injury. Disability and Rehabilitation. 2018 Feb 13;40(4):444-9.
36. Jacobs PL, Mahoney ET, Nash MS, Green BA. Circuit resistance training in persons with complete paraplegia. Journal of Rehabilitation Research & Development. 2002 Jan 1;39(1):21-8.
37. McMillan DW, Maher JL, Jacobs KA, Nash MS, Bilzon JL. Physiological responses to moderate intensity continuous and high-intensity interval exercise in persons with paraplegia. Spinal Cord. 2021 Jan;59(1):26-33.
38. Nash MS, Jacobs PL, Woods JM, Clark JE, Pray TA, Pumarejo AE. A comparison of 2 circuit exercise training techniques for eliciting matched metabolic responses in persons with paraplegia. Archives of Physical Medicine and Rehabilitation. 2002 Feb 1;83(2):201-9.
39. National Spinal Cord Injury Statistical Center. Spinal cord injury facts and figures at a glance. The Journal of Spinal Cord Medicine. 2013;36(1):1-2.
40. Libin A, Tinsley E, Nash M, Mendez A, Burns P, Elrod M, et al. Cardiometabolic risk clustering in spinal cord injury: results of exploratory factor analysis. Topics in Spinal Cord Injury Rehabilitation. 2013 Jul 1;19(3):183-94.