Abstract
This paper develops an empirically validated conceptual framework, which redefines construction inspection technology selection as a context-specific optimization problem. The framework models inspection performance as the generation of interactions between technological capabilities and environmental constraints, rather than universal technical superiority. An experiment was conducted in a mixed-factorial design with 72 observations at different levels of ecological fidelity. The data were analyzed using GLMMs with a negative binomial distribution with appropriate error counts. The findings indicate a significant main effect of technological medium (χ² (4) = 85.23, p < 0.001) and Interactions between medium and experiment Type (χ² (2) = 11.47, p = 0.003). Mixed reality (HoloLens) was much more effective than paper-based methods in laboratory (IRR = 0.28, p < 0.001) and realistic site (IRR = 0.36, p = 0.005) conditions, but remained superior to tablet-derived methods in all settings (Laboratory: IRR = 0.54, p < 0.001; Realistic site: IRR = 0.54, p =0.005). Digital inspection methods reduced inspection times by 60–78%. The research provided a tested, computationally based approach to aligning inspection technology in operational settings. Results revealed that strategic alignment between technology and the situation is the most effective way to achieve optimal performance. This provides construction managers with evidence-based decision support for quality control investment and implementation.
Keywords
Mixed reality, Computational framework, Rebar inspection, Digital construction, GLMM, Context-aware systems, BIM
Introduction
The strength of reinforced concrete buildings is maintained by the proper placement of the reinforcing steel (rebar) [1]. A significant bottleneck in construction processes is the manual inspection of rebars, the reliance on 2D drawings, and the creation of paper checklists to verify rebars [2]. It is very difficult to select and apply these methods, and the risk of errors is high, which may lead to structural issues, rework, and even safety risks during work [3].
Building information modeling (BIM) is being implemented in the Architecture, Engineering, and Construction (AEC) industry; however, a significant gap still exists between the digitalized model and the actual construction process [4], even though BIM has been implemented in the field for many years. MR (mixed reality) is a new technology that bridges this gap by combining physical and digital information to create a more engaging, interactive experience [5]. Prior researchers have studied the use of MR for general construction visualization [6,7] to extend its application.
An industry that recognizes the importance of quality is the architecture, engineering, and construction (AEC) sector, particularly in areas such as reinforced concrete inspection, a critical part of this industry's work [8]. Traditional methods such as paper-based drawings and manual verification are prone to human error, leading to more costly rework, safety issues, and project delays [9]. Though new technologies such as mixed reality (MR) offer a potential solution, providing visualization of the world in all its aspects and the ability to overlay real-time data, the existing literature presents a disjointed view of their actual worth [10].
Past studies have largely aimed to demonstrate the potential of individual technologies, usually in controlled laboratory settings. This has resulted in a big knowledge gap in the comparative effectiveness of individual technologies in the real field environment [11]. Nonetheless, there is a serious gap in the design and empirical testing of a dedicated computational MR model for certain high-stakes inspection processes, such as rebar placement. There are three fundamental gaps that must be addressed. To start with, no empirical, head-to-head comparisons of immersive MR devices (e.g., HoloLens) and less expensive digital tools (e.g., tablets) are done on the same tasks. Second, the effect of the surrounding environment on the functionality of such technologies is not well understood; it is unclear whether the benefits proven in the laboratory can be applied to the uncontrolled, unpredictable environment of a construction site. Third, inspection is frequently discussed in literature as a homogeneous process. No effort is made to understand whether certain technologies are more effectively applied to detect certain types of mistakes. The purpose of this study is to fill these gaps by answering the following research questions.
- What is the comparative effectiveness of Head-Mounted Display (HMD)-based MR, handheld tablet-based AR, and traditional methods in reducing errors during concrete rebar inspection?
- How does the environmental context (controlled lab vs. realistic site conditions) moderate the performance advantages of these inspection technologies?
- Are the performance benefits of specific technologies consistent across different categories of inspection errors?
This study aims to address the following objectives.
- To quantitatively assess the inspection accuracy, measured by error count, of HMDs (Hololens), handheld devices (Tablets), and traditional methods (Checklist, Camera, Paper) in a controlled experimental setting.
- To evaluate the interaction effect between the inspection medium and the environmental context, determining the robustness of technological advantages when moving from idealized to realistic settings.
- To analyze the performance profile of each medium across a spectrum of common rebar installation errors to identify any task-technology specialization.
A computational assessment framework has been developed in this paper to simulate and predict these gaps, thereby addressing them through the performance of the inspection technologies used in the inspection process. In contrast to earlier studies, the work does not simply compare the devices but constructs a context-sensitive model of their performance. The main contribution to the computation is a proven statistical model that measures the interaction between the technological medium and the environmental context. This model provides a decision model for selecting the most appropriate technology. This study thus shifts the paradigm from seeking the universal most effective technology to one that offers a principled, evidence-based approach to matching technological potential with selected operational limitations in quality control of construction.
Literature
The digital transformation of construction inspection
The AEC industry is undergoing a digital transformation to improve its productivity and quality control [12]. As a result of these changes, BIM has expanded beyond 3D modelling to include an extended data space for managing the entire project lifecycle [10,13]. Nevertheless, the final stage of data on site implementation and validation is usually conducted in an analog manner [14]. The findings of [15] indicate that the main cause of mistakes and delays in a project is the engineer's inability to promptly translate design specifications into field operations. Consequently, there has been a surge of interest in mobile computing and augmented visualization to bring digital information to the point of work [16].
Mixed reality as a human-centric computational interface
MR, situated at the boundary between reality and virtuality, enables direct communication with digital content in a real setting [17]. In construction, MR has evolved from a visualization innovation into a tool used in construction activities, including assembly instructions, progress tracking [18], and safety education [19]. The main benefit of MR is that it reduces cognitive load by placing information in a context that helps lighten it. Using individual 2D plans or 3D models on a tablet reduces the need for mental translation [20]. [21] Discuss how this anthropomorphic user interface can assist decision-makers in interpreting complex issues in unpredictable environments and enhance decision making.
Recent advances in MR for inspection and quality control
In recent years, MR has become increasingly popular as a quality assurance method. [22] demonstrated that MR can be used to verify the correctness of pipe assemblies [23]. Investigate its use in architectural finishes inspection [24]. Note a trend toward integrating MR with IoT sensors and AI to enable automated defect detection. Nonetheless, there are few studies related to rebar inspection. On the one hand [12], offered an idea of a conceptual model [25] and [26] emphasized the potential of MR to be applied to structural steel construction, but there are still many challenges to overcome, such as the lack of a detailed computational framework, or a quantitative, comparative analysis of the effectiveness of MR when identifying typical placement errors of rebar. This paper addresses this gap by presenting a systematic MR framework and its empirical validation.
Computational Modeling Framework
A computational performance model has been added to the paper to formalize the relationship between inspection technologies and environmental conditions. In the operationalized output, the number of undetected errors is determined by the technological medium used (e.g., HoloLens, Tablet, Paper) and the experimental context (e.g., Lab, Realistic Site). A framework designed to quantify the performance benefit of a technology is based on a statistical model that quantifies this benefit, and it is rapidly disappearing as environmental fidelity improves. As a result of the model's architecture, three layers of computation are involved.
- Variable space definition: Formalizes the operational parameters of each medium and environmental context.
- Interaction matrix: Computes the pairwise effects between medium and context variables, which is the central predictive component of the framework.
- Performance prediction: Generates expected accuracy metrics for any medium-context combination.
This computational model is mainly composed of statistical models that determine the accuracy of the inspections we expect to be performed. This is a result of the inspections we expect to conduct. Several factors influence this process, including the technological medium and the environment. The main error-counting data analysis was carried out using a Generalized Linear Mixed Model (GLMM) with a negative binomial distribution [27] and a log link function. The model was defined as follows.
Model equation 1:
Error count log(λ ij) = β0 + β1(Medium i) + β2(Experiment Type j) + β3(Medium × Experiment Type) ij + ui
Where:
- λ ij is the expected error count for technological medium *i* in experimental context *j*.
- β0 is the global intercept.
- β1 is the vector of fixed effect coefficients for the inspection Medium (HoloLens, Tablet, etc.).
- β2 is the vector of fixed effect coefficients for the Experiment Type (Lab, Realistic Site, etc.).
- β3 is the vector of coefficients for the Interaction between Medium and Experiment Type.
- ui ~ N (0, σ² u) is the random intercept for participant *i*, accounting for the repeated-measures design.
For the secondary analyses, Linear Mixed Models (LMMs) were used for continuous outcomes.
Model equation 2:
Time ij = β0 + β1(Medium i) + β2(Experiment Type j) + β3(Medium × Experiment Type) ij + ui + ε ij
Model equation 3:
Efficiency ij = β0 + β1(Medium i) + β2(Experiment Type j) + β3(Medium × Experiment Type) ij + ui + ε ij
Where ε ij ~ N(0, σ²) is the residual error term.
Research Methodology
A systematic empirical method was applied to the study to evaluate the computational model by measuring its key variables and their relationships [28]. A multi-factorial study design was used to assess the proposed performance model [29]. It was decided to use the checklist, camera, color paper, and the type of experiment (Lab, Realistic Site, Traditional) to gather the data using the two mediums (HoloLens and Tablet) to determine how the independent variables impact the precision of the inspection, based on the two mediums and types of experiments (Lab, Realistic Site, Traditional). Empirical validation is a method in which the model's parameters are scaled, and its predictive capability is assessed under controlled conditions to determine its validity. Due to balanced data collection across all medium context combinations in the study, the design provided full coverage of the model's variable space and enabled statistical analysis of the results.
Experimental design and participants
The computational model was validated using a mixed-factorial experiment with 72 independent observations. As a result of recruiting 12 subjects, eight graduate students in construction engineering, and four professional engineers, these subjects were selected for the study and underwent inspections under different conditions regularly. There were three experimental types: Lab, Realistic Site, and Traditional, and the design was between-subjects (across participants in each of the three experimental types) and within-subjects (across participants using multiple media types within their assigned experiment type). There was a disproportionate number of groups (HoloLens: n=16, Tablet: n=16, Checklist: n=8, Camera: n=8, Paper: n=24) generated because of this method, which accurately represented the variables of the model and provided strong statistical power for the validation of the computational framework.
Apparatus and inspection specimen
The Realistic Site Condition has been created so that ordinary field conditions can be added to the site. In addition, it was not uncommon to encounter construction noise of approximately 80 dB transmitted through speakers; dynamic lighting that mimicked the sun and its shadows; and equipment, such as building materials and machinery, in the inspection area.
- MR System: Microsoft HoloLens 2 running a custom Unity application.
- Tablet System: Samsung Galaxy Tab S7, a 3D model that can be rotated, zoomed in.
- Conventional measuring tape, clipboard, paper checklist, and 2D drawings.
- Rebar Specimen: An eight bar cage (3.0m x 3.0m x 0.5m) was built with eight deliberate, common faults (Figure 2): (1)Wrong bar spacing, (2)Missing bar, (3)Extra bar, (4)Insufficient side cover, (5)Insufficient bottom cover, (6)Wrong number of anchorage bars, (7)Incorrect length of anchorage, (8)Wrongly tied bars.
Procedure and data collection
As Part of the training, participants received standard training in each method. It was their responsibility to identify and report the eight pre-installed faults in each trial they participated in. This study gathered a wide range of measures, including the following.
- Accuracy: The number of faults that were correctly detected (out of 8).
- Time: Minutes of the task being completed, the time of completion was measured using a stopwatch during the task.
- Efficiency: The number of times it takes to complete a task multiplied by the number of errors that have been identified correctly.
For consistency, fault identification has been strictly defined to ensure scoring consistency. Identifying the fault in the code can be considered valid only if, as a participant, you have completed the following activity. Mark the fault's location clearly in the code (e.g., the third vertical line on the left side) so it can be easily identified. By using the predefined fault categories provided, you must specify the nature of the fault to categorize it correctly (e.g., "Insufficient bottom cover", "Missing bar"). The ground truth for all trials was the set of eight pre-installed faults, documented with their precise locations and types during specimen fabrication (as listed in Section “Apparatus and inspection specimen”). Participant responses were compared against this master list. Vague or incorrect classifications (e.g., stating "spacing is wrong" for a "missing bar" fault) were not counted as correct identifications.
Experimental design and counterbalancing
|
Experiment Type |
Participants (n) |
Media |
|
Lab Experiment |
8 |
HoloLens, Tablet, Paper |
|
Realistic Site Condition |
8 |
HoloLens, Tablet, Paper |
|
Traditional Inspection Method |
8 |
Checklist, Camera, Paper |
A mixed-factorial research design underpinned the study's results. It is essential to understand that the context in which the experiments were carried out (Lab, Realistic Site, Traditional) was a between-subjects factor, meaning that each participant participated in only one of these settings. In this study, the inspection medium was a within-subjects factor, i.e., each participant used all media according to their specific situation during the inspection. Using a Latin square design to control order and learning effects ensured a completely balanced sequence of media presentations. In addition, the media trials were conducted on a structurally identical but different rebar specimen with the same eight types of errors. This was to avoid memorization of identical fault locations.
As Part of the inspection process, a construction inspector checks for eight types of reinforcement errors: spacing between rebars, missing rebars, extra rebars, insufficient rebar cover at each face of the reinforcement, insufficient anchorage bars, insufficient lengths, and tied and supported rebars (Figure 1). Figure 1 shows the defects that have been inserted into the rebar framework and should be checked.
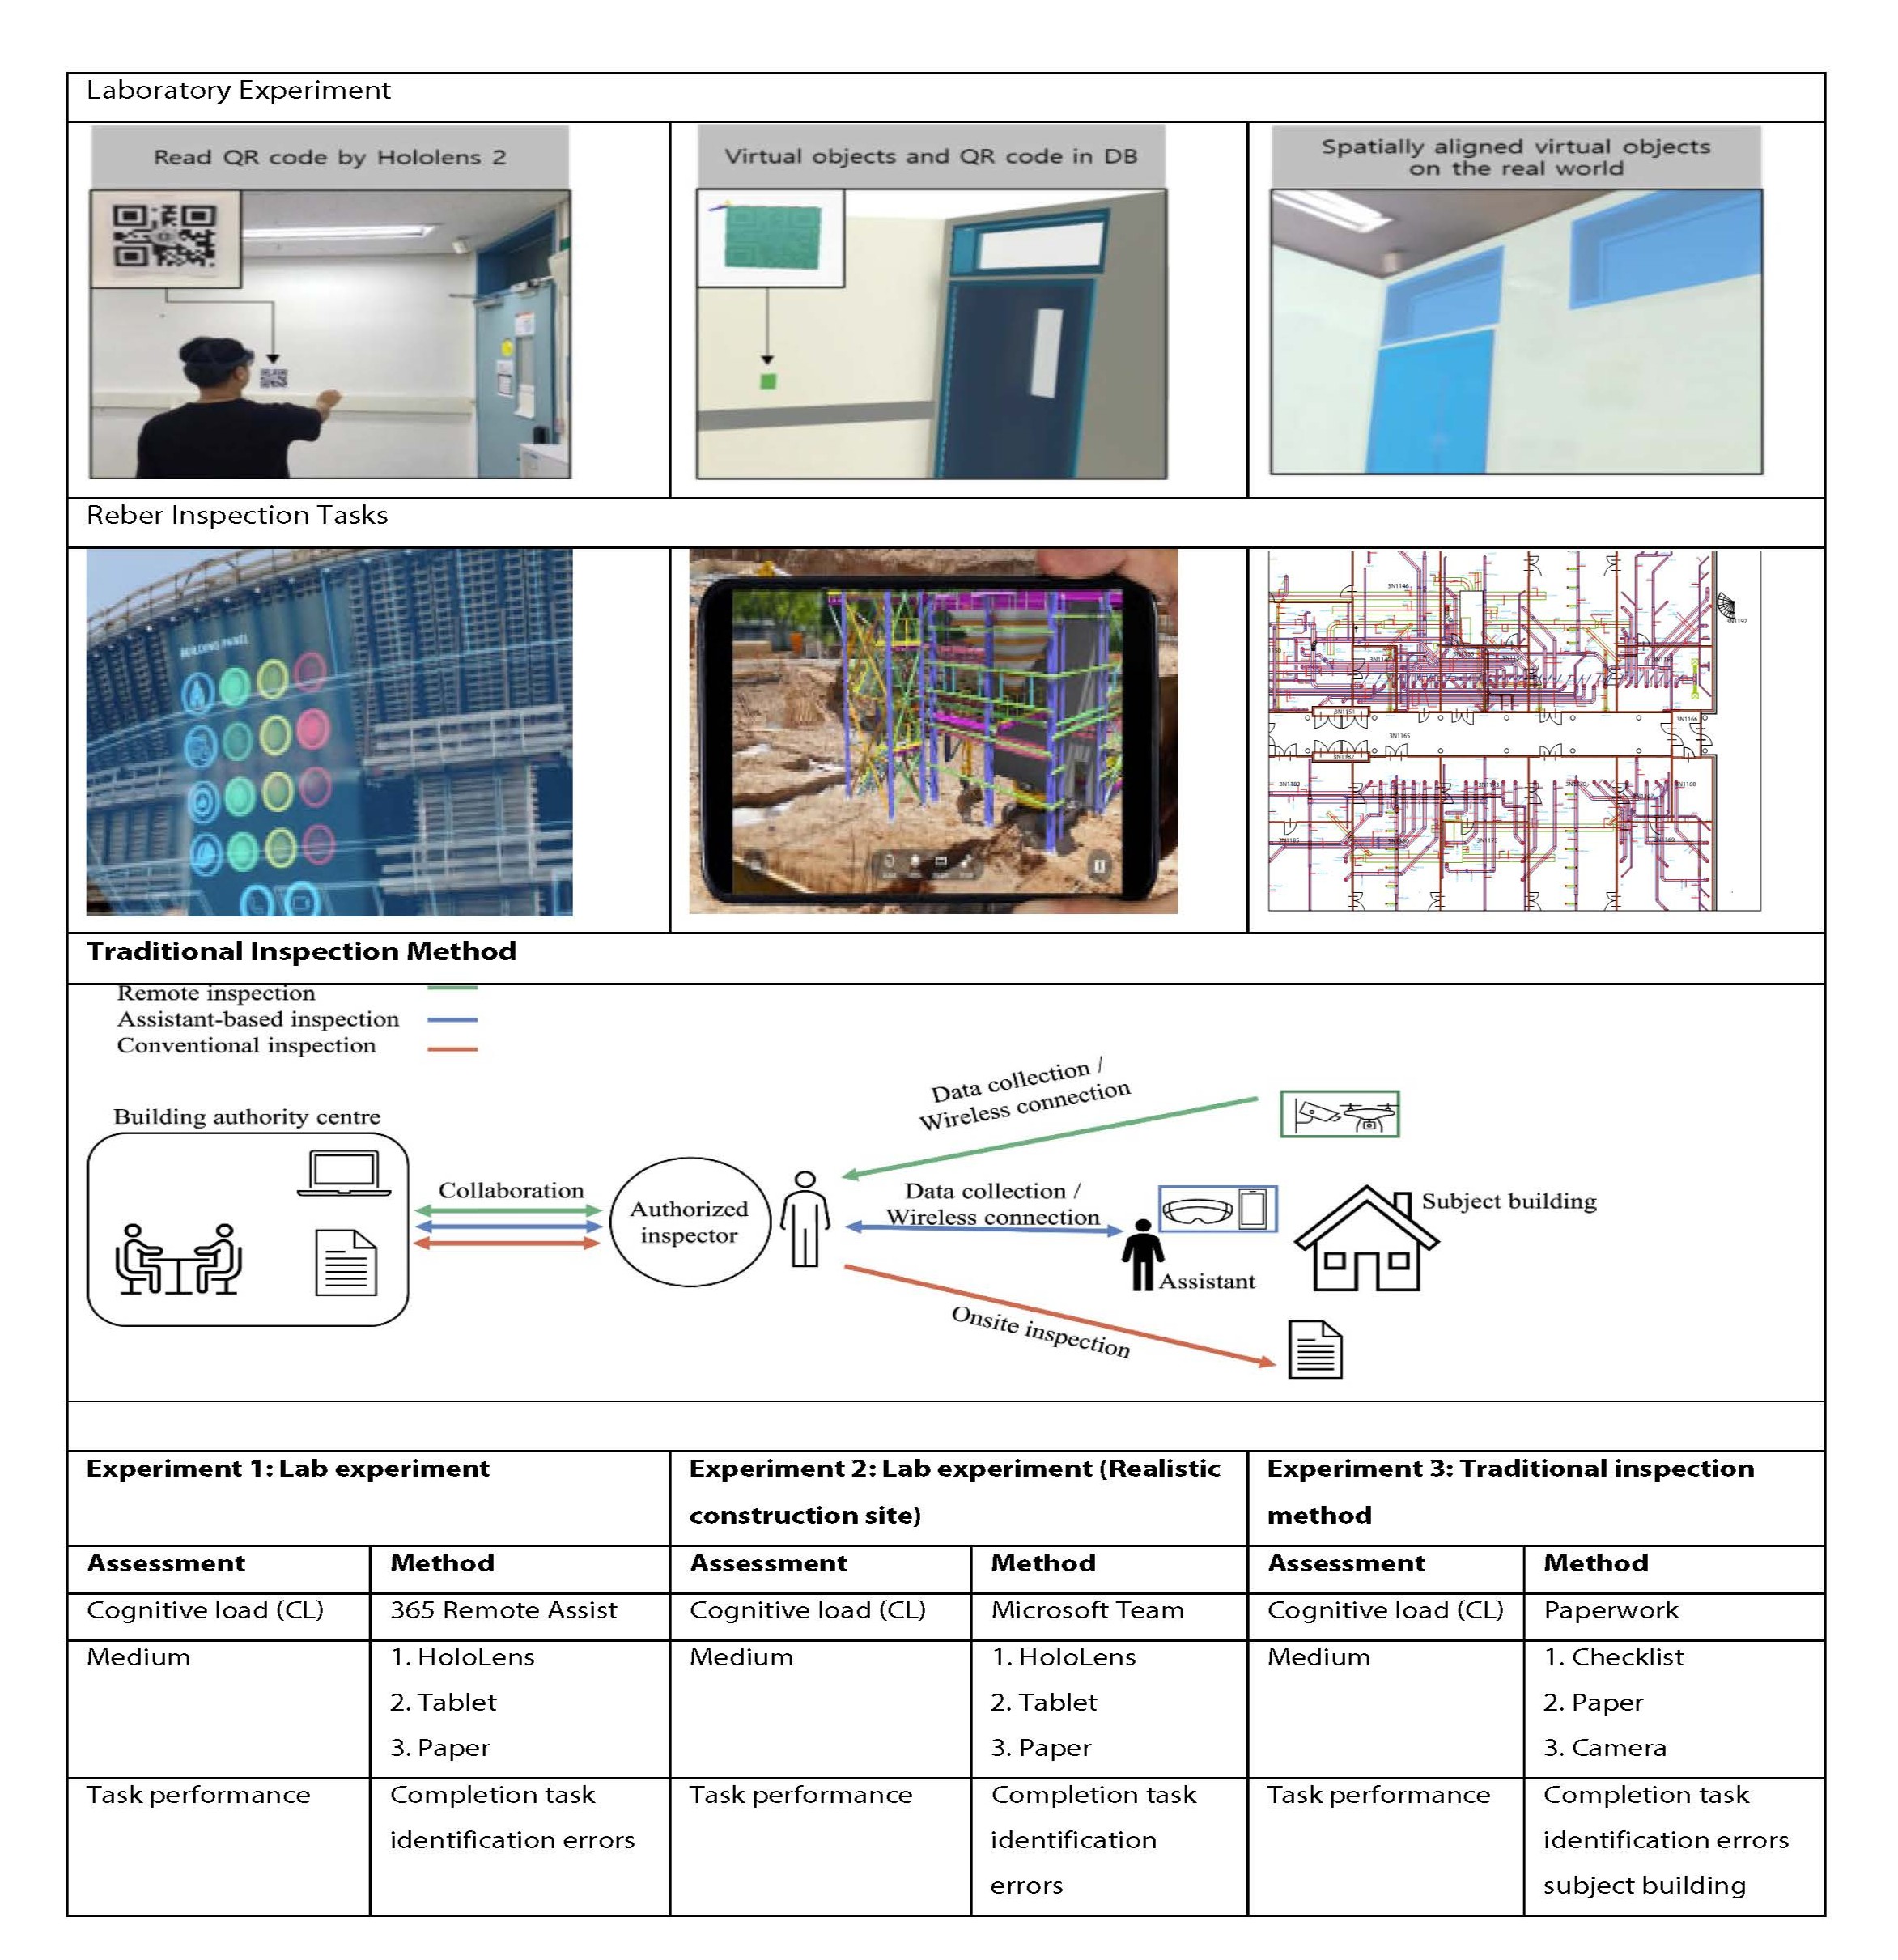
Figure 1. Experimental methodology.
This model aims to demonstrate how an innovative BIM system can drive mixed reality (MR) in the construction industry to achieve high efficiency. It is generally believed that BIM model data is the digital foundation of the building information model. This data is then incorporated on the building site to provide an understanding of the building's physical layout and the construction work in progress. The computational engine then processes the combined data to carry out important tasks, such as detecting spatial conflicts and optimizing sequencing, in several ways. To provide these context-aware choices, it directly displays instructions, safety warnings, or Part information on the user's physical view, superimposing them on the MR headset's view. MR application is continuously measured against Performance Metrics, including installation accuracy, reduced rework, and time required to complete a task, as well as tangible, optimized value on the construction site, as shown in Figure 2.
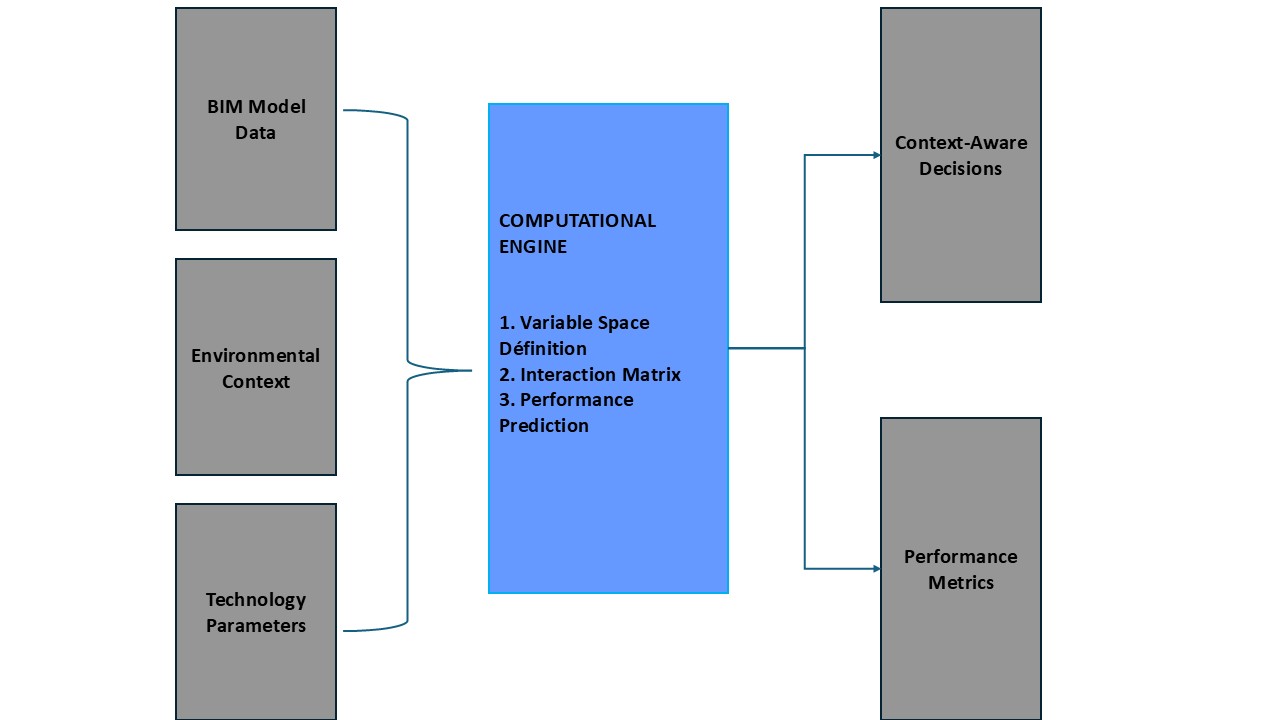
Figure 2. Computational framework architecture.
As shown in Figure 3, it is believed that mixed reality (MR), particularly HoloLens, can be used to quickly and efficiently inspect rebar in extremely noisy areas. As a result of high ambient noise (generated by machines, vehicles, and workers), both traditional and tablet-based inspections suffer greatly because they prevent clear communication and force the inspector to perform manual measurements prone to error, as well as to shout instructions to the inspector [2].
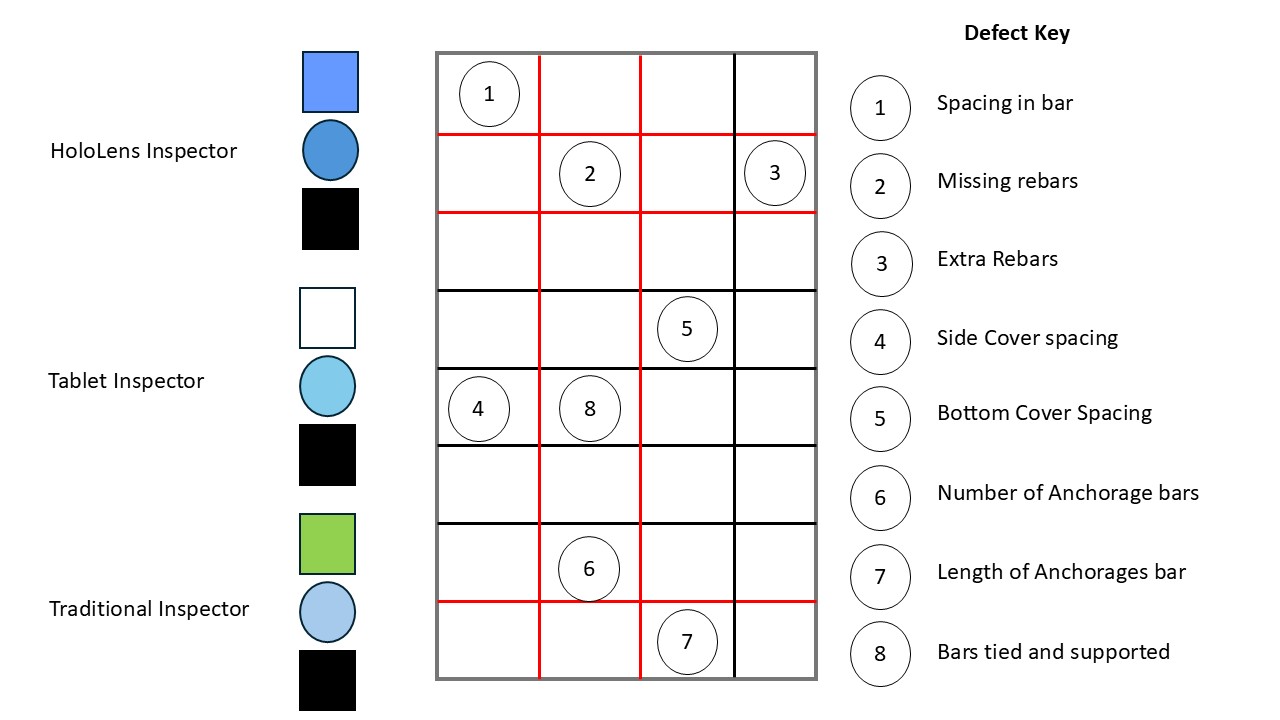
Figure 3. Conceptual diagram of errors in rebar framework.
However, the HoloLens Inspector uses a visual, data-driven interface that is not constrained by this type of noise, unlike previous interfaces. There is an automatic scanning of the rebar cage as it stands right now, a comparison with the BIM model, and visual overlays of the defect alerts on top of the view of the physical structure that the inspector sees. Hence, vital information such as bar spacing, missing rebars, and how to correct the concrete cover is conveyed in real time, without noise, through intuitive graphics and highlights, thereby eliminating the possibility of miscommunication and the need for verbal confirmation. Through real-time, context-aware visual guidance from the MR system, inspection accuracy and efficiency are maintained even when disruptive noise levels are present on site. The following data were obtained using a combination of automated recording devices and direct observation.
- Pre-experiment training: The MR system and conventional inspection methods were compared during the training.
- Observation: The error rate in identifying each specimen and the time required to complete an inspection were recorded by trained observers in all experiments.
- Data logging: The accuracy, time, and errors were recorded using automated tools to support statistical analysis. After the experiment is completed, a comprehensive feedback survey will be conducted to determine satisfaction with each technique.
Ethical approval and informed consent
The results of this study indicate that the fundamental ethical principles that govern the conduct of research involving human subjects were observed throughout the research process. As part of the study, each participant was given a written and verbal description of the study's purpose, how it would be carried out, and how the data collected would be used during the study. There were no repercussions for participants who withdrew from the program at any time. All participants participated voluntarily. A verbal announcement was made to all participants in advance that they would participate in the study. To ensure the confidentiality of all data, they were anonymized immediately after collection by removing any personal information and assigning unique participant codes.
Statistical analysis
All statistical analysis was done in RStudio 2025.09.2 (Posit Software, PBC) with R version 4.5.2 with the following packages, (lme4) to do generalized linear mixed models, (lmerTest) to do p-values in linear mixed models, (emmeans) to do estimated marginal means and post-hoc comparisons, and (performance) to do model diagnostics. The count nature of the data and overdispersion were controlled by analyzing error count data using Generalized Linear Mixed Models (GLMMs) with a Negative Binomial distribution and a log link function. Linear Mixed Models (LMM) were used to analyze completion time and efficiency measures. Participant ID was added as a random effect to both types of models to control repeated measures. The comparison of all post-hocs used Tukey's HSD correction for multiple comparisons. Diagnostic checks, such as dispersion tests for GLMMs and residual analyses for LMMs, were performed to assess model assumptions.
Results
Model specification and validation
The counted nature of the error data was accounted for by a GLMM (Generalized Linear Mixed Model) with a negative binomial distribution. According to the specification, the model was defined as follows.
log(λ ij) = β0 + β1Medium + β2Experiment Type j + β3(Medium × Experiment Type) ij + ui,
where λ ij represents the expected error count for medium i in experiment type j, β coefficients represent fixed effects, and ui ~ N (0, σ²u) is the random intercept of participant i. Based on diagnostic Model checks, the distributional assumptions appear correct, and there is no alarming overdispersion (dispersion ratio = 0.548, p = 0.008).
Error detection performance
According to the GLMM, there was a significant main effect of technological medium (χ²(4) = 85.23, p < 0.001) and a significant interaction between medium and experiment type (χ²(2) = 11.47, p = 0.003). Based on the results of the general model, 66.7 percent of the variance in error detection performance could be explained (R² = 0.667). As shown in Table 1, the GLMM was used to calculate estimated marginal means (EMMs) and 95% Confidence Intervals (CIs). In the laboratory, the HoloLens was the most accurate, and the paper-based inspection had the most errors (EMM = 20.35, 95% CI [17.06, 24.28]); and (EMM = 5.71, 95% CI [4.26, 7.66]). There was a similar trend in naturalistic site contexts, though the effect sizes were smaller; the trend remained positive.
|
Experiment Type |
Medium |
EMM |
SE |
95% CI Lower |
95% CI Upper |
|
Lab Experiment |
Paper |
20.35 |
1.830 |
17.06 |
24.28 |
|
Hololens |
5.71 |
0.855 |
4.26 |
7.66 |
|
|
Tablet |
10.67 |
1.250 |
8.49 |
13.42 |
|
|
Realistic Site |
Paper |
12.98 |
1.410 |
10.50 |
16.05 |
|
Hololens |
4.70 |
0.785 |
3.39 |
6.52 |
|
|
Tablet |
8.78 |
1.120 |
6.83 |
11.28 |
|
|
Traditional |
Paper |
13.23 |
1.430 |
10.71 |
16.35 |
|
Camera |
17.93 |
1.730 |
14.84 |
21.66 |
|
|
Checklist |
8.28 |
1.090 |
6.40 |
10.71 |
|
|
Note: EMM = Estimated Marginal Mean from Negative Binomial GLMM. CI = Confidence Interval |
|||||
A comparison between HoloLens and paper-based methods (Table 2) in pairwise tests with Tukey adjusted p-value (Table 2) was significantly lower in laboratory (Incidence Rate Ratio [IRR] = 0.28, 95% CI [0.18, 0.43], p < 0.001) and real-world (IRR = 0.36, 95% CI [0.23, 0.57], p < 0.001) conditions. Importantly, the critical comparison of the HoloLens and Tablet in both cases was also important (Laboratory: IRR = 0.54, p = 0.001; Realistic Site: IRR = 0.54, p = 0.005).
|
Comparison |
Experiment Type |
IRR |
95% CI Lower |
95% CI Upper |
Z value |
P value |
|
HoloLens vs Paper |
Lab |
0.28 |
0.18 |
0.43 |
-8.111 |
< 0.001 |
|
Tablet vs Paper |
Lab |
0.52 |
0.36 |
0.76 |
-4.999 |
< 0.001 |
|
HoloLens vs Tablet |
Lab |
0.54 |
0.37 |
0.78 |
-3.543 |
0.001 |
|
HoloLens vs Paper |
Realistic |
0.36 |
0.23 |
0.57 |
-5.513 |
< 0.001 |
|
Tablet vs Paper |
Realistic |
0.68 |
0.48 |
0.95 |
-2.591 |
0.026 |
|
HoloLens vs Tablet |
Realistic |
0.54 |
0.35 |
0.82 |
-3.154 |
0.005 |
|
Checklist vs Paper |
Traditional |
0.63 |
0.45 |
0.87 |
-3.036 |
0.007 |
|
Camera vs Paper |
Traditional |
1.36 |
1.01 |
1.82 |
2.424 |
0.041 |
|
Note: IRR = Incidence Rate Ratio. p-values adjusted using Tukey's HSD method |
||||||
Completion time and efficiency analysis
Using linear mixed models, we analyzed the intervention's completion time and efficiency (time to complete each correct identification). In the case of completion time, medium (F (4, 61) = 18.34, p < 0.001) and experiment type (F (2, 61) = 6.45, p = 0.003) showed significant main effects, but the interaction had a significant main effect as well (F (4, 61) = 4.23, p = 0.004).
The following table presents an overview of the time efficiency and productivity of EMMs, as shown in Table 3. Several electronic procedures have been implemented, significantly reducing inspection time and providing high accuracy. It has been found that HoloLens inspections, when conducted in laboratory environments, were 78% faster than paper-based methods (mean difference = -32.51 minutes, p < 0.001) and in realistic settings (mean difference = -24.95 minutes, p < 0.001). In all situations, digital procedures had a shorter time to correct identification than paper procedures.
|
Metric |
Experiment Type |
Paper |
Hololens |
Tablet |
Camera |
Checklist |
|
Time (min) |
Lab |
41.36 (2.1) |
8.85 (1.4) |
19.08 (1.8) |
- |
- |
|
Realistic |
41.36 (2.1) |
16.41 (1.6) |
19.08 (1.8) |
- |
- |
|
|
Traditional |
41.36 (2.1) |
- |
- |
47.99 (2.3) |
33.37 (2.0) |
|
|
Efficiency |
Lab |
2.03 (0.15) |
1.55 (0.12) |
1.79 (0.14) |
- |
- |
|
Realistic |
3.18 (0.22) |
3.49 (0.24) |
2.17 (0.16) |
- |
- |
|
|
Traditional |
3.12 (0.21) |
- |
- |
2.68 (0.18) |
4.03 (0.28) |
|
|
Note: Values represent Estimated Marginal Means (Standard Errors). Efficiency = minutes per correct identification |
||||||
Figure 4 illustrates the context-dependent nature of technological performance by plotting the Estimated Marginal Means of error counts across a range of experimental contexts. The similarities and differences in the technology lines indicate a high level of interaction between the medium and the experiment type. There has been no degradation in HoloLens performance in laboratory or field tests.
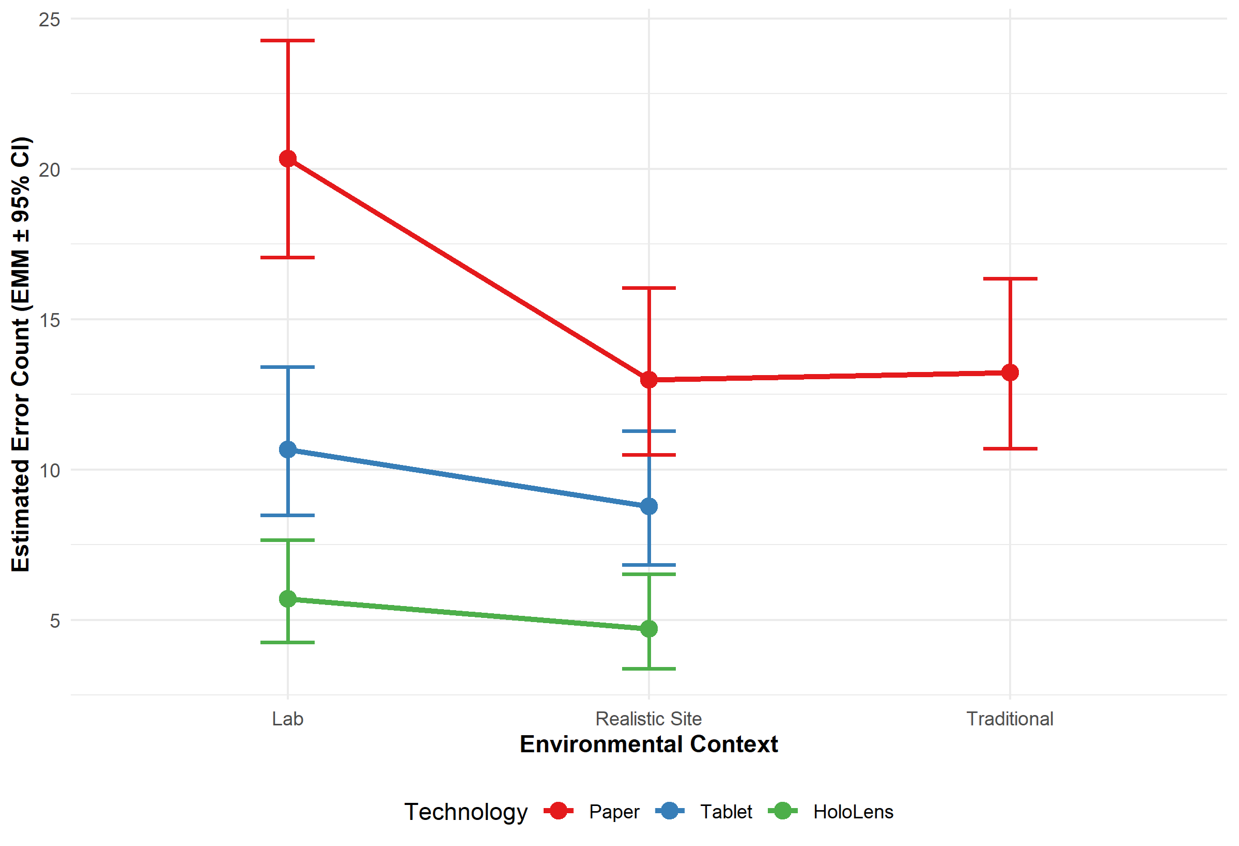
Figure 4. Performance persistence across contexts: HoloLens maintains error detection superiority despite environmental challenges. Error bars show 95% CI.
In Figure 5, you can see the time required to identify a correct error. Although efficiency was universally enhanced by digital means, HoloLens offered the best balance between speed and accuracy, especially in laboratories. Figures 4 and 5 visually summarize context-dependent performance patterns. Figure 4 shows a consistent technological hierarchy across all environmental contexts. It also shows that HoloLens is better at error detection as ecological complexity increases. Figure 5 illustrates the benefits of digital approaches in terms of efficiency, with the HoloLens offering the most effective balance between inspection speed and accuracy.
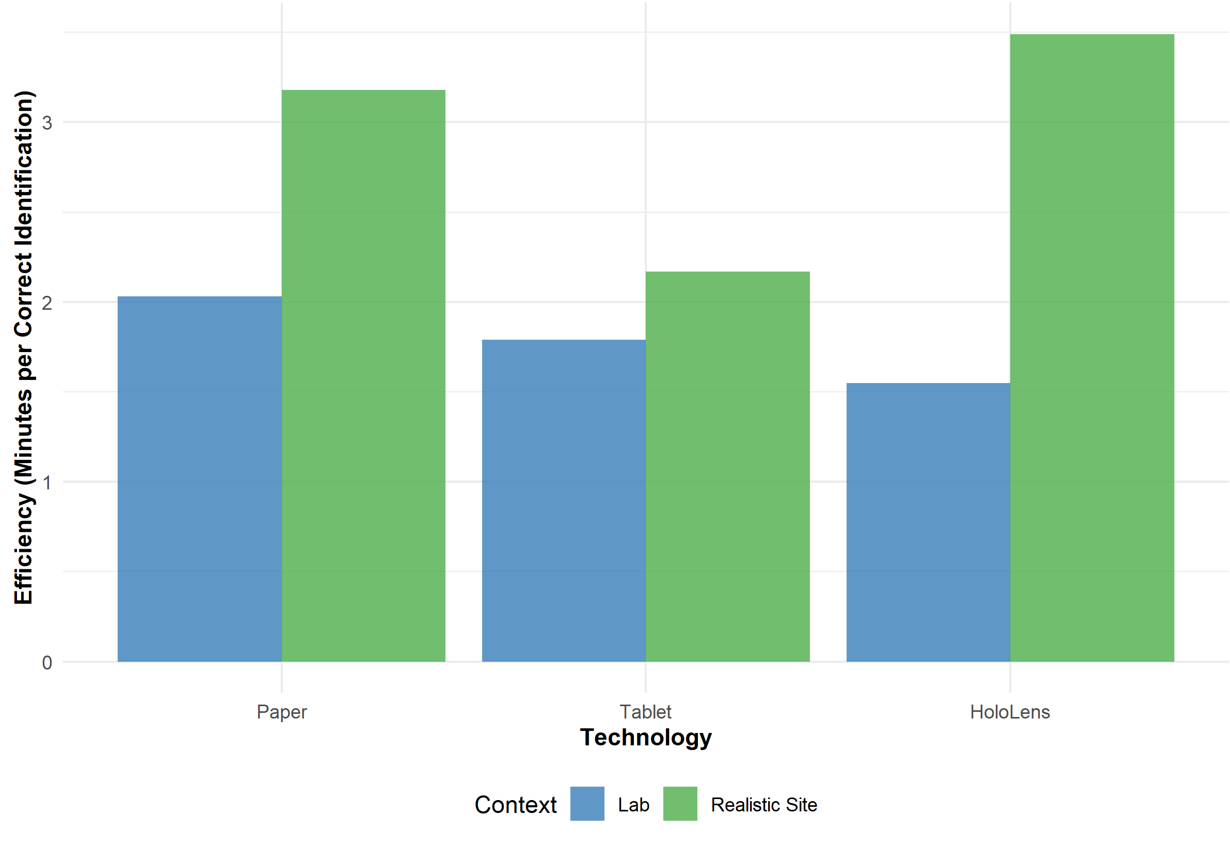
Figure 5. Efficiency trade-offs: HoloLens delivers optimal time-accuracy balance across laboratory and field conditions.
Absence of task-technology specialization
Additionally, GLMMs were used to check the specificity of error types, but no significant interactions were found between medium x error type (F (28, 32) = 0.60, p = 0.914), indicating that the benefits of technology were not specific to a specific type of error, but were generally applicable to all error types.
Discussion
Empirical validation of the computational framework
The findings of this study provide strong empirical support for the computational framework suggested in the previous section and demonstrate that the performance of construction inspection technology varies depending on the situation at hand. Considering the significant interaction between Medium and Experiment Type (χ² (2) = 11.47, p = 0.003), a substantial claim of the framework can be made: technological superiority is not a given, but rather a phenomenon resulting from the interaction between the capabilities of a system and its limitations within the environment. According to the statistical data, a subtle performance environment can be inferred. Although HoloLens showed a distinct superiority in a controlled laboratory environment (IRR = 0.28 vs Paper, p < 0.001), which favors the theoretical benefits of immersive interfaces, the performance advantage was not overwhelming, but relatively moderately superior in simulated environments on a site (IRR = 0.36 vs Paper, p < 0.001). Moreover, when comparing immersive and handheld digital interfaces on a critical basis, the results were significant in both contexts (Laboratory: p = 0.001; Realistic Site: p = 0.005), supporting the strength of the MR benefits.
Addressing environmental context and validity threats
In terms of study design, multi-context testing was an approach that clearly addressed the problem of ecological validity. There is no doubt that the laboratory conditions demonstrated the technology's full potential, but realistic field conditions demonstrated its practical applicability. This study addressed several validity threats: participant training was counterbalanced across conditions, ordering effects were checked, and the relatively small sample was compensated for by including 72 independent observations. Several real-world environmental factors, such as varying lighting, ambient noise, and physical space, appear to be mediated rather than negate the benefits of magnetic resonance imaging. In the end, this shows that field conditions may affect the comfort and ease of use of HMDs, though the fundamental cognitive advantages of overlaying spatial information remain.
Methodological advances and statistical rigor
This research uses Generalized Linear Mixed Models, a methodological improvement over the traditional ANOVA used in the study of construction informatics. By modeling count data appropriately and using random effects for participants, the analysis can provide better estimates of effect sizes and better Type I error control. It is intuitively clear that the GLMM-estimated incidence rate ratios provide a quantitative view of technological impact: users of HoloLens spotted errors at a rate of 28–36 percent, which is the same as 64–72 percent of the mistakes detected by paper-based inspectors.
Practical implications for strategic technology deployment
For strategic technology deployment, the computational framework will allow context-specific solutions, HoloLens will deliver the maximum accuracy (72% error reduction) for high-stakes inspections, tablets will provide significant improvements (32% error reduction) when used in the field regularly with less implementation overhead, and structured digital checklists will provide direct benefits (37% error reduction) as the best entry point to digital transition with minimal training requirements.
Conclusion
The purpose of this study is to contribute to the field of construction informatics, both in terms of methodology and practice. The study demonstrates the importance of evaluating technology using proper statistical modeling from a methodological standpoint. This study uses GMMs, which are appropriate for analyzing data distributions and for GMM-based experimental design. The study presents preliminary empirical data showing that Mixed Reality inspections are statistically significantly more effective than traditional inspections, regardless of the degree of environmental fidelity, and that they are more effective when using tablet-based technology. As a result of the development and testing of computational frameworks, the paradigm of seeking universal solutions to technological problems that suit the situation has changed. In real-world situations, the framework provides construction managers with principled decision support for determining whether to invest in MR technology by quantifying the decay function of the benefits it delivers. Furthermore, the numerical significance of the results continues to increase.
It is the next generation of research that examines the economic trade-offs identified in time-efficiency analyses and explores the human factors that influence how technology is used. It is a computational system that serves as the basis for a quality management system. It can dynamically optimize technology selection based on project requirements, environmental factors, and the organization's limitations.
Funding
This research was not funded by a public, private, or not-for-profit agency.
Competing Interests
It is declared that the authors have no competing interests.
Data Availability
This study generated and analyzed data that can be accessed through the Zenodo repository, https://doi.org/10.5281/zenodo.17685935.
References
2. Ghosh B, Karmakar S. Development and Application of a Digitalized Construction Quality Document Management System for Advanced Construction Using Building Information Modeling. Journal of Construction Engineering and Management. 2025 Jun 1;151(6):04025053.
3. Hossain MI, Hosen MM, Sunny MA, Tarapder SA. IMPLEMENTING ADVANCED TECHNOLOGIES FOR ENHANCED CONSTRUCTION SITE SAFETY. American Journal of Advanced Technology and Engineering Solutions. 2025 May 2;1(02):01–31.
4. Sepasgozar SM, Khan AA, Smith K, Romero JG, Shen X, Shirowzhan S, et al. BIM and digital twin for developing convergence technologies as future of digital construction. Buildings. 2023 Feb 4;13(2):441.
5. Pham VB, Wong SP, Abbasnejad B. A systematic review of criteria influencing the integration of BIM and Immersive Technology in Building Projects. Journal of Information Technology in Construction (ITcon). 2025;30:243–97.
6. Chalhoub J, Ayer SK. Using Mixed Reality for electrical construction design communication. Automation in Construction. 2018 Feb 1;86:1–10.
7. Li L, Li Z, Li X, Wu G. A review of global lean construction during the past two decades: analysis and visualization. Engineering, Construction and Architectural Management. 2019 Jul 10;26(6):1192–216.
8. Deng F, Mehdipour A, Soltani A. Construction quality control of concrete structures in architectural engineering—A case in Shanghai, China. Urban Resilience and Sustainability. 2024;2(3):256–71.
9. Foroughi Sabzevar M, Gheisari M, Lo J. Analyzing the pros and cons of paper-based 2D drawings in construction: a survey of US construction professionals. International Journal of Construction Management. 2025 Mar 12;25(4):428–38.
10. Liu Z, Gong S, Tan Z, Demian P. Immersive technologies-driven building information modeling (BIM) in the context of metaverse. Buildings. 2023 Jun 19;13(6):1559.
11. Hasselsteen L, Lindhard SM, Kanafani K. Resource management at modern construction sites: Bridging the gap between scientific knowledge and industry practice and needs. J Environ Manage. 2024 Aug;366:121835.
12. Manzoor B, Othman I, Pomares JC. Digital Technologies in the Architecture, Engineering and Construction (AEC) Industry-A Bibliometric-Qualitative Literature Review of Research Activities. Int J Environ Res Public Health. 2021 Jun 6;18(11):6135.
13. Tran HV, Nguyen TA. A review of challenges and opportunities in BIM adoption for construction project management. Engineering Journal. 2024 Aug 31;28(8):79–98.
14. Shringi A, Arashpour M, Prouzeau A. Constructible design for off-site prefabricated structures in industrial environments: Review of mixed reality applications. InISARC. Proceedings of the International Symposium on Automation and Robotics in Construction 2020 (Vol. 37, pp. 1074–1081). IAARC Publications.
15. Maqsoom A, Zulqarnain M, Irfan M, Ullah F, Alqahtani FK, Khan KI. Drivers of, and barriers to, the adoption of mixed reality in the construction industry of developing countries. Buildings. 2023 Mar 27;13(4):872.
16. Ogunseiju OO, Akanmu AA, Bairaktarova D. Mixed reality based environment for learning sensing technology applications in construction. Journal of Information Technology in Construction. 2021 Jan;26:863–85.
17. Rauh SF, Bogdan C, Meixner G, Matviienko A. Navigating the virtuality-reality clash: reflection and design patterns for industrial mixed reality applications. InProceedings of the 2024 ACM Designing Interactive Systems Conference 2024 Jul 1 (pp. 2247–66).
18. Anwar RM, Azhar S. Mixed Reality in Building Construction Inspection and Monitoring: A Systematic Review. Virtual Worlds. 2024 Aug 13;3(3):319–32.
19. Rokooei S, Shojaei A, Alvanchi A, Azad R, Didehvar N. Virtual reality application for construction safety training. Safety Science. 2023 Jan 1;157:105925.
20. Partarakis N, Zabulis X. A review of immersive technologies, knowledge representation, and AI for human-centered digital experiences. Electronics. 2024 Jan 7;13(2):269.
21. Rafsanjani HN, Nabizadeh AH. Towards human-centered artificial intelligence (AI) in architecture, engineering, and construction (AEC) industry. Computers in Human Behavior Reports. 2023 Aug 1;11:100319.
22. Li W, Ye Z, Wang Y, Yang H, Yang S, Gong Z, et al. Development of a distributed MR-IoT method for operations and maintenance of underground pipeline network. Tunnelling and Underground Space Technology. 2023 Mar 1;133:104935.
23. Carrasco MD, Chen PH. Application of mixed reality for improving architectural design comprehension effectiveness. Automation in Construction. 2021 Jun 1;126:103677.
24. Pan Y, Zhang L. Integrating BIM and AI for smart construction management: Current status and future directions. Archives of Computational Methods in Engineering. 2023 Mar;30(2):1081–110.
25. Fill HG, Muff F. Bridging the mental and the physical world: conceptual modeling and augmented reality. Informing Possible Future Worlds: Essays in Honour of Ulrich Frank. 2024:197–212.
26. Yosefi A, Mojtahedi FF, Bahrami M. Identification of Damages in Concrete and Steel Structures: A Comprehensive Review. Damage Detection and Structural Health Monitoring of Concrete and Masonry Structures: Novel Techniques and Applications. 2025 Mar 22:207–47.
27. Sunde PB, Sunde P, Sayers J. Sex differences in mental strategies for single-digit addition in the first years of school. Educational Psychology. 2020 Jan 2;40(1):82–102.
28. Kineber AF, Oke AE, Alyanbaawi A, Abubakar AS, Hamed MM. Exploring the cloud computing implementation drivers for sustainable construction projects—A structural equation modeling approach. Sustainability. 2022 Nov 9;14(22):14789.
29. Jones P, Drummond P. Construction and evaluation of a mindfulness-based quality of life and well-being program (MQW) in a randomized trial. Current Psychology. 2023 Jun;42(17):14782–803.