Abstract
Objective: The purpose of the present study was to evaluate, in multiple sclerosis (MS) lesions, the diagnostic performance of two different commercial post-processing MR perfusion software. These two different algorithms for processing Dynamic susceptibility contrast (DSC) perfusion images have been used to differentiate perfusion values among white matter (WM) lesions, normal appearing white matter (NAWM), and grey matter (GM) in MS. The diagnostic performance for differentiating among lesions and normal tissue has been measured with respect to the Time to Peak (TTP).
Methods and analysis: Analysing DSC perfusion imaging, a retrospective study has been performed on 74 MS patients and 15 normal subjects, by using 1.5 Tesla MRI scanner. TTP maps were generated by using 2 different commercially available algorithms (A;B). Analysis was conducted for the evaluation of diagnostic performance of different algorithms for differentiating between lesions and normal appearing WM and GM.
Results: A statistically significant difference between the two algorithms was demonstrated by comparing TTP values among recent, stable lesions and NAWM. TTP values have been used to discriminate among recent, stable lesions and NAWM by using two different software packages.
Conclusion: The optimal software should be that which increases the temporal resolution and be not operator dependent. TTP has been able to 1) examine the variability in the quantitative results of DSC MR perfusion imaging generated from identical source data of MS patients, 2) to identify the variables between two commercial post-processing algorithm and 3) to focus on the crucial role of post-processing inter-vendor differences.
Keywords
Dynamic Susceptibility Contrast, Time to Peak, Magnetic Resonance Imaging, Multiple Sclerosis, Normal Appearing White Matter
Abbreviations
MR: Magnetic Resonance; MRI: Magnetic Resonance Imaging; MS: Multiple Sclerosis; DSC: Dynamic Susceptibility Contrast; WM: White Matter; NAWM: Normal Appearing White Matter; GM: Grey Matter; TTP: Time to Peak; AIF: Arterial Input Function; MTT: Mean Transit Time; CBF: Cerebral Blood Flow; SVD: Singular Value Decomposition; MCA: Middle Cerebral Artery; SPSS: Statistical Package for the Social Sciences; BBB: Blood–Brain Barrier; rCBV: relative CBF
Introduction
Cerebral circulation is essential to guarantee the proper functioning of the entire system and represents the movement of blood through the network of cerebral arteries and veins supplying the brain with the necessary oxygen and energy substrates [1]. In this regard, abnormal perfusion levels have been associated with a wide range of brain disorders such as stroke [2], brain tumors [3], Alzheimer’s disease [4], and multiple sclerosis (MS) [5].
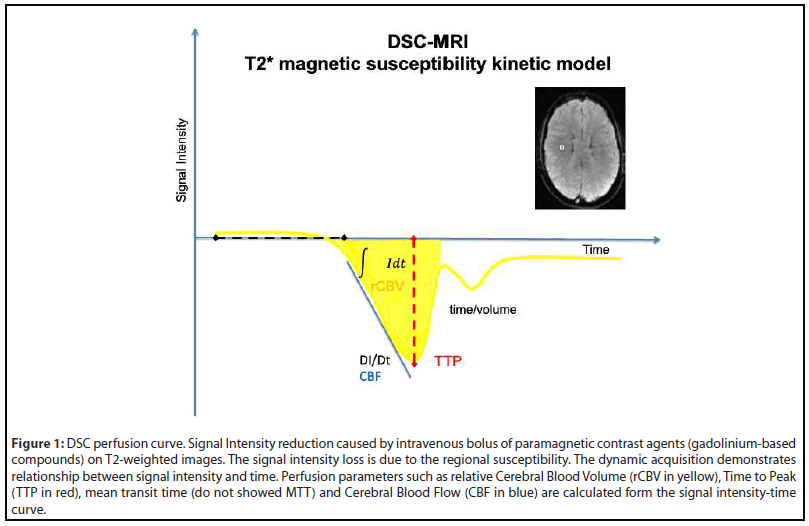
For this reason, the needs of quantitative measurements of the brain perfusion have become compelling for advancing our understanding of the brain physiology and pathophysiology [6]. One of the most frequently used techniques to non-invasively quantify brain perfusion is the Dynamic Susceptibility Contrast (DSC) which images the first pass of a bolus of gadolinium-based contrast through the brain by a series of T2*-weighted (T2*W) MRI images to generate a signal intensity to time curve, also known as an arterial input function (AIF) [7]. The decay in the signal intensity is caused by the susceptibility of the contrast leads to a signal loss in the AIF. From this curve (Figure 1), multiple hemodynamic parameters such as time to peak (TTP), mean transit time (MTT), cerebral blood flow (CBF), and cerebral blood volume (CBV) can be determined for each pixel and perfusion maps could be generated [7,8].
A variety of post-processing programs and algorithms for DSC imaging have been recently made available by different MR manufacturers, workstation vendors, and academic groups. However, these programs and algorithms substantially differ in terms of manual or semiautomatic analysis of AIF and therefore in quantitative values in DSC [3,9]. Remarkably, these differences in the calculation methods result in different perfusion values, potentially affecting the diagnostic process within the clinical framework [7].
Furthermore, even if the same calculation method is implemented, results can sometimes be variable because different software packages have different implementations of the same algorithm.
Even though these differences between software packages have been already reported to prevent standardization in perfusion imaging for stroke [2] and brain tumors [10], a comparison of different post-processing algorithms for DSC perfusion imaging in MS patients is still missing.
Here we have compared different software packages for processing DSC perfusion images in a MS sample based on a time parameter such as TTP. Indeed, despite neuro-axonal injury, inflammation and demyelination are considered the pathological hallmark of MS [11,12], and white matter hemodynamic abnormalities have been reported in lesions, normal-appearing white (NAWM) and grey matter (NAGM) of patients [13]. Specifically, the altered cerebral perfusion might be due to neurovascular unit (NVU) dysfunction where changes in capillary resistance and neurovascular function increase the risk of developing WM and GM lesions [14,15].
In this context, TTP provides evidence of affected brain areas and it has been demonstrated to be inversely related to CBF in which reduction of blood flow results in an increase in the time needed for the contrast to reach its peak in the perfused volume of brain tissue [8]. TTP analysis could tightly identify AIF variations between two different post-processing algorithms in pathologies such as stable MS lesions characterized by hypoperfusion.
Indeed, the sensibility of these algorithms could be amplified when pathologies with low perfusion abnormalities are considered instead of lesions with high variability of perfusion rate and based on contrast leakage due to blood–brain barrier (BBB) breakdown such as tumors or acute ischemic lesions.
The aim is to verify if TTP can differentiate two different perfusion post-processing algorithms by studying small perfusion changes in lesions vs NAWM and GM, in MS patients.
Materials and Methods
Subjects
This study was retrospective conducted from October 2013 to June 2016. The written informed consent for MRI examination and privacy policy rules were acquired before performing MRI and the retrospective analysis of patients’ electronic records was done with no direct patient involvement. Seventy-four MS patients (30 men and 44 women) and 14 controls (2men and 12 women) were retrospectively selected among eighty-four MR perfusion examinations. Eleven of the 85 MRI examinations were excluded for low quality and artefacts. The mean age of the patients was 45.22 years (sd ±10.7) (range 22-68). The controls were considered healthy subjects for the anamnestic data, the absence of pathological MRI findings and other negative diagnostic approaches.
MR Imaging
A 1.5-Tesla MRI (Avanto; Siemens, Erlangen, Germany) was used for DSC imaging. DSC sequence was performed using the gradient echo (GRE)-EPI sequence. The scan parameters included time repetition (TR) of 1400 ms, Echo-time (TE) of 32 ms, field of view (FOV) of 230 mm, imaging matrix of 128 × 128, slice thickness of 5 mm, 19 sections, and 50 phases. Intravenous bolus of paramagnetic contrast agents [279.3 mg/ ml gadolinium-based compounds; 0.1 mmoli/Kg (0.2 ml/kg)] was injected at a rate of 4.5 mL/sec into the right antecubital vein, followed by saline chase of 20 mL at the same rate. The MS lesion load (recent and stable lesions) was defined by comparison between the last two MRI examinations for each patient and the perfusion analysis was performed only on the last MRI exam. The previous MRI exams performed with a time lapse more than six months were not considered and the patients not enrolled. The DSC acquisition was subsequently elaborated by using two different post-processing algorithms (A,B).
Data analysis
The DSC data were post-processed and TTP maps were generated using two different algorithms of commercially available software packages. TTP maps were successfully obtained using both analysis algorithms (A and B). After adjusting the window level and width for each map and using the same color scale for all subjects.
Both algorithms used the deconvolution of the AIF. Both deconvolution algorithms use singular value decomposition (SVD).
The middle cerebral artery (MCA) was used for AIF position and AIF deconvolution, this was done manually for software A while software B used automatic AIF positioning.
In software A, the positions of arterial input function and venous output function were manually set at the insular segment (M2) of the MCA on the better visualized vessel and at the posterior part of the superior sagittal sinus, respectively. Positioning was performed carefully to ensure consistency among all exams. Even if quantitative maps of cerebral blood flow (CBF), cerebral blood volume (CBV), and mean transit time (MTT) were generated, only time-to-peak (TTP) was considered for the comparison between these commercial software packages.
ROI measurements were conducted on the TTP maps by two neuroradiologists (A.M., T.C. 1 year of experience in perfusion post-processing under the supervisor L.M. with 25 years of experience). MS lesions were considered 1) stable if it was evident and unchanged in the previous MRI exam; 2) recent, if not present in the previous MR exam and 3) active if it is enhancedEach ROI was composed of 3 pixels. In each subject, ROI measures were performed in the same slice, same selected areas of NAWM, WM, GM and same lesions, using both postprocessing algorithms. ROIs of the same diameter were also placed in the contralateral and ipsilateral NAWM and GM and repeated for both post-processing packages.
Moreover, these ROIs were carefully placed to avoid large vessels (which appeared as a linear structure with high CBF), and all the ROIs were copied to achieve exactly the same ROI size and positions for the different algorithms. The TTP value of each ROI was then calculated as follows: TTP average of recent lesion, active lesion, stable lesion, (NAWM) (or WM) and GM.
Statistical analysis
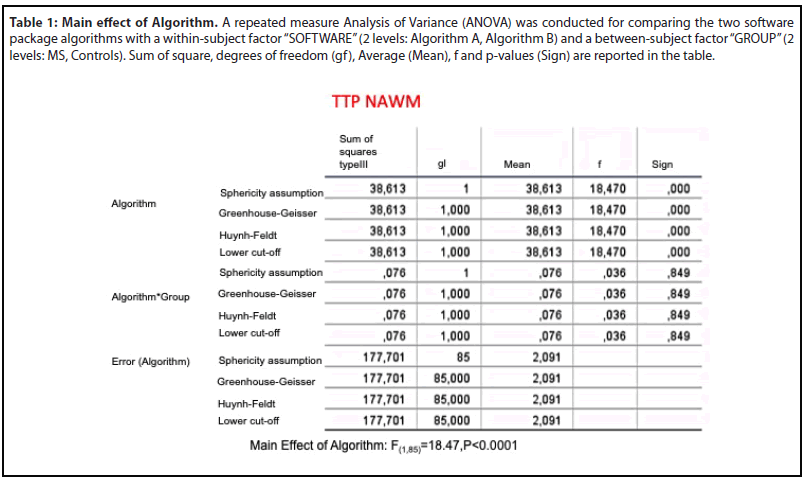
Differences in the TTP value between algorithms were compared for NAWM, WM, GM and each MS lesions (stable lesion, recent lesion without enhancement, enhanced lesion) using the Statistical Package for the Social Sciences (SPSS) software, version 20 [19]. We conducted a repeated measure Analysis of Variance (ANOVA) for TTP NAWM, comparing two software package algorithms (within-subject factor “SOFTWARE”; 2 levels: Algorithm A, Algorithm B) in two groups (between-subject factor “GROUP”; 2 levels: MS, Controls).
Moreover, paired t-tests were used to detect TTP changes for recent and stable lesion for the MS group. Mean and p-values for each group were calculated.
Results
Comparison of TTP values
As for TTP NAWM, no significant SOFWARE*GROUP interaction was found (F(1,86)=0.03, p=0.84). However, a significant main effect of SOFTWARE was reported (F(1,86)= 18.47, p< .0001). Mean and p-values for each group are summarized in Table 1.
Pairwise post-hoc comparisons (Figure 3a) revealed significantly higher values for the Algorithm B compared to Algorithm A (Mean Difference=1.28, p<0.0001).
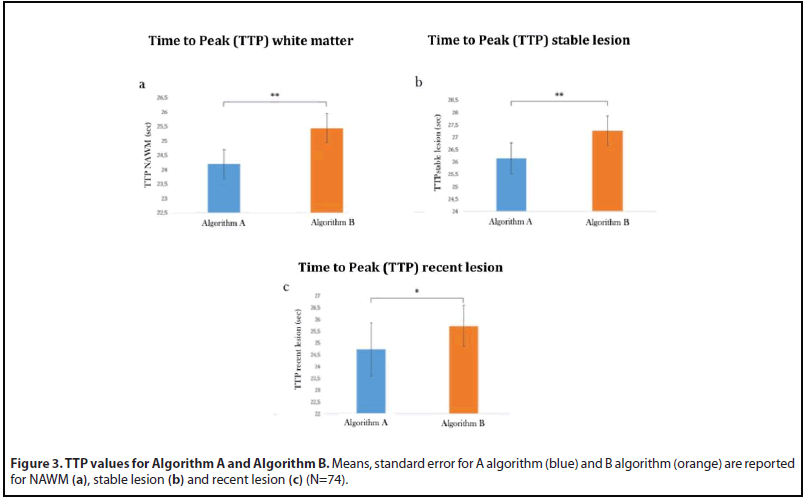
Moreover, paired t-tests revealed a significant effect of SOFTWARE both for TTP recent lesion (Figure 3b) (Algorithm B> Algorithm A Mean Difference: -0.99, t=-2.71, p=0.01) and TTP stable lesion (Figure 3c)(Algorithm B> Algorithm A: Mean Difference: -1.11, t=-4.91, p<0.0001). TTP distinguish in both the algorithms stable lesion from WM and GM while the difference between WM and GM is not statistically different when the algorithm A is used. (Table 2a,b).
| Table 2a: Algorithm A: TTP data analysis. | ||
| N°74 Patients | Mean difference | p (t student test) |
| Stable lesion vs recent lesion without enhancement | 1.41 | 0.26 |
| Stable vs recent lesion with enhancement | 0.94 | 0.81 |
| Recent lesion with enhancement vs recent lesion without enhancement | 0.47 | 0.90 |
| Stable lesion VS NAWM | 2.36 | 0.0057 |
| NAWM VS recent lesion without enhancement | -0.95 | 0.45 |
| Lesione con enhancement VS NAWM | 1.42 | 0.72 |
| Stable lesion VS GM | 2.92 | 0.0003 |
| Recent lesion without enhancement VS GM | 1.51 | 0.23 |
| Recent lesion with enhancement VS GM | 1.98 | 0.62 |
| NAWM VS GM | 0.56 | 0.45 |
| Table 2b: Algorithm B: TTP data analysis. | ||
| N°74 Patients | Mean difference | p (t student test) |
| Stable lesion vs recent lesion without enhancement | 2.0 | 0.05 |
| Stable vs recent lesion with enhancement | 0.46 | 0.90 |
| recent lesion with enhancement vs recent lesion without enhancement | 1.54 | 0.69 |
| Stable lesion VS NAWM | 1.69 | 0.02 |
| NAWM VS recent lesion without enhancement | 0.31 | 0.73 |
| recent lesion with enhancement VS NAWM | 1.23 | 0.75 |
| Stable lesion VS GM | 3.21 | 1,90E-05 |
| recent lesion without enhancement VS GM | 1.21 | 0.18 |
| recent lesion with enhancement VS GM | 2.75 | 0.49 |
| NAWM VS GM | 1.52 | 0.0089 |
Table 2: (a,b): TTP data analysis. By using Algorythm A the TTP difference is statistical significant when stable lesion is compared with WM and GM. Differently, no significant difference is demonstrated between WM and GM(a); by using Algorythm B the TTP values are significantly different among stable lesion, WM,GM and between WM and GM (b).
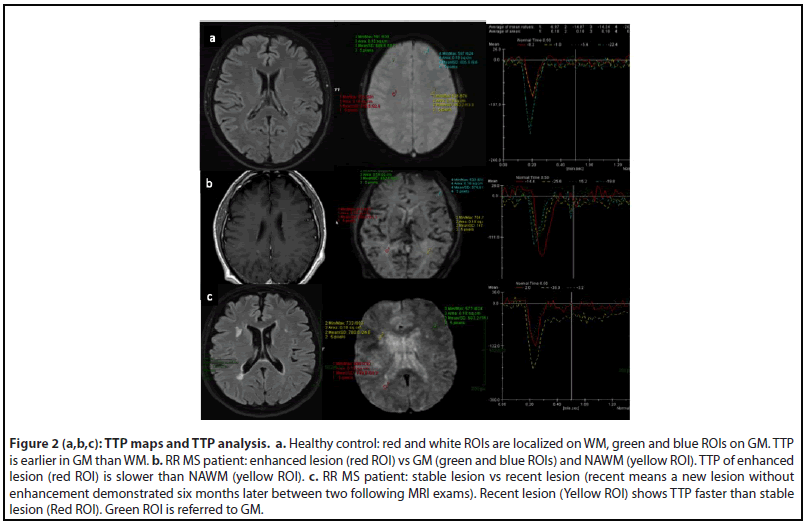
TTP curves were graphically demonstrated for each ROI localized on MS lesion, GM and NAWM. ROI on recent MS lesion without enhancement showed a “peak” of TTP curve faster than ROI on stable MS lesion. ROI on enhanced MS lesion showed a “peak” of TTP curve slower than NAWM (Figure 2).
Discussion
To compare scientific results among different centres, the standardization of scanning protocols, procedures of contrast agent administration, and data processing are needed.
To create the possibility of a large homogeneous databank not only for morphologic/volumetric findings, but also for semiquantitative cerebral perfusion values, it is crucial to reduce post-processing intervenor differences.
Interestingly, multiple studies have already raised this potential issue for lesions with high variability of perfusion rate based on contrast leakage due to blood–brain barrier (BBB) breakdown such as in tumors [10] or acute ischemic lesions [16].
Our results have identified a comparable and reliable parameter TTP in lesions with minimal perfusion changes, with no contrast leakage between pathology and normal tissue. Because the majority of the analyzed MS lesions were negative for morphological BBB permeability leakage (no enhanced lesion) after ev contrast medium administration, the perfusion changes demonstrated through the TTP analysis overcome the morphological data of BBB permeability leakage Indeed, different TTP curves resulted from different lesions (i.e stable vs recent without enhancement) could explain different pathophysiological frame and therefore optimize follow-up and therapy of MS patient (Figure 2).
Specifically, using specific denoising procedures, some software might have a ceiling threshold for perfusion parameters such as CBV and introduce significant differences between applications. Indeed, the actual implementation of each commercial software perfusion analysis is often obscure and the differences could be due to the different sensitivity of smoothing effect in area under the curve (AUC) and singular - value decomposition (SVD). Some commercial algorithms, as algorithm A in our study, let the user control the AIF determination in SVD and to introduce variations of perfusion parameter calculations. Others, such as algorithm B, did not allow the user to modify this parameter. Another possible source of variation among software packages may be baseline correction and curve fitting. In our study MS lesions without BBB breakdown have been considered and it is known that only in pathologies that have contrast leakage, baseline correction significantly affected perfusion parameters such as rCBV. The quantitative values emerging from CBV, CBF, MTT maps are semi-quantitative relative values and could be affected by many technical variables, while the TTP value is calculated by AIF and its measurement unit is time which is universal. Susceptibility to AIF is one of most important issues in post-processing and its standardization is an advantage.
Considering a state of equality for the perfusion acquisition methodology, comparable perfusion values could be reached by automated procedures for AIF as demonstrated by our results.
Indeed, a significant difference has been noticed between stable lesion vs NAWM, stable lesion vs GM and WM vs GM by using software B while software A has not statistically discriminated between WM vs GM (Table 2a,b)
The lack of a statistically significant difference between WM vs GM using software A could magnify the importance of standardization of AIF .
Brain pathologies with high or low perfusion patterns (i.e respectively tumor and ischemic stroke) show semiquantitative values extremely different from the normal tissue. Indeed, all perfusion parameters are able to discriminate lesion from normal tissue by using both algorithms (automatic or manual). When the brain lesions present a different pathophysiology and pathological perfusion values are similar to the normal tissue (i.e multiple sclerosis) the discrimination between lesion and normal tissue is diminished and depending on the postprocessing algorithm. Among the perfusion parameters, the TTP, expressed in an absolute measure unit such as time, could actually relate to disease pathophysiology and discriminate the difference between post-processing packages.
Conclusion
Quantitative analysis aims to provide a link between the tissue signal enhancement and physiologically relevant phenomena such as microvascular permeability, blood flow, blood volume and cerebral circulation time [17].
Clinical results showed significant promise of the method for tissue characterization by perfusion patterns and for functional studies in the evaluation of the pathophysiology of brain tumors and/or brain ischemia. Both pathologies showed severe BBB breakdown and ceiling perfusion alterations are better to quantify. In MS, TTP could help to distinguish the timing of lesions because the TTP shows a significant statistical difference between stable lesion without enhancement and NAWM or GM and it could be important for MRI follow-up of MS patients.
In this study, TTP has been able to examine the variability in the quantitative results of DSC MR perfusion imaging generated from identical source data of MS patients, to identify the variables between two commercial post-processing algorithm and to focus on crucial role of post-processing intervendor differences.
Acknowledgments
The authors thank TSRM Mrs. T. Caselli, TSRM Mr. M. Cinci, TSRM Mr. P. Gambini della Scala and Mr. M. Senesi for their technical assistance and competence.
Financial Disclosures
All authors report no conflict of interest. No disclosures to report.
References
2. Vilela P, Rowley HA. Brain ischemia: CT and MRI techniques in acute ischemic stroke. European Journal of Radiology. 2017 Nov 1; 96:162-72.
3. Kudo K, Uwano I, Hirai T, Murakami R, Nakamura H, Fujima N, et al. Comparison of different post-processing algorithms for dynamic susceptibility contrast perfusion imaging of cerebral gliomas. Magnetic Resonance in Medical Sciences. 2017; 16(2):129.
4. Binnewijzend MA, Benedictus MR, Kuijer JP, van der Flier WM, Teunissen CE, Prins ND, et al. Cerebral perfusion in the predementia stages of Alzheimer’s disease. European Radiology. 2016 Feb 1; 26(2):506-14.
5. Lagana MM, Pelizzari L, Baglio F. Relationship between MRI perfusion and clinical severity in multiple sclerosis. Neural Regeneration Research. 2020 Apr;15(4):646.
6. Hachaj T, Ogiela MR. A system for detecting and describing pathological changes using dynamic perfusion computer tomography brain maps. Computers in Biology and Medicine. 2011 Jun 1; 41(6):402-10.
7. Huang W, Chen Y, Fedorov A, Li X, Jajamovich GH, Malyarenko DI, et al. The impact of arterial input function determination variations on prostate dynamic contrast-enhanced magnetic resonance imaging pharmacokinetic modeling: a multicenter data analysis challenge. Tomography. 2016 Mar; 2(1):56-66.
8. Østergaard L. Principles of cerebral perfusion imaging by bolus tracking. Journal of Magnetic Resonance Imaging: An Official Journal of the International Society for Magnetic Resonance in Medicine. 2005 Dec;22(6):710-7.
9. Bell LC, Semmineh N, An H, Eldeniz C, Wahl R, Schmainda KM, et al. Evaluating multisite rCBV consistency from DSC-MRI imaging protocols and postprocessing software across the NCI Quantitative Imaging Network sites using a digital reference object (DRO). Tomography. 2019 Mar;5(1):110-7.
10. Sunwoo L, Choi SH, Yoo RE, Kang KM, Yun TJ, Kim TM, et al. Paradoxical perfusion metrics of high-grade gliomas with an oligodendroglioma component: quantitative analysis of dynamic susceptibility contrast perfusion MR imaging. Neuroradiology. 2015 Nov; 57(11):1111-20.
11. Haines JD, Inglese M, Casaccia P. Axonal damage in multiple sclerosis. Mount Sinai Journal of Medicine: A Journal of Translational and Personalized Medicine. 2011 Mar; 78(2):231-43.
12. Ziemssen T, Akgün K, Brück W. Molecular biomarkers in multiple sclerosis. Journal of neuroinflammation. 2019 Dec; 16(1):1-1.
13. Lapointe E, Li DK, Traboulsee AL, Rauscher A. What have we learned from perfusion MRI in multiple sclerosis?. American Journal of Neuroradiology. 2018 Jun 1; 39(6):994-1000.
14. Ge Y, Law M, Johnson G, Herbert J, Babb JS, Mannon LJ, et al. Dynamic susceptibility contrast perfusion MR imaging of multiple sclerosis lesions: characterizing hemodynamic impairment and inflammatory activity. American Journal of Neuroradiology. 2005 Jun 1; 26(6):1539-47.
15. Sivakolundu DK, West KL, Maruthy GB, Zuppichini M, Turner MP, Abdelkarim D, et al. Reduced arterial compliance along the cerebrovascular tree predicts cognitive slowing in multiple sclerosis: Evidence for a neurovascular uncoupling hypothesis. Multiple Sclerosis Journal. 2020 Oct; 26(12):1486-96.
16. Kudo K, Sasaki M, Yamada K, Momoshima S, Utsunomiya H, Shirato H, et al. Differences in CT perfusion maps generated by different commercial software: quantitative analysis by using identical source data of acute stroke patients. Radiology. 2010 Jan; 254(1):200-9.
17. Monti L, Morbidelli L, Rossi A. Impaired cerebral perfusion in multiple sclerosis: relevance of endothelial factors. Biomarker Insights. 2018 May 17;13:1177271918774800.